I’ve seen my fair share of risk assessments listing data quality or bias as hazards. I tend to think that is pretty sloppy. I especially see this a lot in conversations around AI/ML. Data quality is not a risk. It is a causal factor in the failure or severity.
Data Quality and Data Bias
Data Quality
Data quality refers to how well a dataset meets certain criteria that make it fit for its intended use. The key dimensions of data quality include:
- Accuracy – The data correctly represents the real-world entities or events it’s supposed to describe.
- Completeness – The dataset contains all the necessary information without missing values.
- Consistency – The data is uniform and coherent across different systems or datasets.
- Timeliness – The data is up-to-date and available when needed.
- Validity – The data conforms to defined business rules and parameters.
- Uniqueness – There are no duplicate records in the dataset.
High-quality data is crucial for making informed quality decisions, conducting accurate analyses, and developing reliable AI/ML models. Poor data quality can lead to operational issues, inaccurate insights, and flawed strategies.
Data Bias
Data bias refers to systematic errors or prejudices present in the data that can lead to inaccurate or unfair outcomes, especially in machine learning and AI applications. Some common types of data bias include:
- Sampling bias – When the data sample doesn’t accurately represent the entire population.
- Selection bias – When certain groups are over- or under-represented in the dataset.
- Reporting bias – When the frequency of events in the data doesn’t reflect real-world frequencies.
- Measurement bias – When the data collection method systematically skews the results.
- Algorithmic bias – When the algorithms or models introduce biases in the results.
Data bias can lead to discriminatory outcomes and produce inaccurate predictions or classifications.
Relationship between Data Quality and Bias
While data quality and bias are distinct concepts, they are closely related:
- Poor data quality can introduce or exacerbate biases. For example, incomplete or inaccurate data may disproportionately affect certain groups.
- High-quality data doesn’t necessarily mean unbiased data. A dataset can be accurate, complete, and consistent but still contain inherent biases.
- Addressing data bias often involves improving certain aspects of data quality, such as completeness and representativeness.
Organizations must implement robust data governance practices to ensure high-quality and unbiased data, regularly assess their data for quality issues and potential biases, and use techniques like data cleansing, resampling, and algorithmic debiasing.
Identifying the Hazards and the Risks
It is critical to remember the difference between a hazard and a risk. Data quality is a causal factor in the hazard, not a harm.
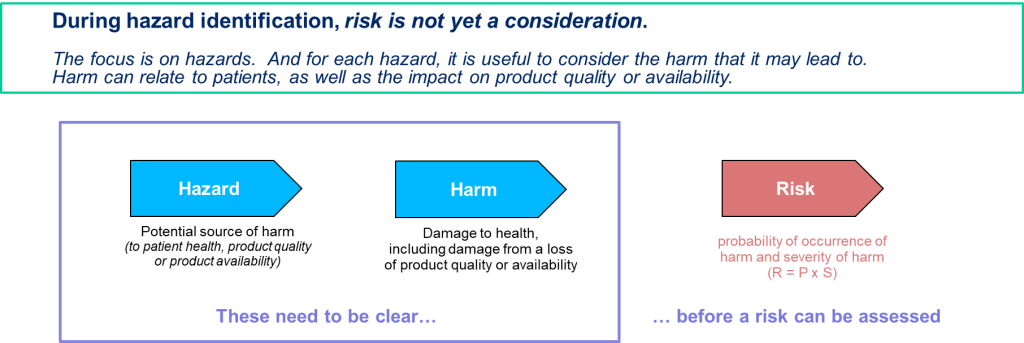
Think of it like a fever. An open wound is a causal factor for the fever, which has a root cause of poor wound hygiene. I can have the factor (the wound), but without the presence of the root cause (poor wound hygiene), the event (fever) would not develop (okay, there may be other root causes in play as well; remember there is never really just one root cause).
Potential Issues of Poor Data Quality and Inadequate Data Governance
The risks associated with poor data quality and inadequate data governance can significantly impact organizations. Here are the key areas where risks can develop:
Decreased Data Quality
- Inaccurate, incomplete, or inconsistent data leads to flawed decision-making
- Errors in customer information, product details, or financial data can cause operational issues
- Poor quality data hinders effective analysis and forecasting
Compliance Failures:
- Non-compliance with regulations can result in regulatory actions
- Legal complications and reputational damage from failing to meet regulatory requirements
- Increased scrutiny from regulatory bodies
Security Breaches
- Inadequate data protection increases vulnerability to cyberattacks and data breaches
- Financial costs associated with breach remediation, legal fees, and potential fines
- Loss of customer trust and long-term reputational damage
Operational Inefficiencies
- Time wasted on manual data cleaning and correction
- Reduced productivity due to employees working with unreliable data
- Inefficient processes resulting from poor data integration or inconsistent data formats
Missed Opportunities
- Failure to identify market trends or customer insights due to unreliable data
- Missed sales leads or potential customers because of inaccurate contact information
- Inability to capitalize on business opportunities due to lack of trustworthy data
Poor Decision-Making
- Decisions based on inaccurate or incomplete data leading to suboptimal outcomes, including deviations and product/study impact
- Misallocation of resources due to flawed insights from poor quality data
- Inability to effectively measure and improve performance
Potential Issues of Data Bias
Data bias presents significant risks across various domains, particularly when integrated into machine learning (ML) and artificial intelligence (AI) systems. These risks can manifest in several ways, impacting both individuals and organizations.
Discrimination and Inequality
Data bias can lead to discriminatory outcomes, systematically disadvantaging certain groups based on race, gender, age, or socioeconomic status. For example:
- Judicial Systems: Biased algorithms used in risk assessments for bail and sentencing can result in harsher penalties for people of color compared to their white counterparts, even when controlling for similar circumstances.
- Healthcare: AI systems trained on biased medical data may provide suboptimal care recommendations for minority groups, potentially exacerbating health disparities.
Erosion of Trust and Reputation
Organizations that rely on biased data for decision-making risk losing the trust of their customers and stakeholders. This can have severe reputational consequences:
- Customer Trust: If customers perceive that an organization’s AI systems are biased, they may lose trust in the brand, leading to a decline in customer loyalty and revenue.
- Reputation Damage: High-profile cases of AI bias, such as discriminatory hiring practices or unfair loan approvals, can attract negative media attention and public backlash.
Legal and Regulatory Risks
There are significant legal and regulatory risks associated with data bias:
- Compliance Issues: Organizations may face legal challenges and fines if their AI systems violate anti-discrimination laws.
- Regulatory Scrutiny: Increasing awareness of AI bias has led to calls for stricter regulations to ensure fairness and accountability in AI systems.
Poor Decision-Making
Biased data can lead to erroneous decisions that negatively impact business operations:
- Operational Inefficiencies: AI models trained on biased data may make poor predictions, leading to inefficient resource allocation and operational mishaps.
- Financial Losses: Incorrect decisions based on biased data can result in financial losses, such as extending credit to high-risk individuals or mismanaging inventory.
Amplification of Existing Biases
AI systems can perpetuate and even amplify existing biases if not properly managed:
- Feedback Loops: Biased AI systems can create feedback loops where biased outcomes reinforce the biased data, leading to increasingly skewed results over time.
- Entrenched Inequities: Over time, biased AI systems can entrench societal inequities, making it harder to address underlying issues of discrimination and inequality.
Ethical and Moral Implications
The ethical implications of data bias are profound:
- Fairness and Justice: Biased AI systems challenge the principles of fairness and justice, raising moral questions about using such technologies in critical decision-making processes.
- Human Rights: There are concerns that biased AI systems could infringe on human rights, particularly in areas like surveillance, law enforcement, and social services.
Perform the Risk Assessment
Risk Management happens at the system/process level, where an AI/ML solution will be used. As appropriate, it drills down to the technology level. Never start with the technology level.
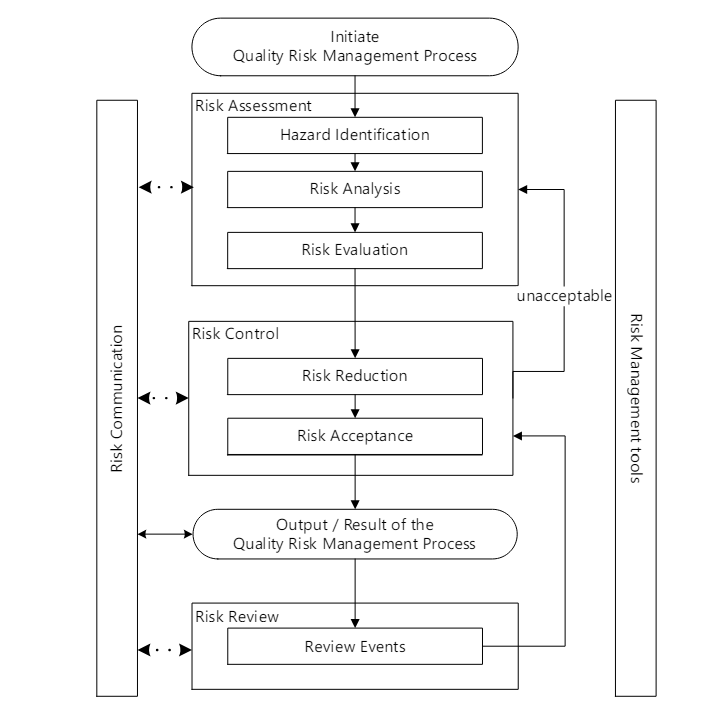
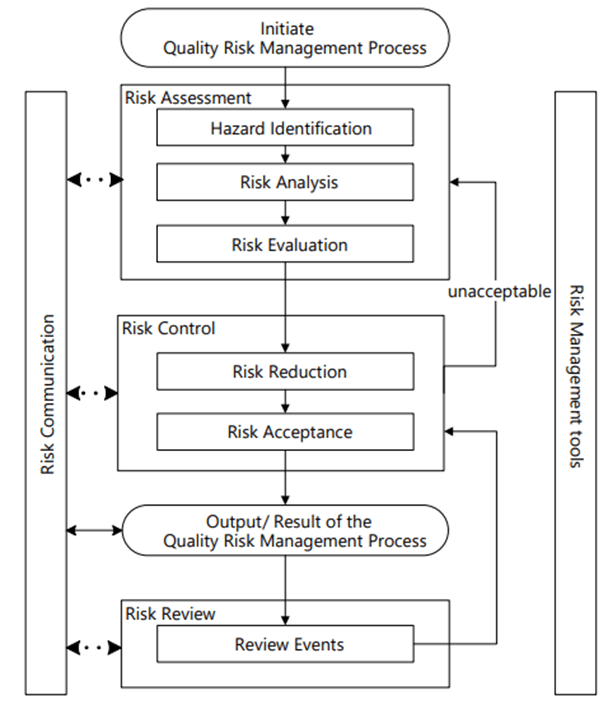
Hazard Identification
It is important to identify product quality hazards that may ultimately lead to patient harm. What is the hazard of that bad decision? What is the hazard of bad quality data? Those are not hazards; they are causes.
Hazard identification, the first step of a risk assessment, begins with a well-defined question defining why the risk assessment is being performed. It helps define the system and the appropriate scope of what will be studied. It addresses the “What might go wrong?” question, including identifying the possible consequences of hazards. The output of the hazard identification step is the identification of the possibilities (i.e., hazards) that the risk event (e.g., impact to product quality) happens.
The risk question takes the form of “What is the risk of using AI/ML solution for <Process/System> to <purpose of AI/MIL solution.” For example, “What is the risk of using AI/ML to identify deviation recurrence and help prioritize CAPAs?” or “What is the risk of using AI/ML to monitor real-time continuous manufacturing to determine the need to evaluate for a potential diversion?”
Process maps, data maps, and knowledge maps are critical here.
We can now identify the specific failure modes associated with AI/ML. This may involve deeep dive risk assessments. A failure mode is the specific way a failure occurs. So in this case, the specific way that bad data or bad decision making can happen. Multiple failure modes can, and usually do, lead to the same hazardous situation.
Make sure you drill down on failure causes. If more than 5 potential causes can be identified for a proposed failure mode, it is too broad and probably written at a high level in the process or item being risk assessed. It should be broken down into several specific failure modes with fewer potential causes and more manageable.
Start with an outline of how the process works and a description of the AI/ML (special technology) used in the process. Then, interrogate the following for potential failure modes:
- The steps in the process or item under study in which AI/ML interventions occur;
- The process/procedure documentation for example, master batch records, SOPs, protocols, etc.
- Current and proposed process/procedure in sufficient detail to facilitate failure mode identification;
- Critical Process Controls