Statistical Process Control (SPC) is both a standalone methodology and a critical component of broader quality management systems. Rooted in statistical principles, SPC enables organizations to monitor, control, and improve processes by distinguishing between inherent (common-cause) and assignable (special-cause) variation. This blog post explores SPC’s role in modern quality strategies, control charts as its primary tools, and practical steps for implementation, while emphasizing its integration into holistic frameworks like Six Sigma and Quality by Design (QbD).
SPC as a Methodology and Its Strategic Integration
SPC serves as a core methodology for achieving process stability through statistical tools, but its true value emerges when embedded within larger quality systems. For instance:
- Quality by Design (QbD): In pharmaceutical manufacturing, SPC aligns with QbD’s proactive approach, where critical process parameters (CPPs) and material attributes are predefined using risk assessment. Control charts monitor these parameters to ensure they remain within Normal Operating Ranges (NORs) and Proven Acceptable Ranges (PARs), safeguarding product quality.
- Six Sigma: SPC tools like control charts are integral to the “Measure” and “Control” phases of the DMAIC (Define-Measure-Analyze-Improve-Control) framework. By reducing variability, SPC helps achieve Six Sigma’s goal of near-perfect processes.
- Regulatory Compliance: In regulated industries, SPC supports Ongoing Process Verification (OPV) and lifecycle management. For example, the FDA’s Process Validation Guidance emphasizes SPC for maintaining validated states, requiring trend analysis of quality metrics like deviations and out-of-specification (OOS) results.
This integration ensures SPC is not just a technical tool but a strategic asset for continuous improvement and compliance.
When to Use Statistical Process Control
SPC is most effective in environments where process stability and variability reduction are critical. Below are key scenarios for its application:
High-Volume Manufacturing
In industries like automotive or electronics, where thousands of units are produced daily, SPC identifies shifts in process mean or variability early. For example, control charts for variables data (e.g., X-bar/R charts) monitor dimensions of machined parts, ensuring consistency across high-volume production runs. The ASTM E2587 standard highlights that SPC is particularly valuable when subgroup data (e.g., 20–25 subgroups) are available to establish reliable control limits.
Batch Processes with Critical Quality Attributes
In pharmaceuticals or food production, batch processes require strict adherence to specifications. Attribute control charts (e.g., p-charts for defect rates) track deviations or OOS results, while individual/moving range (I-MR) charts monitor parameters.
Regulatory and Compliance Requirements
Regulated industries (e.g., pharmaceutical, medical devices, aerospace) use SPC to meet standards like ISO 9001 or ICH Q10. For instance, SPC’s role in Continious Process Verification (CPV) ensures processes remain in a state of control post-validation. The FDA’s emphasis on data-driven decision-making aligns with SPC’s ability to provide evidence of process capability and stability.
Continuous Improvement Initiatives
SPC is indispensable in projects aimed at reducing waste and variation. By identifying special causes (e.g., equipment malfunctions, raw material inconsistencies), teams can implement corrective actions. Western Electric Rules applied to control charts detect subtle shifts, enabling root-cause analysis and preventive measures.
Early-Stage Process Development
During process design, SPC helps characterize variability and set realistic tolerances. Exponentially Weighted Moving Average (EWMA) charts detect small shifts in pilot-scale batches, informing scale-up decisions. ASTM E2587 notes that SPC is equally applicable to both early-stage development and mature processes, provided rational subgrouping is used.
Supply Chain and Supplier Quality
SPC extends beyond internal processes to supplier quality management. c-charts or u-charts monitor defect rates from suppliers, ensuring incoming materials meet specifications.
In all cases, SPC requires sufficient data (typically ≥20 subgroups) and a commitment to data-driven culture. It is less effective in one-off production or where measurement systems lack precision.
Control Charts: The Engine of SPC
Control charts are graphical tools that plot process data over time against statistically derived control limits. They serve two purposes:
- Monitor Stability: Detect shifts or trends indicating special causes.
- Drive Improvement: Provide data for root-cause analysis and corrective actions.
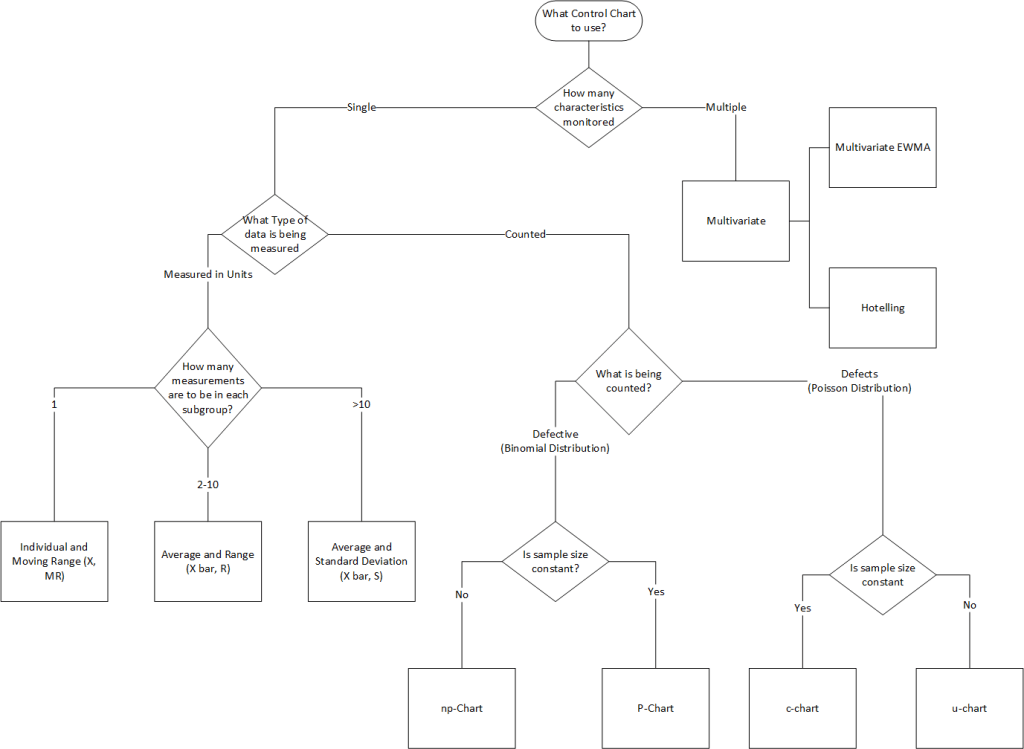
Types of Control Charts
Control charts are categorized by data type:
| Data Type | Chart Type | Use Case |
|---|---|---|
| Variables (Continuous) | X-bar & R | Monitor process mean and variability (subgroups of 2–10). |
| X-bar & S | Similar to X-bar & R but uses standard deviation. | |
| Individual & Moving Range (I-MR) | For single measurements (e.g., batch processes). | |
| Attributes (Discrete) | p-chart | Proportion of defective units (variable subgroup size). |
| np-chart | Number of defective units (fixed subgroup size). | |
| c-chart | Count of defects per unit (fixed inspection interval). | |
| u-chart | Defects per unit (variable inspection interval). |
Decision Rules: Western Electric and Nelson Rules
Control charts become actionable when paired with decision rules to identify non-random variation:
Western Electric Rules
A process is out of control if:
- 1 point exceeds 3σ limits.
- 2/3 consecutive points exceed 2σ on the same side.
- 4/5 consecutive points exceed 1σ on the same side.
- 8 consecutive points trend upward/downward.
Nelson Rules
Expands detection to include:
- 6+ consecutive points trending.
- 14+ alternating points (up/down).
- 15 points within 1σ of the mean.
Note: Overusing rules increases false alarms; apply judiciously.
SPC in Control Strategies and Trending
SPC is vital for maintaining validated states and continuous improvement:
- Control Strategy Integration:
- Define Normal Operating Ranges (NORs) and Proven Acceptable Ranges (PARs) for CPPs.
- Set alert limits (e.g., 2σ) and action limits (3σ) for KPIs like deviations or OOS results.
- Trending Practices:
- Quarterly Reviews: Assess control charts for special causes.
- Annual NOR Reviews: Re-evaluate limits after process changes.
- CAPA Integration: Investigate trends and implement corrective actions.
Conclusion
SPC is a powerhouse methodology that thrives when embedded within broader quality systems. By aligning SPC with control strategies—through NORs, PARs, and structured trending—organizations achieve not just compliance, but excellence. Whether in pharmaceuticals, manufacturing, or beyond, SPC remains a timeless tool for mastering variability.
