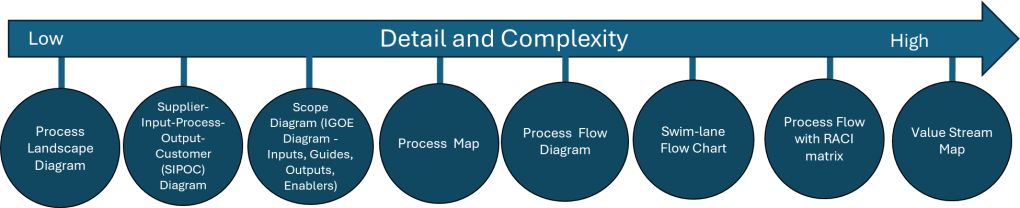
Continuing our look a process mapping tools.
Process Flow Diagram
A process flow diagram is a visual representation of the steps in a process, showing the sequence of activities from start to finish. Using simple shapes and arrows, it maps out how work flows through your system, highlighting decision points, inputs, outputs, and the relationships between different steps. When most people think process map they really mean process flow.
When to Use Process Flow Diagrams
Process flow diagrams shine in various scenarios:
- Analyzing existing processes: They help identify inefficiencies, bottlenecks, and redundancies in current workflows.
- Designing new processes: When creating new procedures, flow diagrams provide a clear blueprint for implementation.
- Training and onboarding: They serve as excellent visual aids for explaining processes to new team members.
- Continuous improvement initiatives: Flow diagrams facilitate discussions about potential enhancements and streamlining opportunities.
- Compliance and auditing: They offer a standardized way to document processes for regulatory purposes.
Creating Effective Process Flow Diagrams
To make the most of your diagrams:
- Start with the big picture: Begin by outlining the major steps before diving into details.
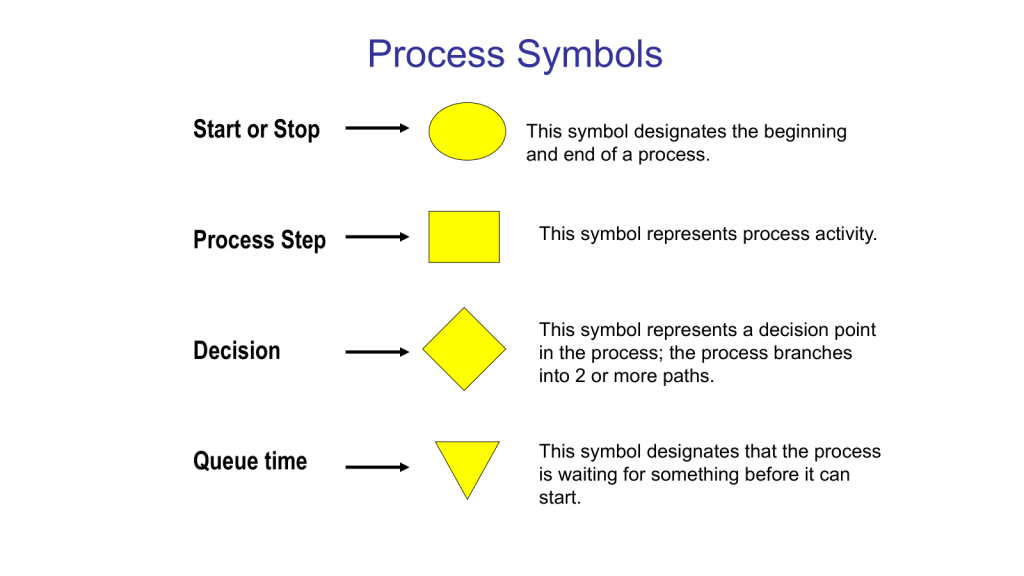
- Use standard symbols: Stick to commonly recognized shapes (e.g., rectangles for activities, diamonds for decisions) to ensure clarity.
- Keep it simple: Avoid cluttering your diagram with too much information. Focus on the key steps and decision points.
- Involve the right people: Collaborate with those who actually perform the process to ensure accuracy.
- Review and refine: Regularly update your diagrams as processes evolve.
Benefits of Using Process Flow Diagrams
Process flow diagrams are truly one of the core quality tools. With them we can:
- Improve communication: They provide a common visual language for discussing processes across teams.
- Enhance efficiency: By clearly mapping out steps, you can more easily identify areas for optimization.
- Better decision-making: Flow diagrams help managers understand the implications of process changes.
- Increase standardization: They promote consistency in how tasks are performed across the organization.
Process flow diagrams are more than just pretty pictures – they’re powerful tools for understanding, improving, and communicating about your business processes. By incorporating them into your workflow analysis and design efforts, you’ll be taking a significant step towards operational excellence.
This is the level of process mapping that usually sits at the heart of the SOP.
Swim-Lane Flowchart
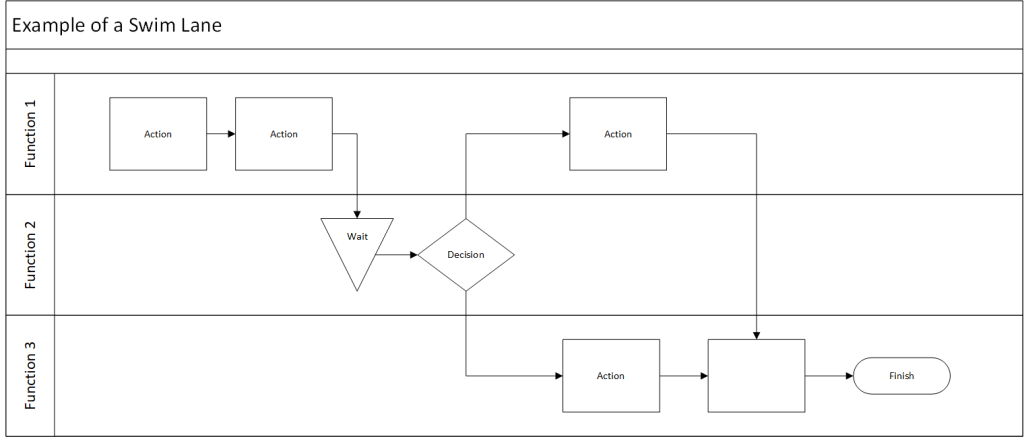
A swim lane flowchart, also known as a swim lane diagram or cross-functional flowchart, is a visual representation of a process that separates activities into distinct lanes. Each lane typically represents a different department, team, or individual responsible for a set of actions within the process.
Key Benefits of Swim Lane Flowcharts
- Clear Responsibility Assignment: By dividing the process into lanes, it’s immediately clear which team or individual is responsible for each step.
- Improved Communication: These diagrams provide a common visual language for discussing processes across departments.
- Identify Handoffs and Bottlenecks: Easily spot where work passes between teams and where delays might occur.
- Process Optimization: Visualizing the entire process helps identify redundancies and opportunities for streamlining.
- Onboarding and Training: New team members can quickly grasp complex processes and their role within them.
Creating an Effective Swim Lane Flowchart
To make the most of this tool:
- Define the Process Scope: Clearly identify the start and end points of the process you’re mapping.
- Identify Participants: Determine which departments or roles will have their own lanes.
- Map the Process: Use standard flowchart symbols to represent steps, decisions, and document flows.
- Show Handoffs: Clearly indicate where work passes from one lane to another.
- Review and Refine: Collaborate with stakeholders to ensure accuracy and identify improvement opportunities.
Data Maps are an example of a swim lane flow chart.
Process Flow with RACI Matrix
Here’s a blog post on process flow with RACI matrix:
Mastering Process Management: Combining Process Flow with RACI Matrix
This tool merges two powerful tools stand out for their ability to clarify complex workflows: the process flow diagram and the RACI matrix. When combined, these tools create a comprehensive view of not just how a process unfolds, but also who’s involved at each step. Let’s dive into this dynamic duo and explore how they can revolutionize your process management.
- Process Flow Diagram: This visual representation maps out the sequence of steps in a process, showing how work progresses from start to finish.
- RACI Matrix: This responsibility assignment chart clarifies the roles people play in each process step:
- Responsible: Who does the work?
- Accountable: Who makes the final decisions?
- Consulted: Who provides input?
- Informed: Who needs to be kept in the loop?
When you combine a process flow with a RACI matrix, you create a comprehensive view of your process that answers two critical questions:
- What happens in the process?
- Who’s involved at each step?
This integration strives to provide clarity of roles. It becomes immediately clear who’s responsible for each step, reducing confusion and improving accountability. Team members can easily see where they fit into the larger process and who they need to interact with. This should hopefully help balance resources and streamline decision-making. It is a great tool for training.
Creating Your Integrated Diagram
To build your process flow with RACI matrix:
- Start with Your Process Flow: Map out the steps of your process using standard flowchart symbols.
- Add RACI Information: For each step, indicate the R, A, C, and I roles. This can be done through color-coding, symbols, or additional columns next to each step.
- Review and Refine: Collaborate with stakeholders to ensure the diagram accurately reflects both the process and the roles involved.
- Use It: Implement the diagram in your operations, referring to it for training, process improvement, and day-to-day management.
Example
Imagine a verification process:
- Requirements Gathering (R: Business Analyst, A: Molecule Steward, C: Quality, Engineers, Operations)
- Design (R: Engineer, A: Molecule Steward, I: Validation)
- Verification (R: Validation A: Quality, C: Engineers, I: Molecule Steward)
- Deployment (R: Operations, A: Molecule Steward C: Quality, I: All Stakeholders)
Integrating process flows with RACI matrices creates a powerful tool for process management. It not only shows how work gets done but also clarifies who’s involved every step of the way. This comprehensive view can lead to more efficient operations, clearer communication, and ultimately, better business outcomes.
Value Stream Map
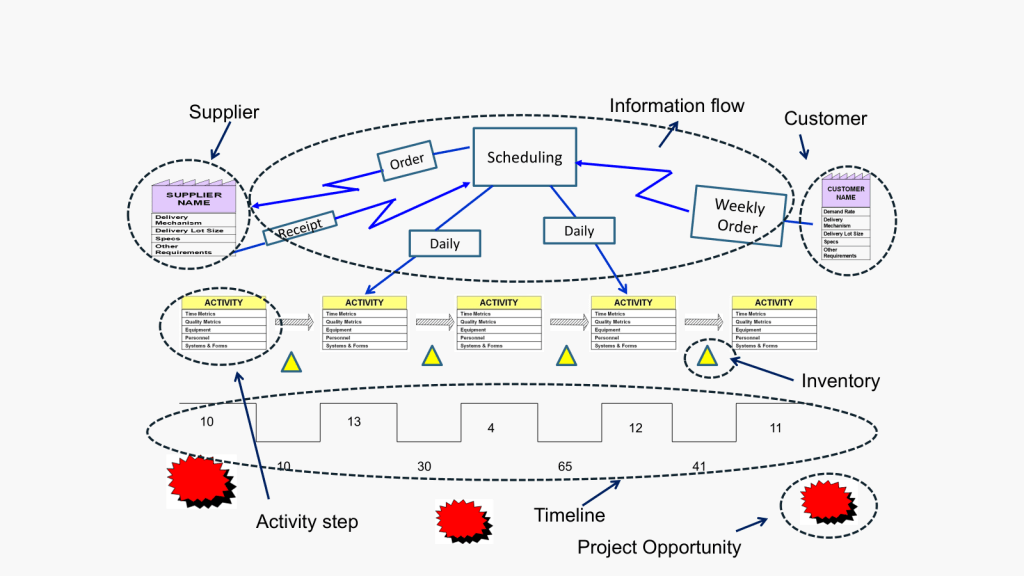
Value Stream Mapping (CSM) is a process mapping technique used to analyze, design, and manage the flow of materials and information required to bring a product or service to a customer. It is a visual representation of every step in your process, from the initial order to the final delivery of the product or service.
Coming out of Lean and organization excellence the value stream map is all about identifying waste: VSM helps you spot non-value-adding activities in your processes, allowing you to eliminate them and improve efficiency.
How to Create a Value Stream Map
- Create a Current State Map: Document your process as it currently exists, including material and information flows.
- Analyze the Current State: Identify areas of waste and inefficiency in your current process.
- Design a Future State Map: Envision an improved process that eliminates the identified waste.
- Implement Changes: Develop and execute a plan to move from the current state to the future state.
- Review and Iterate: Continuously monitor your new process and make further improvements as needed.
Best Practices for Value Stream Mapping
- Involve Cross-Functional Teams: Ensure representatives from all relevant departments participate in the mapping process.
- Focus on the Customer: Always keep the end customer’s needs in mind when analyzing and improving your processes.
- Use Standard Symbols: Adopt a consistent set of symbols to represent different elements of your value stream.
- Walk the Process: Physically follow the flow of materials and information to gain a firsthand understanding of your processes.
- Measure Key Metrics: Collect data on important metrics like cycle time, lead time, and inventory levels to quantify improvements.

2 thoughts on “Process Mapping as a Scaling Solution (part 2)”