Understanding how to measure success and risk is critical for organizations aiming to achieve strategic objectives. As we develop Quality Plans and Metric Plans it is important to explore the nuances of leading and lagging metrics, define Key Performance Indicators (KPIs), Key Behavioral Indicators (KBIs), and Key Risk Indicators (KRIs), and explains how these concepts intersect with Objectives and Key Results (OKRs).
Leading vs. Lagging Metrics: A Foundation
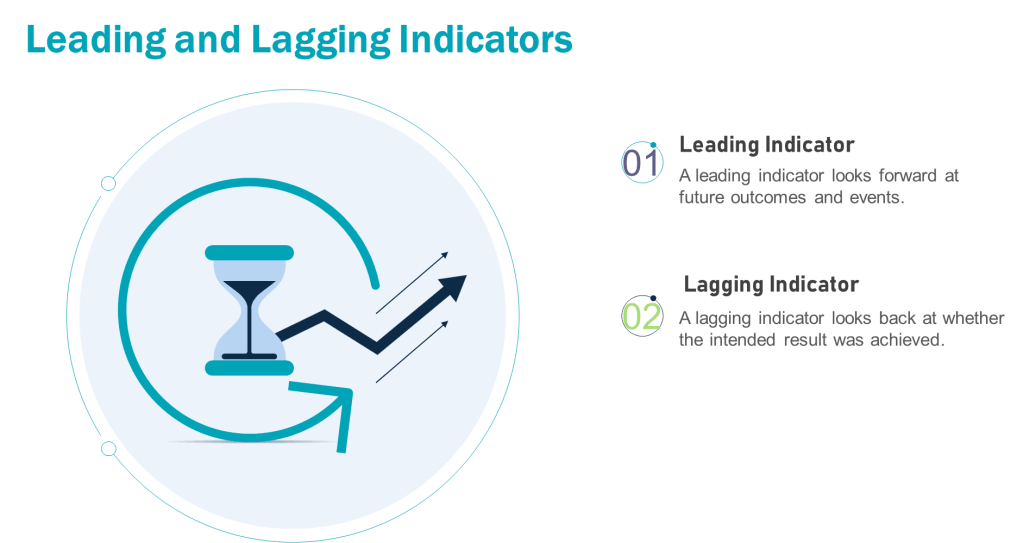
Leading metrics predict future outcomes by measuring activities that drive results. They are proactive, forward-looking, and enable real-time adjustments. For example, tracking employee training completion rates (leading) can predict fewer operational errors.
Lagging metrics reflect historical performance, confirming whether quality objectives were achieved. They are reactive and often tied to outcomes like batch rejection rates or the number of product recalls. For example, in a pharmaceutical quality system, lagging metrics might include the annual number of regulatory observations, the percentage of batches released on time, or the rate of customer complaints related to product quality. These metrics provide a retrospective view of the quality system’s effectiveness, allowing organizations to assess their performance against predetermined quality goals and industry standards. They offer limited opportunities for mid-course corrections
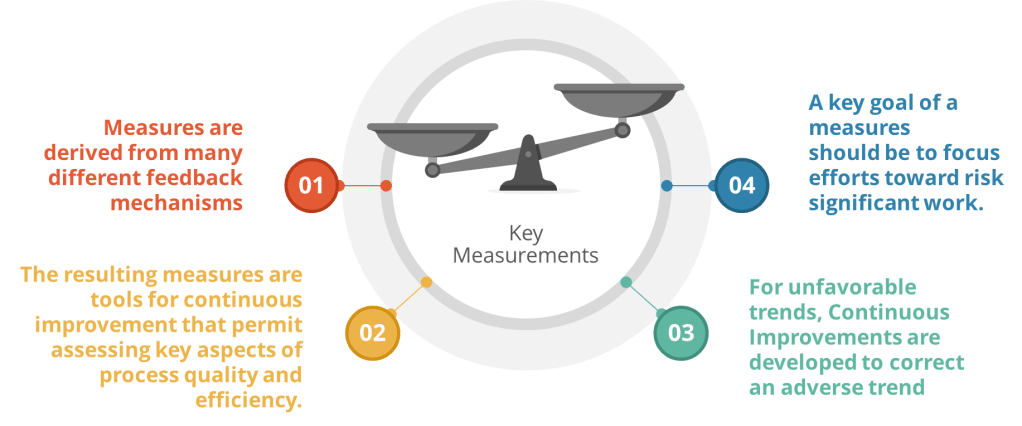
The interplay between leading and lagging metrics ensures organizations balance anticipation of future performance with accountability for past results.
Defining KPIs, KRIs, and KBIs
Key Performance Indicators (KPIs)
KPIs measure progress toward Quality System goals. They are outcome-focused and often tied to strategic objectives.
Leading KPI Example: Process Capability Index (Cpk) – This measures how well a process can produce output within specification limits. A higher Cpk could indicate fewer products requiring disposition.
Lagging KPI Example: Cost of Poor Quality (COPQ) -The total cost associated with products that don’t meet quality standards, including testing and disposition cost.
Key Risk Indicators (KRIs)
KRIs monitor risks that could derail objectives. They act as early warning systems for potential threats. Leading KRIs should trigger risk assessments and/or pre-defined corrections when thresholds are breached.
Leading KRI Example: Unresolved CAPAs (Corrective and Preventive Actions) – Tracks open corrective actions for past deviations. A rising number signals unresolved systemic issues that could lead to recurrence
Lagging KRI Example: Repeat Deviation Frequency – Tracks recurring deviations of the same type. Highlights ineffective CAPAs or systemic weaknesses
Key Behavioral Indicators (KBIs)
KBIs track employee actions and cultural alignment. They link behaviors to Quality System outcomes.
Leading KBI Example: Frequency of safety protocol adherence (predicts fewer workplace accidents).
Lagging KBI Example: Employee turnover rate (reflects past cultural challenges).
Applying Leading and Lagging Metrics to KPIs, KRIs, and KBIs
Each metric type can be mapped to leading or lagging dimensions:
KPIs: Leading KPIs drive action while lagging KPIs validate results
KRIs: Leading KRIs identify emerging risks while lagging KRIs analyze past incidents
KBIs: Leading KBIs encourage desired behaviors while lagging KBIs assess outcomes
Proactively ensures continued process verification aligns with validation master plans
Validation tracking systems
Lagging
Annual audit findings related to validation drift
Confirms adherence to regulator’s “state of control” requirements
Internal/regulatory audit reports
KRI
Leading
Open CAPAs linked to FUSe(P) validation gaps
Identifies unresolved systemic risks affecting process robustness
Quality management systems (QMS)
Lagging
Repeat deviations in validated batches
Reflects failure to address root causes post-validation
Deviation management systems
KBI
Leading
Cross-functional review of process monitoring trends
Encourages proactive behavior to maintain validation state
Meeting minutes, action logs
Lagging
Reduction in human errors during requalification
Validates effectiveness of training/behavioral controls
Training records, deviation reports
This framework operationalizes a focus on data-driven, science-based programs while closing gaps cited in recent Warning Letters.
Goals vs. OKRs: Alignment with Metrics
Goals are broad, aspirational targets (e.g., “Improve product quality”). OKRs (Objectives and Key Results) break goals into actionable, measurable components:
Objective: Reduce manufacturing defects.
Key Results:
Decrease batch rejection rate from 5% to 2% (lagging KPI).
Train 100% of production staff on updated protocols by Q2 (leading KPI).
Reduce repeat deviations by 30% (lagging KRI).
KPIs, KRIs, and KBIs operationalize OKRs by quantifying progress and risks. For instance, a leading KRI like “number of open CAPAs” (Corrective and Preventive Actions) informs whether the OKR to reduce defects is on track.
More Pharmaceutical Quality System Examples
Leading Metrics
KPI: Percentage of staff completing GMP training (predicts adherence to quality standards).
KRI: Number of unresolved deviations in the CAPA system (predicts compliance risks).
KBI: Daily equipment calibration checks (predicts fewer production errors).
Lagging Metrics
KPI: Batch rejection rate due to contamination (confirms quality failures).
KRI: Regulatory audit findings (reflects past non-compliance).
KBI: Employee turnover in quality assurance roles (indicates cultural or procedural issues).
Metric Type
Purpose
Leading Example
Lagging Example
KPI
Measure performance outcomes
Training completion rate
Quarterly profit margin
KRI
Monitor risks
Open CAPAs
Regulatory violations
KBI
Track employee behaviors
Safety protocol adherence frequency
Employee turnover rate
Building Effective Metrics
Align with Strategy: Ensure metrics tie to Quality System goals. For OKRs, select KPIs/KRIs that directly map to key results.
Balance Leading and Lagging: Use leading indicators to drive proactive adjustments and lagging indicators to validate outcomes.
Pharmaceutical Focus: In quality systems, prioritize metrics like right-first-time rate (leading KPI) and repeat deviation rate (lagging KRI) to balance prevention and accountability.
By integrating KPIs, KRIs, and KBIs into OKRs, organizations create a feedback loop that connects daily actions to long-term success while mitigating risks. This approach transforms abstract goals into measurable, actionable pathways—a critical advantage in regulated industries like pharmaceuticals.
Understanding these distinctions empowers teams to not only track performance but also shape it proactively, ensuring alignment with both immediate priorities and strategic vision.
In a previous post, I discussed how overcoming subjectivity in risk management and decision-making requires fostering a culture of quality and excellence. This is an issue that it is important to continue to evaluate and push for additional improvement.
The revised ICH Q9(R1) guideline, finalized in January 2023, introduces critical updates to Quality Risk Management (QRM) practices, emphasizing the need to address subjectivity, enhance formality, improve risk-based decision-making, and manage product availability risks. These revisions aim to ensure that QRM processes are more science-driven, knowledge-based, and effective in safeguarding product quality and patient safety. Two years later it is important to continue to build on key strategies for reducing subjectivity in QRM and aligning with the updated requirements.
Understanding Subjectivity in QRM
Subjectivity in QRM arises from personal opinions, biases, heuristics, or inconsistent interpretations of risks by stakeholders. This can impact every stage of the QRM process—from hazard identification to risk evaluation and mitigation. The revised ICH Q9(R1) explicitly addresses this issue by introducing a new subsection, “Managing and Minimizing Subjectivity,” which emphasizes that while subjectivity cannot be entirely eliminated, it can be controlled through structured approaches.
The guideline highlights that subjectivity often stems from poorly designed scoring systems, differing perceptions of hazards and risks among stakeholders, and cognitive biases. To mitigate these challenges, organizations must adopt robust strategies that prioritize scientific knowledge and data-driven decision-making.
Strategies to Reduce Subjectivity
Leveraging Knowledge Management
ICH Q9(R1) underscores the importance of knowledge management as a tool to reduce uncertainty and subjectivity in risk assessments. Effective knowledge management involves systematically capturing, organizing, and applying internal and external knowledge to inform QRM activities. This includes maintaining centralized repositories for technical data, fostering real-time information sharing across teams, and learning from past experiences through structured lessons-learned processes.
By integrating knowledge management into QRM, organizations can ensure that decisions are based on comprehensive data rather than subjective estimations. For example, using historical data on process performance or supplier reliability can provide objective insights into potential risks.
To integrate knowledge management (KM) more effectively into quality risk management (QRM), organizations can implement several strategies to ensure decisions are based on comprehensive data rather than subjective estimations:
Establish Robust Knowledge Repositories
Create centralized, easily accessible repositories for storing and organizing historical data, lessons learned, and best practices. These repositories should include:
Process performance data
Supplier reliability metrics
Deviation and CAPA records
Audit findings and inspection observations
Technology transfer documentation
By maintaining these repositories, organizations can quickly access relevant historical information when conducting risk assessments.
Implement Knowledge Mapping
Conduct knowledge mapping exercises to identify key sources of knowledge within the organization. This process helps to:
The revised guideline introduces a dedicated section on risk-based decision-making, emphasizing the need for structured approaches that consider the complexity, uncertainty, and importance of decisions. Organizations should establish clear criteria for decision-making processes, define acceptable risk tolerance levels, and use evidence-based methods to evaluate options.
Structured decision-making tools can help standardize how risks are assessed and prioritized. Additionally, calibrating expert opinions through formal elicitation techniques can further reduce variability in judgments.
Addressing Cognitive Biases
Cognitive biases—such as overconfidence or anchoring—can distort risk assessments and lead to inconsistent outcomes. To address this, organizations should provide training on recognizing common biases and their impact on decision-making. Encouraging diverse perspectives within risk assessment teams can also help counteract individual biases.
For example, using cross-functional teams ensures that different viewpoints are considered when evaluating risks, leading to more balanced assessments. Regularly reviewing risk assessment outputs for signs of bias or inconsistencies can further enhance objectivity.
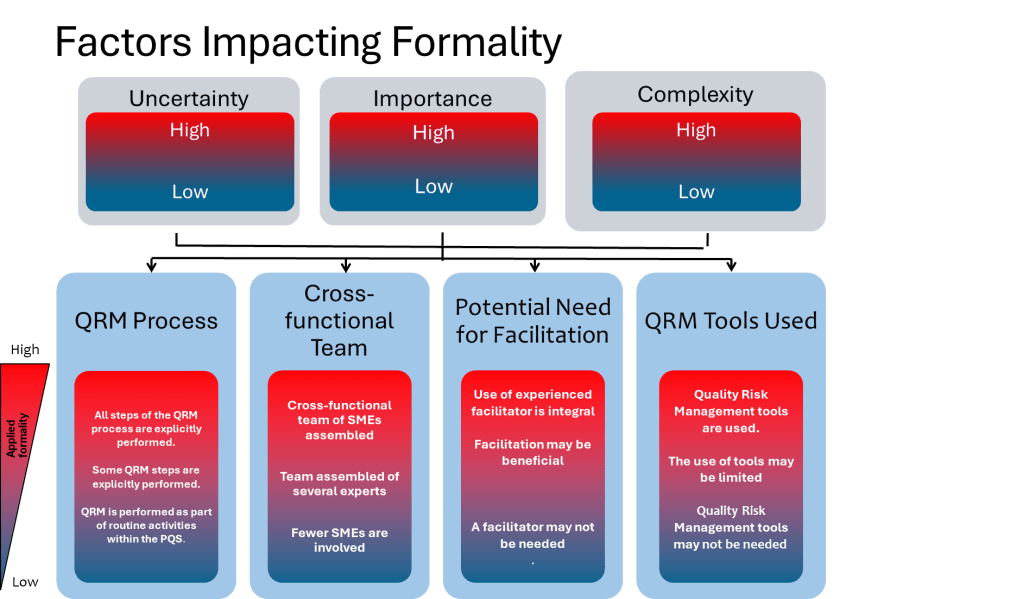
Enhancing Formality in QRM
ICH Q9(R1) introduces the concept of a “formality continuum,” which aligns the level of effort and documentation with the complexity and significance of the risk being managed. This approach allows organizations to allocate resources effectively by applying less formal methods to lower-risk issues while reserving rigorous processes for high-risk scenarios.
For instance, routine quality checks may require minimal documentation compared to a comprehensive risk assessment for introducing new manufacturing technologies. By tailoring formality levels appropriately, organizations can ensure consistency while avoiding unnecessary complexity.
Calibrating Expert Opinions
We need to recognize the importance of expert knowledge in QRM activities, but also acknowledges the potential for subjectivity and bias in expert judgments. We need to ensure we:
Implement formal processes for expert opinion elicitation
Use techniques to calibrate expert judgments, especially when estimating probabilities
Provide training on common cognitive biases and their impact on risk assessment
Employ diverse teams to counteract individual biases
Regularly review risk assessment outputs for signs of bias or inconsistencies
Calibration techniques may include:
Structured elicitation protocols that break down complex judgments into more manageable components
Feedback and training to help experts align their subjective probability estimates with actual frequencies of events
Using multiple experts and aggregating their judgments through methods like Cooke’s classical model
Employing facilitation techniques to mitigate groupthink and encourage independent thinking
By calibrating expert opinions, organizations can leverage valuable expertise while minimizing subjectivity in risk assessments.
Utilizing Cooke’s Classical Model
Cooke’s Classical Model is a rigorous method for evaluating and combining expert judgments to quantify uncertainty. Here are the key steps for using the Classical Model to evaluate expert judgment:
Select and calibrate experts:
Choose 5-10 experts in the relevant field
Have experts assess uncertain quantities (“calibration questions”) for which true values are known or will be known soon
These calibration questions should be from the experts’ domain of expertise
Elicit expert assessments:
Have experts provide probabilistic assessments (usually 5%, 50%, and 95% quantiles) for both calibration questions and questions of interest
Document experts’ reasoning and rationales
Score expert performance:
Evaluate experts on two measures: a) Statistical accuracy: How well their probabilistic assessments match the true values of calibration questions b) Informativeness: How precise and focused their uncertainty ranges are
Calculate performance-based weights:
Derive weights for each expert based on their statistical accuracy and informativeness scores
Experts performing poorly on calibration questions receive little or no weight
Combine expert assessments:
Use the performance-based weights to aggregate experts’ judgments on the questions of interest
This creates a “Decision Maker” combining the experts’ assessments
Validate the combined assessment:
Evaluate the performance of the weighted combination (“Decision Maker”) using the same scoring as for individual experts
Compare to equal-weight combination and best-performing individual experts
Conduct robustness checks:
Perform cross-validation by using subsets of calibration questions to form weights
Assess how well performance on calibration questions predicts performance on questions of interest
The Classical Model aims to create an optimal aggregate assessment that outperforms both equal-weight combinations and individual experts. By using objective performance measures from calibration questions, it provides a scientifically defensible method for evaluating and synthesizing expert judgment under uncertainty.
Using Data to Support Decisions
ICH Q9(R1) emphasizes the importance of basing risk management decisions on scientific knowledge and data. The guideline encourages organizations to:
Develop robust knowledge management systems to capture and maintain product and process knowledge
Create standardized repositories for technical data and information
Implement systems to collect and convert data into usable knowledge
Gather and analyze relevant data to support risk-based decisions
Use quantitative methods where feasible, such as statistical models or predictive analytics
Specific approaches for using data in QRM may include:
Analyzing historical data on process performance, deviations, and quality issues to inform risk assessments
Employing statistical process control and process capability analysis to evaluate and monitor risks
Utilizing data mining and machine learning techniques to identify patterns and potential risks in large datasets
Implementing real-time data monitoring systems to enable proactive risk management
Conducting formal data quality assessments to ensure decisions are based on reliable information
Digitalization and emerging technologies can support data-driven decision making, but remember that validation requirements for these technologies should not be overlooked.
Improving Risk Assessment Tools
The design of risk assessment tools plays a critical role in minimizing subjectivity. Tools with well-defined scoring criteria and clear guidance on interpreting results can reduce variability in how risks are evaluated. For example, using quantitative methods where feasible—such as statistical models or predictive analytics—can provide more objective insights compared to qualitative scoring systems.
Organizations should also validate their tools periodically to ensure they remain fit-for-purpose and aligned with current regulatory expectations.
Leverage Good Risk Questions
A well-formulated risk question can significantly help reduce subjectivity in quality risk management (QRM) activities. Here’s how a good risk question contributes to reducing subjectivity:
Clarity and Focus
A good risk question provides clarity and focus for the risk assessment process. By clearly defining the scope and context of the risk being evaluated, it helps align all participants on what specifically needs to be assessed. This alignment reduces the potential for individual interpretations and subjective assumptions about the risk scenario.
Specific and Measurable Terms
Effective risk questions use specific and measurable terms rather than vague or ambiguous language. For example, instead of asking “What are the risks to product quality?”, a better question might be “What are the potential causes of out-of-specification dissolution results for Product X in the next 6 months?”. The specificity in the latter question helps anchor the assessment in objective, measurable criteria.
Factual Basis
A well-crafted risk question encourages the use of factual information and data rather than opinions or guesses. It should prompt the risk assessment team to seek out relevant data, historical information, and scientific knowledge to inform their evaluation. This focus on facts and evidence helps minimize the influence of personal biases and subjective judgments.
Standardized Approach
Using a consistent format for risk questions across different assessments promotes a standardized approach to risk identification and analysis. This consistency reduces variability in how risks are framed and evaluated, thereby decreasing the potential for subjective interpretations.
Objective Criteria
Good risk questions often incorporate or imply objective criteria for risk evaluation. For instance, a question like “What factors could lead to a deviation from the acceptable range of 5-10% for impurity Y?” sets clear, objective parameters for the assessment, reducing the room for subjective interpretation of what constitutes a significant risk.
Promotes Structured Thinking
Well-formulated risk questions encourage structured thinking about potential hazards, their causes, and consequences. This structured approach helps assessors focus on objective factors and causal relationships rather than relying on gut feelings or personal opinions.
Facilitates Knowledge Utilization
A good risk question should prompt the assessment team to utilize available knowledge effectively. It encourages the team to draw upon relevant data, past experiences, and scientific understanding, thereby grounding the assessment in objective information rather than subjective impressions.
By crafting risk questions that embody these characteristics, QRM practitioners can significantly reduce the subjectivity in risk assessments, leading to more reliable, consistent, and scientifically sound risk management decisions.
Fostering a Culture of Continuous Improvement
Reducing subjectivity in QRM is an ongoing process that requires a commitment to continuous improvement. Organizations should regularly review their QRM practices to identify areas for enhancement and incorporate feedback from stakeholders. Investing in training programs that build competencies in risk assessment methodologies and decision-making frameworks is essential for sustaining progress.
Moreover, fostering a culture that values transparency, collaboration, and accountability can empower teams to address subjectivity proactively. Encouraging open discussions about uncertainties or disagreements during risk assessments can lead to more robust outcomes.
Conclusion
The revisions introduced in ICH Q9(R1) represent a significant step forward in addressing long-standing challenges associated with subjectivity in QRM. By leveraging knowledge management, implementing structured decision-making processes, addressing cognitive biases, enhancing formality levels appropriately, and improving risk assessment tools, organizations can align their practices with the updated guidelines while ensuring more reliable and science-based outcomes.
It has been two years, it is long past time be be addressing these in your risk management process and quality system.
Ultimately, reducing subjectivity not only strengthens compliance with regulatory expectations but also enhances the quality of pharmaceutical products and safeguards patient safety—a goal that lies at the heart of effective Quality Risk Management.
One of the many fascinating items in the recent Warning Letter to Sanofi is the FDA’s direction to provide a plan to perform “timely technological upgrades to the equipment/facility infrastructure.” This point drives home the point that staying current with technological advancements is crucial for maintaining compliance, improving efficiency, and ensuring product quality. Yet, I think it is fair to say we rarely see it this bluntly put as a requirement.
One of the many reasons this Warning Letter stands out is that this is (as far as I can tell) the same facility that won the ISPE’s Facility of the Year award in 2020. This means it is still a pretty new facility, and since it is one of the templates that many single-use biotech manufacturing facilities are based on, we had best pay attention. If a failure to maintain a state-of-the-art facility can contribute to this sort of Warning Letter, then many companies had best be paying close attention. There is a lot to unpack and learn here.
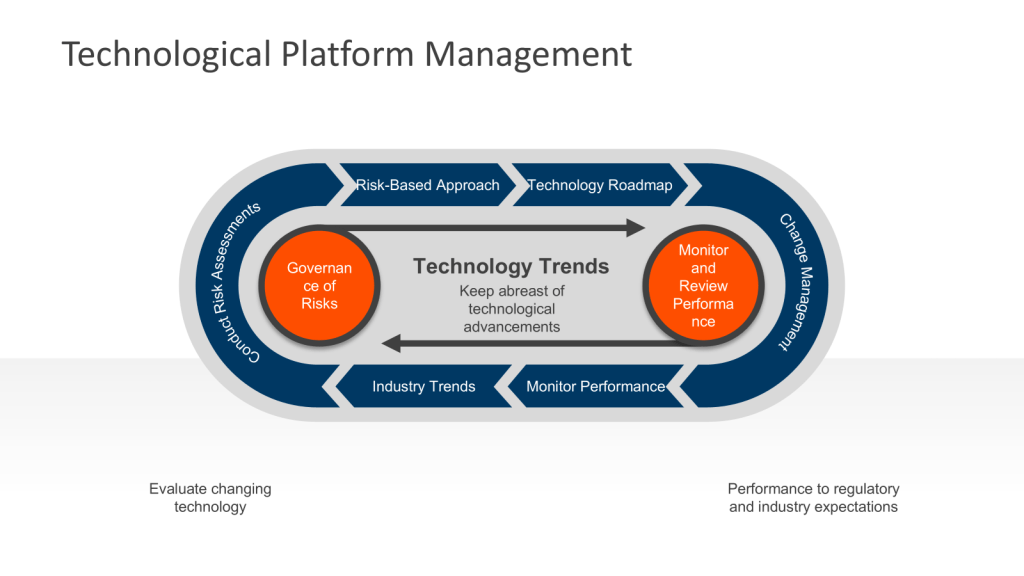
Establishing an Ongoing Technology Platform Process
To meet regulatory requirements and industry standards, facilities should implement a systematic approach to technological upgrades.
1. Conduct Regular Assessments
At least annually, perform comprehensive evaluations of your facility’s equipment, systems, and processes. This assessment should include:
Prioritize upgrades based on their potential impact on product quality, patient safety, and regulatory compliance. Utilize living risk assessments to get a sense of where issues are developing. These should be the evolution of the risk management that built the facility.
4. Create a Technology Roadmap
Develop a long-term plan for implementing upgrades, considering:
Budget constraints and return on investment
Regulatory timelines for submissions and approvals
Production schedules and potential downtime
Integration with existing systems and processes
5. Implement Change Management Procedures
Ensure there is a robust change management process in place to ensure that upgrades are implemented safely and effectively. This should include:
Detailed documentation of proposed changes
Impact assessments on product quality and regulatory compliance
6. Appropriate Verification – Commissioning, Qualification and Validation
Conduct thorough verification activities to demonstrate that the upgraded equipment or systems meet predetermined specifications and regulatory requirements.
7. Monitor and Review Performance
Continuously monitor the performance of upgraded systems and equipment to ensure they meet expectations and comply with cGMP requirements. Conduct periodic reviews to identify any necessary adjustments or further improvements. This is all part of Stage 3 of the FDA’s process validation model focusing on ongoing assurance that the process remains in a state of control during routine commercial manufacture. This stage is designed to:
Anticipate and prevent issues before they occur
Detect unplanned deviations from the process
Identify and correct problems
Leveraging Advanced Technologies
To stay ahead of regulatory expectations and industry trends, consider incorporating advanced technologies into your upgrade plans:
Single-Use Systems (SUS): Implement disposable components to reduce cleaning and validation requirements while improving flexibility.
Modern Microbial Methods (MMM): Implement advanced techniques used in microbiology that offer significant advantages over traditional culture-based methods
Process Analytical Technology (PAT): Integrate real-time monitoring and control systems to enhance product quality and process understanding.
Data Analytics and Artificial Intelligence: Implement advanced data analysis tools to identify trends, predict maintenance needs, and optimize processes.
Conclusion
Maintaining a state-of-the-art biotech facility requires a proactive and systematic approach to technological upgrades. By establishing an ongoing process for identifying and implementing improvements, facilities can ensure compliance with FDA requirements, align with industry standards, and stay competitive in the rapidly evolving biotech landscape.
Remember that the goal is not just to meet current regulatory expectations but to anticipate future requirements and position your facility at the forefront of biotech manufacturing excellence. By following this comprehensive approach and staying informed on industry developments, you can create a robust, flexible, and compliant manufacturing environment that supports the production of high-quality biopharmaceutical products.
In the ever-evolving landscape of pharmaceutical manufacturing, quality management has become a cornerstone of success. Two key frameworks guiding this pursuit of excellence are the ICH Q10 Pharmaceutical Quality System and the FDA’s Quality Management Maturity (QMM) program. At the heart of these initiatives lies the quality plan – a crucial document that outlines an organization’s approach to ensuring consistent product quality and continuous improvement.
What is a Quality Plan?
A quality plan serves as a roadmap for achieving quality objectives and ensuring that all stakeholders are aligned in their pursuit of excellence.
Key components of a quality plan typically include:
Organizational objectives to drive quality
Steps involved in the processes
Allocation of resources, responsibilities, and authority
Specific documented standards, procedures, and instructions
Testing, inspection, and audit programs
Methods for measuring achievement of quality objectives
Aligning with ICH Q10 Management Responsibilities
ICH Q10 provides a model for an effective pharmaceutical quality system that goes beyond the basic requirements of Good Manufacturing Practice (GMP). To meet ICH Q10 management responsibilities, a quality plan should address the following areas:
1. Management Commitment
The quality plan should clearly articulate top management’s commitment to quality. This includes allocating necessary resources, participating in quality system oversight, and fostering a culture of quality throughout the organization.
2. Quality Policy and Objectives
Align your quality plan with your organization’s overall quality policy. Define specific, measurable quality objectives that support the broader goals of quality realization, establishing and maintaining a state of control, and facilitating continual improvement.
3. Planning
Outline the strategic approach to quality management, including how quality considerations are integrated into product lifecycle stages from development through to discontinuation.
4. Resource Management
Detail how resources (human, financial, and infrastructural) will be allocated to support quality initiatives. This includes provisions for training and competency development of personnel.
5. Management Review
Establish a process for regular management review of the quality system’s performance. This should include assessing the need for changes to the quality policy, objectives, and other elements of the quality system.
Aligning with FDA’s Quality Management Maturity Model
The FDA’s QMM program aims to encourage pharmaceutical manufacturers to go beyond basic compliance and foster a culture of quality and continuous improvement. To align your quality plan with QMM principles, consider incorporating the following elements:
1. Quality Culture
Describe how your organization will foster a strong quality culture mindset. This includes promoting open communication, encouraging employee engagement in quality initiatives, and recognizing quality-focused behaviors.
2. Continuous Improvement
Detail processes for identifying areas where quality management practices can be enhanced. This might include regular assessments, benchmarking against industry best practices, and implementing improvement projects.
3. Risk Management
Outline a proactive approach to risk management that goes beyond basic compliance. This should include processes for identifying, assessing, and mitigating risks to product quality and supply chain reliability.
Define key performance indicators (KPIs) that will be used to measure and monitor quality performance. These metrics should align with the FDA’s focus on product quality, patient safety, and supply chain reliability.
Describe systems and processes for capturing, sharing, and utilizing knowledge gained throughout the product lifecycle. This supports informed decision-making and continuous improvement.
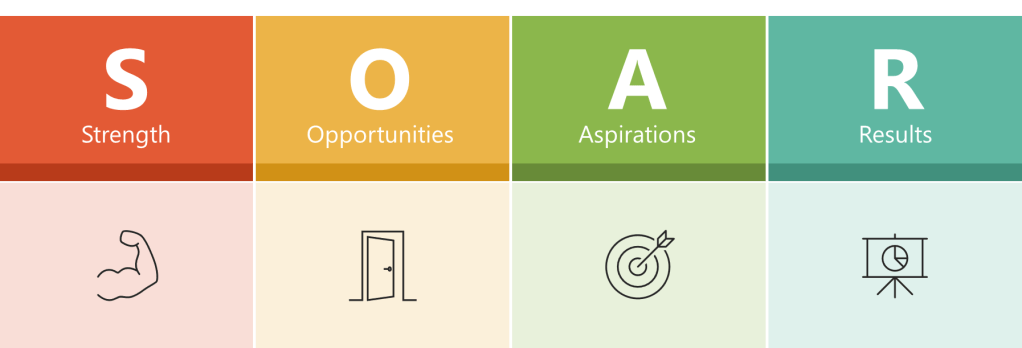
The SOAR Analysis
A SOAR Analysis is a strategic planning framework that focuses on an organization’s positive aspects and future potential. The acronym SOAR stands for Strengths, Opportunities, Aspirations, and Results.
Key Components
Strengths: This quadrant identifies what the organization excels at, its assets, capabilities, and greatest accomplishments.
Opportunities: This section explores external circumstances, potential for growth, and how challenges can be reframed as opportunities.
Aspirations: This part focuses on the organization’s vision for the future, dreams, and what it aspires to achieve.
Results: This quadrant outlines the measurable outcomes that will indicate success in achieving the organization’s aspirations.
Characteristics and Benefits
Positive Focus: Unlike SWOT analysis, SOAR emphasizes strengths and opportunities rather than weaknesses and threats.
Collaborative Approach: It engages stakeholders at all levels of the organization, promoting a shared vision.
Action-Oriented: SOAR is designed to guide constructive conversations and lead to actionable strategies.
Future-Focused: While addressing current strengths and opportunities, SOAR also projects a vision for the future.
Application
SOAR analysis is typically conducted through team brainstorming sessions and visualized using a 2×2 matrix. It can be applied to various contexts, including business strategy, personal development, and organizational change.
By leveraging existing strengths and opportunities to pursue shared aspirations and measurable results, SOAR analysis provides a framework for positive organizational growth and strategic planning.
The SOAR Analysis for Quality Plan Writing
Utilizing a SOAR (Strengths, Opportunities, Aspirations, Results) analysis can be an effective approach to drive the writing of a quality plan. This strategic planning tool focuses on positive aspects and future potential, making it particularly useful for developing a forward-looking quality plan. Here’s how you can leverage SOAR analysis in this process:
Conducting the SOAR Analysis
Strengths
Begin by identifying your organization’s current strengths related to quality. Consider:
Areas where your organization excels in quality management
Significant quality-related accomplishments
Unique quality offerings that set you apart from competitors
Ask questions like:
What are our greatest quality-related assets and capabilities?
Where do we consistently meet or exceed quality standards?
Opportunities
Next, explore external opportunities that could enhance your quality initiatives. Look for:
Emerging technologies that could improve quality processes
Market trends that emphasize quality
Potential partnerships or collaborations to boost quality efforts
Consider:
How can we leverage external circumstances to improve our quality?
What new skills or resources could elevate our quality standards?
Aspirations
Envision your preferred future state for quality in your organization. This step involves:
Defining what you want to be known for in terms of quality
Aligning quality goals with overall organizational vision
Ask:
What is our ideal quality scenario?
How can we integrate quality excellence into our long-term strategy?
Results
Finally, determine measurable outcomes that will indicate success in your quality initiatives. This includes:
Specific, quantifiable quality metrics
Key performance indicators (KPIs) for quality improvement
Key behavior indicators (KBIs) and Key risk indicators (KRIs)
Consider:
How will we measure progress towards our quality goals?
What tangible results will demonstrate our quality aspirations have been achieved?
Writing the Quality Plan
With the SOAR analysis complete, use the insights gained to craft your quality plan:
Executive Summary: Provide an overview of your quality vision, highlighting key strengths and opportunities identified in the SOAR analysis.
Quality Objectives: Translate your aspirations into concrete, measurable objectives. Ensure these align with the strengths and opportunities identified.
Strategic Initiatives: Develop action plans that leverage your strengths to capitalize on opportunities and achieve your quality aspirations. For each initiative, specify:
Resources required
Timeline for implementation
Responsible parties
Performance Metrics: Establish a system for tracking the results identified in your SOAR analysis. Include both leading and lagging indicators of quality performance.
Continuous Improvement: Outline processes for regular review and refinement of the quality plan, incorporating feedback and new insights as they emerge.
Resource Allocation: Based on the strengths and opportunities identified, detail how resources will be allocated to support quality initiatives.
Training and Development: Address any skill gaps identified during the SOAR analysis, outlining plans for employee training and development in quality-related areas.
Risk Management: While SOAR focuses on positives, acknowledge potential challenges and outline strategies to mitigate risks to quality objectives.
By utilizing the SOAR analysis framework, your quality plan will be grounded in your organization’s strengths, aligned with external opportunities, inspired by aspirational goals, and focused on measurable results. This approach ensures a positive, forward-looking quality strategy that engages stakeholders and drives continuous improvement.
A well-crafted quality plan serves as a bridge between regulatory requirements, industry best practices, and an organization’s specific quality goals. By aligning your quality plan with ICH Q10 management responsibilities and the FDA’s Quality Management Maturity model, you create a robust framework for ensuring product quality, fostering continuous improvement, and building a resilient, quality-focused organization.
“there is no retrospective review of batch records for batches within expiry, to identify any other process deviations performed without the appropriate corresponding documentation including risk assessment(s).” – 2025 Warning Letter from the US FDA to Sanofi
This comment is about an instance where Sanofi deviated from the validated process by using an unvalidated single use component. Instead of self-identifying, creating a deviation and doing the right change control activities, the company just kept on deviating by using a non-controlled document.
This is a big problem for lots of reasons, from uncontrolled documents, to not using the change control system, to breaking the validated state. What the language quoted above really brings to bear is the question, when should we evaluate our records for other similar instances of this happening, so we can address it.
When a deviation investigation reveals recurring bad decision-making, it is crucial to expand the investigation and conduct a retrospective review of batch records. A good cutoff of this can be only for batches within expiry. This expanded investigation helps identify any other process deviations that may have occurred but were not discovered or documented at the time. Here’s when and how to approach this situation:
Triggers for Expanding the Investigation
Recurring Deviations: If the same or similar deviations are found to be recurring, it indicates a systemic issue that requires a broader investigation.
Pattern of Human Errors: When a pattern of human errors or poor decision-making is identified, it suggests potential underlying issues in training, procedures, or processes.
Critical Deviations: For deviations classified as critical, a more thorough investigation is typically warranted, including a retrospective review.
Potential Impact on Product Quality: If there’s a strong possibility that undiscovered deviations could affect product quality or patient safety, an expanded investigation becomes necessary.
Conducting the Retrospective Review
Timeframe: Review batch records for all batches within expiry, typically covering at least two years of production. Similarily for issues in the FUSE program you might look since the last requalification, or from a decide to go backwards in concentric circles based on what you find.
Scope: Examine not only the specific process where the deviation was found but also related processes or areas that could be affected. Reviewing related processes is critical.
Data Analysis: Utilize statistical tools and trending analysis techniques to identify patterns or anomalies in the historical data.
Cross-Functional Approach: Involve a team of subject matter experts from relevant departments to ensure a comprehensive review.
Documentation Review: Examine batch production records, laboratory control records, equipment logs, and any other relevant documentation.
Root Cause Analysis: Apply root cause analysis techniques to understand the underlying reasons for the recurring issues.
Key Considerations
Risk Assessment: Prioritize the review based on the potential risk to product quality and patient safety.
Data Integrity: Ensure that any retrospective data used is reliable and has maintained its integrity.
Corrective Actions: Develop and implement corrective and preventive actions (CAPAs) based on the findings of the expanded investigation.
Regulatory Reporting: Assess the need for notifying regulatory authorities based on the severity and impact of the findings.
By conducting a thorough retrospective review when recurring bad decision-making is identified, companies can uncover hidden issues, improve their quality systems, and prevent future deviations. This proactive approach not only enhances compliance but also contributes to continuous improvement in pharmaceutical manufacturing processes.
In the case of an issue that rises to a regulatory observation this becomes a firm must. The agency has raised a significant concern and they will want proof that this is a limited issue or that you are holistically dealing with it across the organization.
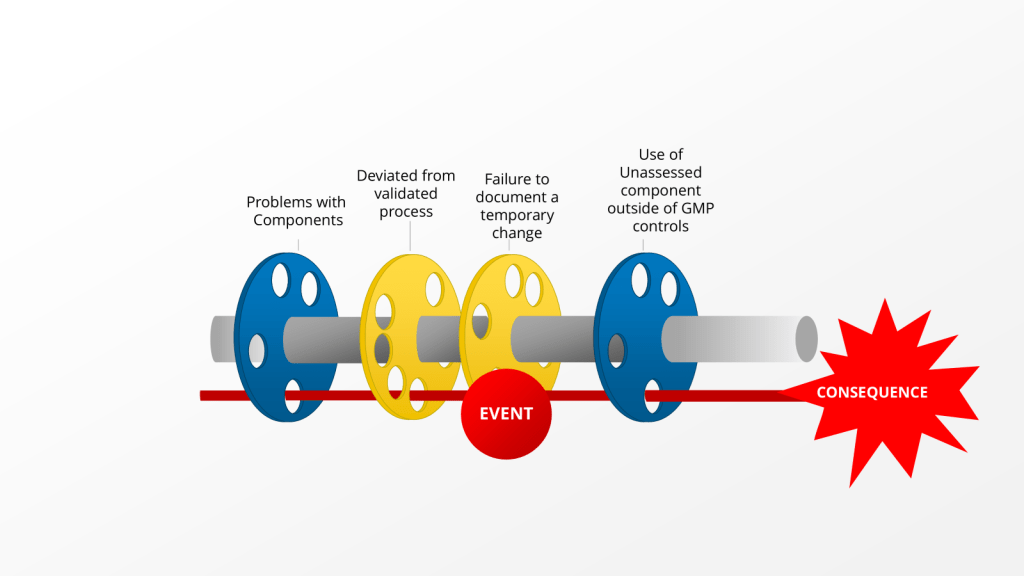
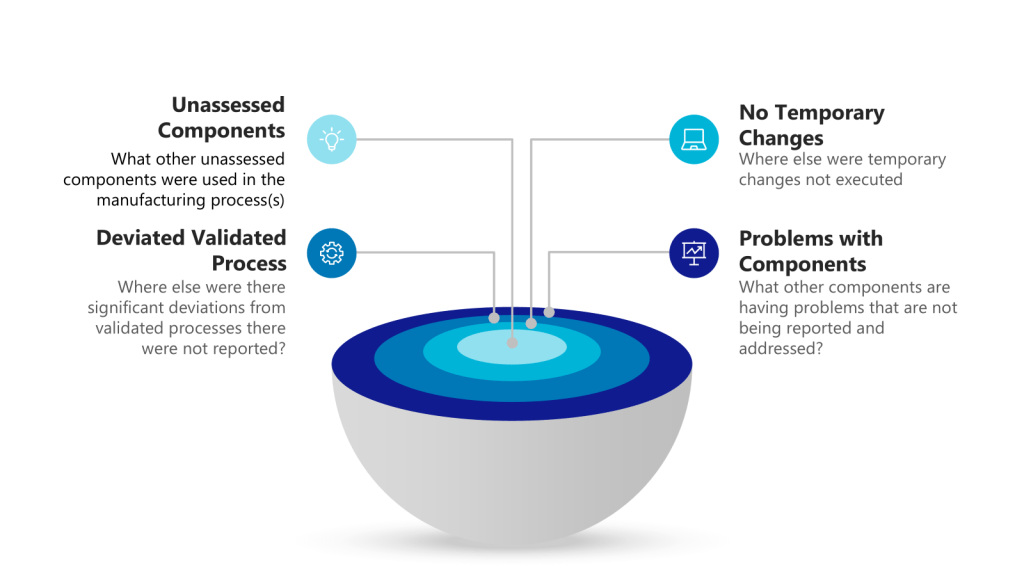
Concentric Circles of Investigation
Each layer of the investigation may require holistic looks. Utilizing the example above we have:
Layer of Problem
Further Investigationto Answer
Use of unassessed component outside of GMP controls
What other unassessed components were used in the manufacturing process(s)