Best Practices for Cross-Contamination Risk Assessment at Multi-Product Biologic Drug Substance Manufacturers

A multi-product facility does not become safe because every room is classified, every hose is labeled, and every changeover has a completed checklist. It becomes safe when the organization can make, and defend, a scientifically coherent claim that material from Product A cannot reach a patient receiving Product B at a level capable of causing harm.

That claim is harder to sustain in a contract development and manufacturing organization than in a conventional single-product facility. A CDMO must accommodate changing client portfolios, incomplete early-phase knowledge, different cell substrates and processes, short campaigns, accelerated technology transfers, and commercial pressure to use the same suites efficiently. Each new product changes the contamination problem. Each new process train changes the pathways. Each new piece of toxicological or clinical information may change what “acceptable” means.

The central task is therefore not simply cleaning validation. It is cross-contamination risk management across the product, process, facility, equipment, and patient-safety lifecycles.

For a multi-product CDMO, that system must distinguish clearly between two manufacturing architectures:

  • Reusable equipment, where previous-product carryover is controlled principally through equipment design, validated cleaning, sampling, analytical capability, maintenance, and changeover discipline.
  • Single-use systems (SUS), where direct carryover through the discarded product-contact path may be greatly reduced, but risk shifts toward assembly integrity, incorrect connections, retained reusable interfaces, extractables and leachables, particulates, supplier controls, sterilization assurance, and human manipulation.

Neither architecture is inherently safe. Both can be made safe. Both can fail in characteristic ways.

The Regulatory Question

The regulatory question is not, “Was the equipment cleaned?” It is, “Was the risk of cross-contamination identified, scientifically evaluated, controlled, and kept under review?”

ICH Q9(R1) defines quality risk management as a systematic process for assessing, controlling, communicating, and reviewing risks to product quality across the lifecycle. It also makes two points that matter directly to a CDMO: risk evaluation should be grounded in scientific knowledge and linked ultimately to patient protection, and the level of effort, formality, and documentation should be commensurate with risk. Resource limitations are not a valid reason to lower the formality of the assessment.

EU GMP Chapter 5 is more explicit about shared manufacture. It requires cross-contamination risk to be assessed, including contamination arising from product residues, aerosols, organisms, genetic material, and operators’ clothing. It further requires a quality risk management process that includes potency and toxicological evaluation and considers facility and equipment design, personnel and material flows, microbiological controls, physicochemical characteristics, cleaning processes, analytical capability, and the intended use of the product.

The EMA health-based exposure limit guideline replaces arbitrary carryover conventions with a structured scientific evaluation of pharmacological and toxicological data. A permitted daily exposure, or equivalent health-based exposure limit, represents a substance-specific daily exposure that is unlikely to cause an adverse effect over a lifetime; its derivation includes hazard identification, selection of the critical effect and point of departure, and application of adjustment factors for uncertainty.

FDA requirements approach the problem through enforceable expectations for buildings, flow, defined areas, equipment, procedures, and controls that prevent contamination and mix-ups. Under 21 CFR 211.42, material and product flow must be designed to prevent contamination, and operations must occur in defined areas or under other adequate control systems. FDA’s inspection program for protein drug substances also expects validated cleaning of nondisposable product-contact equipment, predetermined carryover limits for shared equipment, continued verification, and toxicologically derived acceptable daily exposures for highly potent or toxic residues; where limits cannot be achieved, dedicated or disposable equipment may be necessary.

For CDMOs, regulatory responsibility cannot be outsourced through the commercial contract. FDA’s quality-agreement guidance expects the owner and contract facility to define and document their respective CGMP responsibilities, but the agreement is a governance mechanism and not a transfer of accountability away from either party.

Begin With the Patient

The most common weakness in shared-facility risk assessments is that they begin with the room or equipment rather than the patient. The team draws process maps, scores hose connections, reviews cleaning cycles, and concludes that controls are strong. Only later, sometimes after the manufacturing decision has already been made, does anyone ask how much of the previous product could safely reach the next patient.

That sequence is backward.

The assessment should begin with a human product-safety evaluation for each molecule proposed for the facility. In EU terminology this is generally expressed through an HBEL, commonly a PDE or ADE. The evaluation is not merely a calculation and should not be reduced to a spreadsheet populated from the lowest clinical dose. It is an expert interpretation of all relevant pharmacological, toxicological, nonclinical, and clinical evidence.

EMA states that HBELs should be established for medicinal products and periodically reassessed as knowledge develops. It also specifies that the person deriving the HBEL should have adequate expertise and experience in toxicology or pharmacology, familiarity with pharmaceuticals, and experience establishing health-based limits. When the work is outsourced, the manufacturer must qualify the provider and the specific expert; simply purchasing an HBEL report without assessing the contractor’s suitability is not acceptable.

A defensible assessment should address, as applicable:

  • Molecular target and mechanism of action.
  • Intended and reasonably foreseeable off-target pharmacology.
  • Potency and dose-response relationships.
  • Route of administration and systemic bioavailability.
  • Patient population, including vulnerable or immunocompromised groups.
  • Acute, repeated-dose, reproductive, developmental, genotoxic, carcinogenic, immunotoxic, and local-tolerance information, where relevant.
  • Cytokine-release, immune agonism, immune suppression, complement activation, or unintended tissue cross-reactivity.
  • Clinical adverse-event data and the lowest exposure associated with the critical effect.
  • Pharmacokinetics, persistence, accumulation, and half-life.
  • Uncertainty arising from limited data, especially for early clinical programs.
  • The biological activity of fragments, aggregates, conjugated species, degradants, or process-transformed residues.
  • Whether route-to-route extrapolation is scientifically justified.

For biologics, the assessment may require judgment different from that used for a conventional small molecule. A protein may denature during alkaline cleaning, but “denatured” is not automatically synonymous with “non-hazardous.” Loss of the primary mechanism of action does not by itself establish the absence of immunogenic, inflammatory, allergenic, or other biological effects. Conversely, a large protein’s poor oral bioavailability may materially reduce risk for an orally administered next product, while offering little reassurance when the next product is parenteral. The conclusion must follow the exposure scenario and evidence, not a generic statement that proteins are readily degraded.

The resulting HBEL is an input to risk management, not the risk assessment’s conclusion. EMA explicitly states that once the health-based assessment is complete, the data should be used through QRM to determine whether existing technical and organizational controls are adequate or require supplementation.

The CDMO Information Problem

A sponsor often knows more about its molecule than the CDMO. The CDMO knows more about its facility, equipment, cleaning history, operators, and failure modes. A valid assessment requires both bodies of knowledge.

The sponsor should provide either a complete, reviewable HBEL assessment or the data needed for the CDMO to perform one. EMA expects the assessment, data references, and relevant expert information to be available during inspection. The quality agreement should therefore define ownership and timing for:

  • Provision and approval of the HBEL or toxicological monograph.
  • Disclosure of new clinical, nonclinical, or pharmacovigilance information.
  • Assessment of novel modalities, conjugates, linkers, payloads, or unusually potent mechanisms.
  • Product and process characterization relevant to cleanability and detectability.
  • Analytical reference standards and product-specific assays.
  • Review of cleaning limits and product-family placement.
  • Approval of shared-use, campaign, dedication, or exclusion decisions.
  • Notification when new information could invalidate the existing assessment.

This exchange must occur before facility fit is approved and not after the batch slot has been commercially committed. A CDMO that accepts a product before it understands the patient-safety boundary has allowed scheduling to precede science.

Hazard Is Not Risk

Cross-contamination discussions often collapse hazard and risk into one concept. They are not the same.

Hazard is the inherent capacity of the contaminant to cause harm. For a biologic drug substance, that may arise from potent pharmacology, immune modulation, sensitization, tissue cross-reactivity, or biologically active variants. Risk depends on both that hazard and the probability and extent of patient exposure through a credible contamination pathway.

This distinction matters because two products with similar HBELs may require different controls. A readily soluble biolgic processed in a closed, disposable flow path presents a different exposure likelihood from a sticky, difficult-to-detect protein processed through open transfers and a complex reusable skid. Likewise, the same previous product may present different risks depending on the next product’s route, maximum daily dose, batch size, population, and shared surface area.

The risk question should therefore be written explicitly:

Given the hazard of the previous product, the vulnerability and exposure of the next product’s patient population, the manufacturing sequence, and all credible transfer routes, are the proposed controls capable of maintaining carryover below a scientifically justified safe level with an adequate operating margin, even when foreseeable failures occur?

That final clause is important. A risk assessment that assumes every procedure is followed perfectly is not assessing risk. It is describing the intended state.

Map Every Transfer Route

The assessment should follow contamination as though it were tracing dye through the facility. Product residue does not recognize departmental boundaries, validation packages, or ownership charts.

At minimum, evaluate these pathways:

  • Direct product-contact carryover through shared tanks, columns, skids, piping, valves, pumps, sensors, transfer panels, and filling paths.
  • Indirect transfer from external equipment surfaces, carts, tools, hoses, parts, balances, bins, and mobile equipment.
  • Airborne transfer through aerosols, droplets, powders, open manipulations, pressure cascades, or HVAC recirculation.
  • Personnel transfer through gloves, gowns, footwear, tools, notebooks, radios, and movement between suites.
  • Material and waste transfer through staging areas, elevators, corridors, pass-throughs, cold rooms, and wash areas.
  • Mix-up through labels, status identification, electronic recipes, tubing connections, sampling materials, and component reconciliation.
  • Microbial or adventitious-agent transfer through shared utilities, insufficient segregation, retained moisture, open operations, or pre-viral and post-viral process crossover.
  • Laboratory transfer through shared sample-preparation areas, instruments, standards, retain storage, or incorrect sample identity.
  • Maintenance transfer through tools, removed components, lubricants, temporary hoses, bypasses, and post-maintenance restoration.

WHO guidance for biological products emphasizes QRM-based movement restrictions, logical and unidirectional flows, closed systems, qualified single-use components, and controls for open manipulations. It also warns against cross-use of certain reused components and highlights separation between activities with different biological risks.

The result should be a facility-wide contamination pathway map connected to process steps and equipment boundaries. A list of hazards without a spatial and temporal model of transfer is incomplete.

Select the Right Tool

No single risk tool is sufficient for the whole problem.

ToolBest useLimitation
Process and contamination-pathway mappingShows where product, people, materials, waste, air, and equipment intersectDoes not quantify control strength by itself
FMEA or FMECAEvaluates equipment- and step-specific failure modesRisk-priority numbers can hide severe events and create false precision
HACCPIdentifies critical points where control is essentialCan become too linear for complex facility-wide transfer pathways
LOPATests whether independent protection layers adequately reduce a defined scenarioRequires genuine independence and defensible failure assumptions
Fault-tree analysisWorks backward from a contamination outcome to combinations of causesCan become resource-intensive and difficult to maintain
Bow-tie analysisConnects threats, preventive controls, event, mitigations, and consequencesMay oversimplify technical detail unless supported by deeper assessments

ICH Q9(R1) permits different tools and degrees of formality but expects the approach to reflect uncertainty, importance, and complexity. In a multi-client CDMO, the most effective architecture is usually layered: pathway mapping at the facility level, FMEA for equipment and operations, and LOPA or bow-tie analysis for high-consequence scenarios.

Detectability should be used cautiously. A highly sensitive release test does not prevent cross-contamination, and routine product testing rarely provides enough sampling coverage to compensate for weak containment or cleaning. Detection controls can reduce uncertainty, but they should not be allowed to dominate the score merely because a method exists.
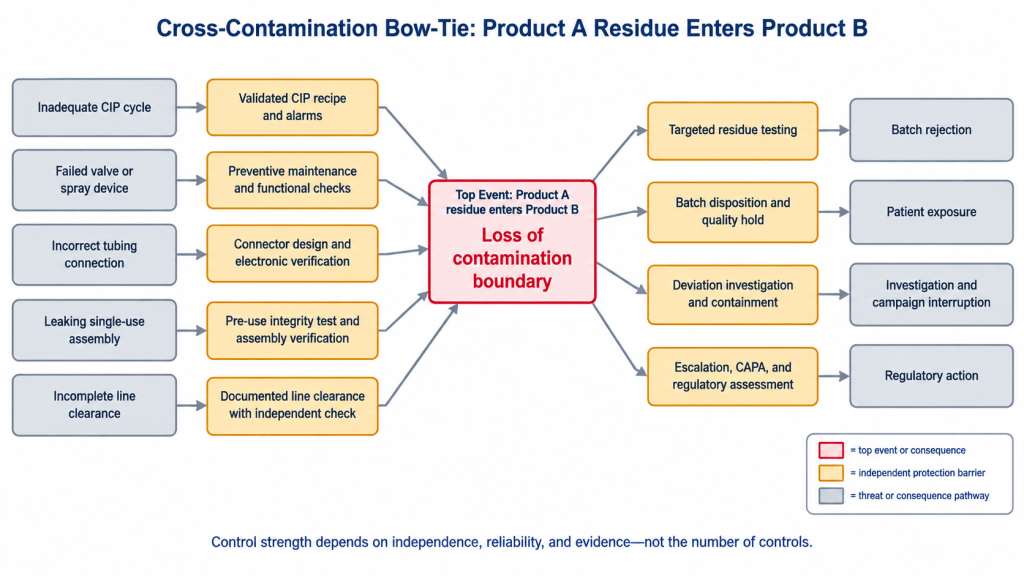
Bow-tie risk analysis showing how CIP failure, equipment faults, incorrect connections, single-use leaks, or incomplete line clearance can allow Product A residue into Product B, with preventive and mitigation barriers between threats, the loss of containment, and patient or regulatory consequences.

The Contamination Pathway and the Equipment Boundary

Reusable stainless equipmentSingle-use assembly
Fixed tank, piping, valves, CIP skidDisposable bag, tubing, connectors, filters
Main risk: retained product residueMain risks: assembly, integrity, E&L, mix-up
Primary assurance: validated cleaningPrimary assurance: supplier qualification and integrity
Key failure modes: dead legs, poor CIP coverage, failed valvesKey failure modes: leak, pinhole, wrong connection, package breach

Reusable Equipment

Reusable stainless-steel systems make the contamination boundary visible. The previous product contacted the equipment; the equipment will contact the next product; therefore, the organization must demonstrate that the transition is safe.

The principal controls are equipment design, defined cleaning procedures, validated cleaning performance, validated sampling and analytical methods, controlled dirty and clean hold times, inspection, preventive maintenance, status control, and periodic verification. FDA expects written cleaning procedures, predefined protocols, sensitive analytical methods, recovery studies, documented results, and management-approved conclusions that residues have been reduced to acceptable levels.

A reusable system assessment should examine:

  • Product-contact surface area and materials of construction.
  • Dead legs, low points, shadowed spray areas, valve bodies, diaphragms, gaskets, seals, and instrument ports.
  • Surface roughness, weld quality, drainability, slope, and retained-volume risk.
  • CIP coverage, flow, turbulence, spray-device performance, temperature, chemistry, concentration, time, and final-rinse endpoints.
  • Manual interventions and disassembly requirements.
  • Ability to inspect hard-to-clean locations.
  • Dirty-hold and clean-hold conditions.
  • Residue degradation or fixation during heat, drying, storage, or cleaning.
  • Microbial proliferation and endotoxin risk in retained moisture.
  • Maintenance failure modes such as blocked traps, failed valves, misaligned spray devices, sensor drift, or recipe changes.

Worst-case selection must be multidimensional. The lowest HBEL may identify the most hazardous product, but it may not be the hardest to remove. The most difficult cleaning challenge may instead be driven by solubility, concentration, viscosity, aggregation, drying behavior, adsorption, equipment geometry, or interaction with the cleaning agent. Health Canada’s guidance identifies HBEL, cleanability, solubility, physical characteristics, and prior experience among relevant worst-case factors and expects cleaning methods to be capable of measuring residue below the selected limit.

Cleaning limits

The HBEL for the previous product is translated into a maximum safe carryover for the next product using next-product batch size and maximum daily dose. That allowable mass is then allocated across the actual shared product-contact surface and converted into swab, rinse, or other sampling limits. The calculation must account for the entire shared process train and avoid allocating the same allowable carryover independently to multiple pieces of equipment.

The final operational limit should be no higher than the health-based limit and may need to be lower because of analytical capability, process control, variability, visual detectability, or company policy. “Visually clean” remains useful as an immediate gross-failure check but cannot replace a health-based and analytically verified criterion for product changeover.

The cleaning validation package should integrate:

  • Laboratory cleanability and degradation studies.
  • Coupon recovery for each relevant material of construction.
  • Swab and rinse method suitability.
  • Product-specific or scientifically justified nonspecific analytical methods.
  • Method specificity against degradants and cleaning-agent interference.
  • Worst-case locations selected from design and process knowledge.
  • Hold-time studies.
  • Automated recipe and alarm challenge.
  • Replicate validation runs under defined worst-case conditions.
  • Ongoing verification and periodic review of process capability.

A failed result cannot be repaired by repeated sampling until a passing value appears. FDA warns that routine “test until clean” behavior may demonstrate that the process is not validated rather than provide assurance of cleanliness.

Single-Use Systems

Single-use technology changes the risk architecture; it does not eliminate contamination control.

A fully disposable, closed product-contact path can sharply reduce the direct previous-product residue pathway because the contacted components are discarded rather than cleaned for the next product. It can also reduce cleaning-validation burden for those specific components. But the facility still contains reusable interfaces, support equipment, rooms, biosafety cabinets, external surfaces, transfer devices, sensors, exhaust pathways, and operators. The critical question becomes: Where does the disposable boundary begin and end?

EU GMP Annex 1 defines SUS broadly to include bags, filters, tubing, connectors, valves, bottles, and sensors and requires SUS-specific risks to be assessed within the contamination control strategy. Those risks include product-surface interactions, extractables and leachables, fragility relative to fixed systems, manual operations and connections, assembly complexity, holes and leakage, packaging opening, filter integrity, and particulate contamination.

A useful comparison is:

Risk dimensionReusable equipmentSingle-use system
Previous-product residueControlled by validated cleaningReduced where the complete contacted path is discarded
Main validation burdenCleaning process, sampling, analytical method, hold times, CIP performanceSupplier, sterilization, assembly, integrity, connection, shipping, installation, and use qualification
Typical hidden boundaryValves, seals, dead legs, skid piping, probesReusable probes, housings, manifolds, pumps, clamps, transfer ports, support vessels
Human contributionManual cleaning, assembly, inspection, status controlUnpacking, inspection, installation, connection, manipulation, and line clearance
Material interactionCorrosion, adsorption, surface condition, cleaning-agent compatibilityExtractables, leachables, adsorption, absorption, reactivity, and particles
Failure signatureResidue, retained liquid, ineffective cycle, maintenance degradationPinholes, leaks, misconnections, wrong assembly, compromised package, weld failure
Lifecycle dependenceEquipment maintenance and cleaning-state controlSupplier change control, lot consistency, irradiation or sterilization assurance, logistics

The boundary problem

The term “single-use process” is often applied too casually. A disposable bag connected to a reusable chromatography skid is not a completely single-use process. Neither is a disposable bioreactor connected through reusable probes or a stainless transfer panel. Every reusable product-contact or potentially product-contact interface must be identified and assigned an appropriate cleaning, sterilization, dedication, or disposal strategy.

Hybrid systems deserve particular scrutiny because responsibility can fall between programs. The cleaning-validation team may assume the flow path is disposable, while the SUS qualification team may assume reusable interfaces are covered elsewhere. The risk assessment should include a boundary diagram showing:

  • All direct product-contact components.
  • Indirect contact and splash-exposure surfaces.
  • Sterile boundaries and connection points.
  • Reusable sensors, housings, and hardware.
  • Components retained between campaigns.
  • Components disposed after each batch, campaign, or product.
  • Product-contact status following an integrity failure.
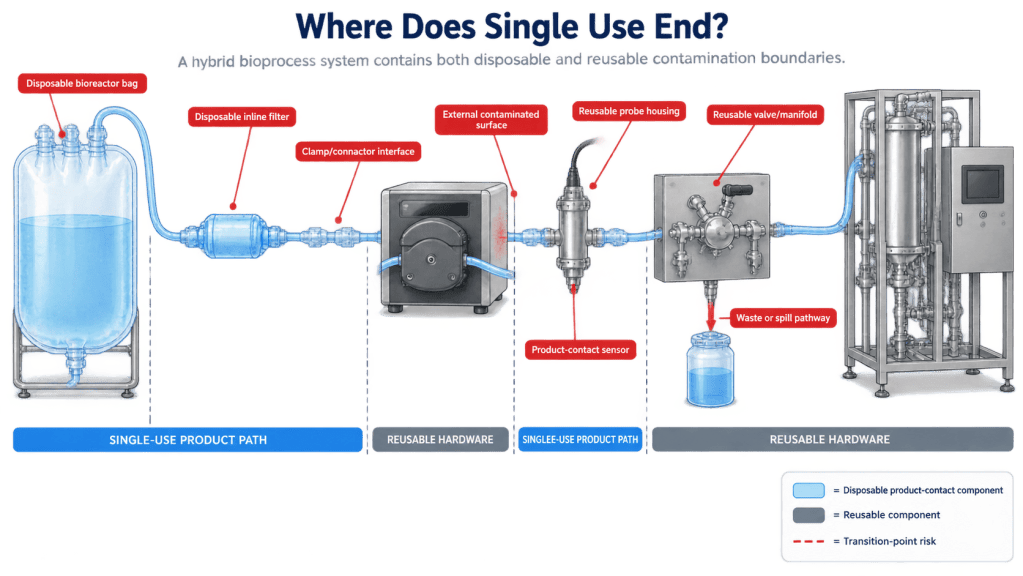
Hybrid bioprocess flow showing disposable bioreactor bags, tubing, filters, and connectors transitioning to reusable pump, sensor, transfer-panel, and chromatography hardware; red callouts mark contamination-control boundaries and spill pathways.

Integrity as contamination control

SUS integrity is both a sterility issue and a cross-contamination issue. A leak can release product into the room, contaminate equipment exteriors, expose operators, or create a pathway into another process. A loss of integrity may also allow environmental or adjacent-process contamination into the system.

Annex 1 expects SUS to maintain integrity under intended processing conditions and identifies extreme operations, including freezing, thawing, transport, and manipulation, as relevant challenges. Qualification should therefore address worst-case pressure, vacuum, agitation, temperature, duration, shipping, installation, connection, and operator handling, not merely supplier burst-test data.

Controls should include:

  • Qualified component and assembly suppliers.
  • Defined critical quality attributes and specifications.
  • Verification of sterilization evidence for each received unit where applicable.
  • Incoming inspection and packaging-integrity checks.
  • Controlled storage and handling.
  • Installation and connection instructions designed to prevent error.
  • Pre-use and, where justified, post-use integrity testing.
  • Leak response and contamination-boundary assessment.
  • Weld and connector qualification.
  • Operator qualification for assembly and manipulation.
  • Supplier change notification and comparability assessment.

Extractables and leachables

SUS removes one patient-safety concern, previous-product residue from reused contact surfaces, but introduces another: chemical species migrating from polymeric components. Annex 1 requires evaluation of product adsorption and reactivity under process conditions and assessment of extractable and leachable profiles, particularly for high-risk components, long contact times, or materials capable of absorbing process constituents.

The evaluation should consider the full process, including sterilization method and dose, contact time, temperature, pH, solvent characteristics, surface-area-to-volume ratio, agitation, storage, freezing and thawing, and cumulative contact across assemblies. Supplier extractables packages are inputs, not automatic proof of suitability. Their test conditions must be scientifically bridged to the actual process.

This is another point at which human safety expertise matters. A detected or predicted leachable should be evaluated against an appropriate toxicological threshold and clinical exposure scenario. The product-safety assessment for a multi-product facility therefore has two related but distinct jobs: establishing safe exposure to previous-product residues and evaluating patient exposure to process-material leachables.

Mix-up risk

SUS can reduce cleaning-related carryover while increasing configuration and mix-up risk. Multi-product facilities may hold visually similar bags, manifolds, filters, connectors, and tubing sets for several clients. A correct component assembled in the wrong orientation, or a wrong component with a compatible connection, can defeat the process while looking superficially acceptable.

Controls should include unique part numbers, electronic bill-of-material verification, barcode or equivalent identification, kitting, line clearance, independent verification of critical assemblies, connection maps, recipe interlocks where possible, and reconciliation of issued, used, and discarded components.

Facility and Process Controls

Equipment choice is only one layer. The facility must prevent contamination through the broader manufacturing environment.

EU GMP Chapter 5 identifies technical and organizational measures that may include dedicated premises or equipment, self-contained areas, closed systems, local extraction, pressure cascades, transfer controls, validated cleaning, waste management, protective clothing, campaign manufacture, and verification of control effectiveness. WHO similarly emphasizes technical and organizational controls, closed systems, cleaning validation, dedicated areas or equipment where justified, and periodic review of cross-contamination measures.

A hierarchy of controls is useful:

  1. Eliminate the pathway: Exclude an incompatible product, avoid open handling, or remove shared product contact.
  2. Physically contain or segregate: Use closed processing, dedicated suites, separate HVAC, barriers, isolators, or dedicated equipment.
  3. Engineer the interface: Use contained transfer, validated connectors, local extraction, pressure control, automation, and interlocks.
  4. Validate removal or inactivation: Apply reproducible cleaning and decontamination with adequate analytical verification.
  5. Control organization and sequence: Campaign, schedule, restrict personnel movement, segregate tools and materials, and perform line clearance.
  6. Detect loss of control: Use environmental, surface, residue, process, and maintenance monitoring targeted to credible failure modes.

Procedures and training are essential, but they are weaker than elimination, containment, and engineering controls. A risk assessment that accepts a high-consequence pathway because “operators are trained” is usually signaling that stronger controls were not seriously considered.

Campaigning

Campaign manufacture separates products in time, not space. It can reduce simultaneous exposure but does not remove residues already present in equipment, rooms, utilities, or shared support areas. Campaigning is acceptable only when paired with a validated and operationally controlled changeover capable of restoring the facility to the required state.

The campaign assessment should consider maximum campaign length, residue accumulation, microbial control, resin or membrane reuse, room and equipment cleaning, environmental persistence, maintenance during the campaign, and the likelihood that repeated setup creates normalized deviations.

Dedicated equipment

Dedication should be based on patient risk and control capability, not convention alone. Packed chromatography resins, membranes, or other retained components may be product-dedicated when they are difficult to clean, cannot be sampled representatively, retain product, or create unacceptable uncertainty. But a universal rule that every column or membrane must be dedicated is not a substitute for assessment.

Conversely, a low calculated carryover limit should not be used to justify sharing when the equipment cannot be cleaned, sampled, or verified with adequate margin. The decision to share requires alignment among toxicological acceptability, technical capability, analytical capability, and operational reliability.

Biological Hazards Beyond Product Residue

A cross-contamination assessment cannot stop at active-protein carryover. The process may contain host cells, cell-culture components, host-cell proteins, DNA, viruses or virus-like particles, mycoplasma, bacteria, fungi, endotoxin, cleaning agents, process additives, and product variants.

ICH Q5A(R2) describes three complementary viral-safety controls for biotechnology products: selection and testing of cell lines and raw materials, demonstration of process clearance for adventitious and endogenous viruses, and testing at appropriate production stages. These controls do not replace facility cross-contamination controls. They address product viral safety, while the facility assessment must also prevent pre-clearance material, cell-culture fluids, or laboratory challenge material from crossing into post-clearance or unrelated operations.

The assessment should distinguish at least:

  • Pre-viral-clearance from post-viral-clearance operations.
  • Live-cell or harvest operations from purified-product operations.
  • Product-specific residue from nonspecific organic residue.
  • Microbial contamination from adventitious viral contamination.
  • Endotoxin from viable organisms.
  • Process organisms from environmental organisms.
  • Laboratory viral-clearance studies from manufacturing operations.

Environmental monitoring can support control of viable and particulate contamination, but it is generally not the primary method for detecting product-to-productcarryover. Product-residue pathways require appropriately specific surface, rinse, process, or investigative methods. The monitoring strategy must match the contaminant and pathway.

Analytical Strategy

Analytical capability should be designed from the risk question, not selected because a platform method is already available.

For reusable equipment, the method must detect the residue or a justified surrogate at a level below the operational acceptance criterion, in the presence of cleaning agents, degradants, surface effects, and sampling losses. FDA expects evaluation of both method sensitivity and the ability of the sampling procedure to recover contamination from equipment surfaces.

Possible approaches include:

  • Product-specific immunoassays.
  • Total organic carbon where scientifically justified as a nonspecific measure.
  • HPLC or UPLC methods.
  • Mass spectrometric peptide or protein methods.
  • Protein assays, conductivity, or other process-specific techniques when sufficiently sensitive and selective.
  • PCR or sequencing for defined nucleic-acid or adventitious-agent questions.
  • Microbial and endotoxin methods for relevant biological residues.

The analytical target profile should define intended use, analyte, matrix, required sensitivity, specificity, reportable range, precision, recovery, robustness, and decision threshold. For a CDMO platform, the strategy should explain when a platform method is acceptable, when a product-specific method is required, and how bridging will be performed.

Method capability should influence the manufacturing decision. If the safe carryover level is below what can be reliably sampled and measured, the answer is not to accept the analytical gap. The control strategy must change: through dedication, disposal, additional segregation, improved cleaning, a more sensitive method, or exclusion of the product from the facility.

Control Strength, Not Control Count

A long list of controls can create the illusion of safety. Ten weak, dependent controls are not equivalent to two strong, independent controls.

LOPA is useful here because it asks whether a protection layer is specific, independent, dependable, and auditable. For example, an operator verifying a hose connection and a second operator checking the same connection may be useful, but both controls depend on the same labeling, work environment, and human interpretation. They are not necessarily independent layers.

A stronger scenario might combine:

  • Physically incompatible connectors.
  • Electronic component verification.
  • Recipe interlock.
  • Independent line-clearance verification.
  • Post-assembly integrity testing.

The assessment should document not only that a control exists but also:

  • What failure it prevents or detects.
  • Whether it is preventive or detective.
  • Whether it is independent of other controls.
  • How its effectiveness was established.
  • What evidence demonstrates continued performance.
  • What happens when it fails.

Regulatory inspection guidance for shared facilities similarly emphasizes documenting the process train and controls in enough detail to identify failure opportunities rather than assuming controls are effective.

Make the Risk Assessment Operational

A risk assessment should change how the facility operates. If it does not affect design, scheduling, qualification, training, monitoring, or release, it is probably only a document.

The output should establish:

  • Whether the product is acceptable for the facility.
  • Permitted suites, equipment trains, and scales.
  • Reusable, disposable, and dedicated boundaries.
  • Required campaign sequence and changeover.
  • Cleaning and decontamination requirements.
  • Product-specific analytical requirements.
  • Personnel and material-flow restrictions.
  • Environmental or surface-monitoring requirements.
  • Required engineering modifications.
  • Conditions that prohibit concurrent manufacture.
  • Required controls for maintenance and intervention.
  • Residual risks and formal acceptance authority.
  • Triggers for reassessment.

The decision should be made by a cross-functional team with authority and expertise in toxicology or pharmacology, quality assurance, manufacturing, MSAT, engineering, validation, microbiology, analytical science, EHS or industrial hygiene, supply chain, and the client’s product knowledge. Commercial stakeholders may contribute constraints and timing, but they should not define the patient-safety threshold.

Lifecycle Governance

The assessment cannot be frozen at technology transfer. ICH Q9(R1) includes risk review as an explicit element of QRM, and EMA expects periodic reassessment of the pharmacological and toxicological basis of HBELs.

Reassessment triggers should include:

  • New clinical or nonclinical safety information.
  • Change in dose, route, indication, or patient population.
  • New product introduction or changed manufacturing sequence.
  • Scale, batch-size, or equipment-train change.
  • Change from reusable to single-use equipment or the reverse.
  • New SUS component, material, supplier, sterilization process, or assembly design.
  • Cleaning-agent, cycle, recipe, or analytical-method change.
  • Facility, HVAC, pressure, flow, or room-use change.
  • Repeated cleaning deviations or adverse process-capability trends.
  • Integrity failures, leaks, or recurring connection errors.
  • Maintenance findings affecting cleanability or containment.
  • New organism or adventitious-agent information.
  • Regulatory change or inspection commitment.

A facility-level product matrix should remain under controlled ownership and identify, for every product, its HBEL status, hazard characteristics, applicable equipment, cleaning family, analytical method, dedication requirements, incompatibilities, and approval status. The matrix should not become an uncontrolled scheduling aid; it is a lifecycle quality record.

What Good Looks Like

A mature CDMO can answer the following questions without assembling a crisis team:

  • Which qualified expert established the HBEL, from what data, and when was it last reviewed?
  • What critical effect drives the limit, and how does uncertainty affect the control strategy?
  • Which product pair creates the most stringent carryover condition on each shared train?
  • Where exactly are the reusable and disposable boundaries?
  • Which SUS components carry the greatest integrity or leachables risk?
  • What contamination pathways remain if the first control fails?
  • Which controls are genuinely independent?
  • Can the cleaning process repeatedly achieve the required limit with margin?
  • Can the sampling and analytical methods detect failure at the required level?
  • What happens after a leak, torn bag, failed connector, maintenance intervention, or incomplete line clearance?
  • Which new information automatically reopens the assessment?

If those answers exist only in separate toxicology reports, validation protocols, supplier files, and local SOPs, the organization does not yet have an integrated cross-contamination control strategy. It has fragments.

The Hard Decision

The purpose of risk assessment is not to prove that every product can fit into the facility. Sometimes the scientifically correct conclusion is that it cannot.

A product may require dedicated equipment, a dedicated suite, a fully disposable flow path, additional containment, a different manufacturing sequence, or exclusion from the site because:

  • The HBEL is extremely low or cannot be established with adequate confidence.
  • The hazard includes sensitization, genotoxicity, potent immune activity, or another effect poorly controlled by ordinary cleaning assumptions.
  • The safe residue level is below analytical or sampling capability.
  • The molecule is not reliably removed or inactivated.
  • The process requires open handling that creates an uncontrolled pathway.
  • The facility cannot segregate pre- and post-clearance activities adequately.
  • The SUS boundary contains unacceptable reusable interfaces.
  • The organization cannot demonstrate control after foreseeable human or mechanical failure.

That decision is not evidence that the risk-management process failed. It is evidence that the process worked.

A Better Synthesis

Reusable equipment and single-use systems should not be treated as competing philosophies. They are different control architectures.

Reusable equipment concentrates the burden on cleanable design, validated removal, analytical evidence, maintenance, and disciplined changeover. Single-use systems reduce some direct carryover pathways but concentrate the burden on system boundaries, integrity, supplier oversight, sterilization assurance, material compatibility, extractables and leachables, configuration control, and human assembly.

The human product-safety assessment sits upstream of both. It defines the exposure boundary that gives every downstream control meaning. Without it, cleaning limits are arbitrary, dedication decisions are conventional, and facility-fit conclusions are little more than confidence statements.

For a multi-product CDMO, the strongest contamination control strategy is therefore not the one with the most controls or the greatest use of disposable technology. It is the one that can connect, without gaps:

patient hazard → safe exposure → contamination pathway → equipment boundary → control mechanism → verification evidence → lifecycle review.

That chain is the real product of the risk assessment. Everything else is documentation supporting it.
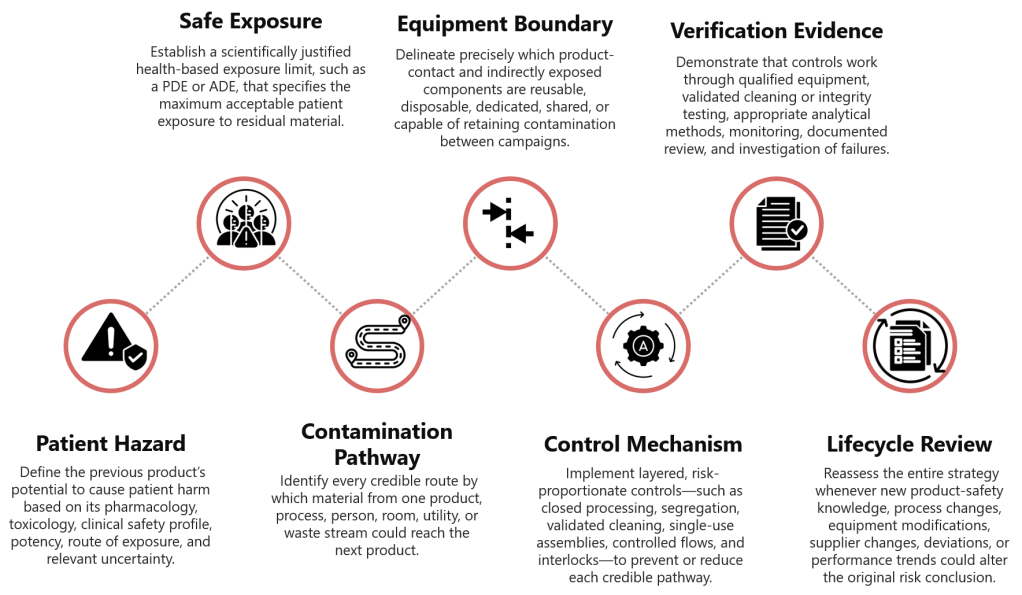
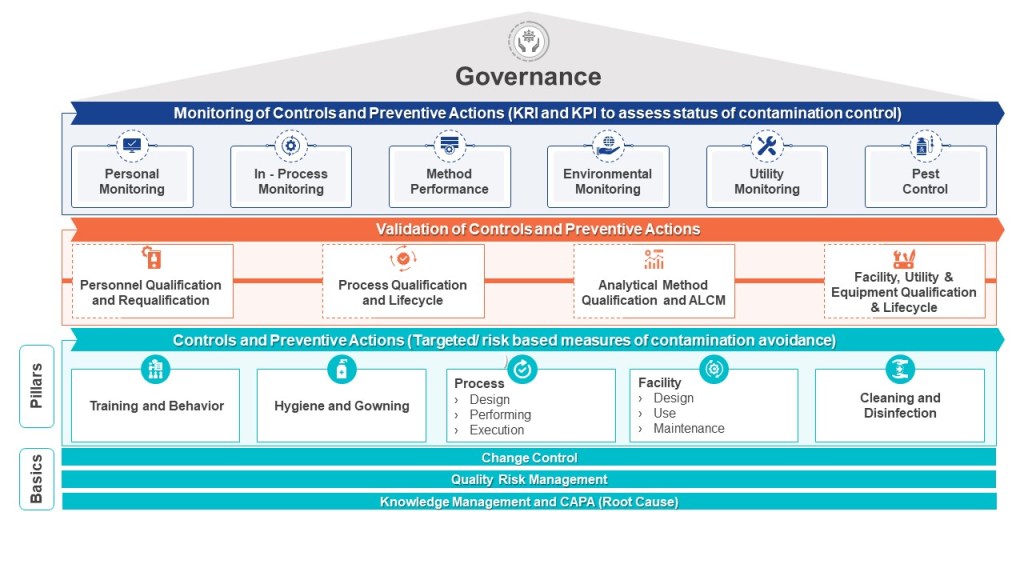
even-step contamination-control framework linking patient hazard to safe exposure, contamination pathways, equipment boundaries, control mechanisms, verification evidence, and lifecycle review for ongoing cross-contamination risk management.

Environmental Monitoring as a Falsifiable Story: Trending, Investigation, and the Illusion of Control

Environmental monitoring (EM) is not a hygiene check. It is a story we tell ourselves about whether our contamination control strategy actually works.

On paper, EM is straightforward: pick locations, define limits, collect samples, trend the data, investigate excursions. In practice, it sits at the messy intersection of microbiology, human behavior, facility design, and what I’ve elsewhere called unfalsifiable control strategies. When it works, EM quietly falsifies our fears by showing the facility behaving as predicted. When it fails, it often fails by never really testing the prediction in the first place.

This post is about that failure mode. More specifically, it is about two parts of the EM ecosystem that are chronically underpowered: trending and investigation. If you’ve read my earlier piece on Risk Assessment for Environmental Monitoring, think of this as the sequel where the risk model has to face its least forgiving critic: reality.

What Environmental Monitoring Is Really For

We often say EM is about verifying “state of control” in cleanrooms. It is a phrase that sounds reassuring and says almost nothing. State of control relative to what?

In Risk Assessment for Environmental Monitoring, I argued that an EM program should be anchored in a living risk assessment that behaves more like a heat map than a checklist. The assessment looks at:

  • Amenability of equipment and surfaces to cleaning and disinfection
  • Personnel presence and flow
  • Material flow and hand‑offs
  • Proximity to open product or direct-contact surfaces
  • Complexity and frequency of interventions

The result is not just a pretty risk matrix to staple behind Annex 1. It is a falsifiable prediction:

Given this process, this design, and these behaviors, contamination is most likely to appear here, here, and here.

Environmental monitoring is the ongoing experiment we run against that prediction. Every plate, every settle dish, every active air sample is data in a long-running test: does the world behave the way our contamination control strategy (CCS) says it should?

That framing matters. It changes the central trending question from “Are we under our alert and action limits?” to “Are the patterns we see consistent with the story our CCS tells?”

In Contamination Control, Risk Management and Change Control, I wrote that contamination control is a risk management problem that must be dynamically updated as we learn. EM is where that learning is supposed to happen. A CCS that cannot be contradicted by EM data is not a strategy; it is a belief system.

Aspirational Data vs Representative Data

Before we talk about trending, we have to talk about the data we are trending. Environmental monitoring quietly encourages a particular pathology: the production of aspirational data.

Aspirational data capture how we wish the facility behaved. Representative data capture how it actually behaves. The differences are subtle and often invisible in a quarterly slide deck.

Common ways organizations drift toward aspiration:

  • Pre-cleaned sampling. The team “freshens” the line before the EM tech arrives, creating a pristine snapshot of a room that never exists during peak operations.
  • Special sampling behavior. Operators slow their movements, avoid borderline practices, and “try harder” when plates are out. EM never sees the way work happens at 02:00 on day seven of a long campaign.
  • Convenience-based sites. Surfaces that are easy to access become the de facto sampling plan. Awkward, congested, or genuinely risky locations become afterthoughts.
  • Frozen plans. Once a sampling plan is approved, changing it is culturally hard. Risk shifts, processes evolve, but the plan clings to the path of least resistance.

The result is a dataset that looks pleasant in management reviews but has low epistemic value. It cannot falsify the CCS because it rarely goes near the conditions where the CCS is most likely to fail.

In Control Strategies, I described control strategies as knowledge systems that depend on feedback loops. EM is one of those loops. When EM is restricted to safe sampling, we quietly turn down the volume on our feedback. We get charts that signal control regardless of what is happening in the real system.

When an inspector asks, “How do you know this program is representative of normal operations?”, the reflex is to present design-intent documents: risk assessments, HVAC diagrams, EM SOPs. We rarely acknowledge the human side:

  • “We always clean right before EM.”
  • “Operators adjust their behavior during sampling.”

But these are exactly the kinds of issues that decide whether EM is a diagnostic or a performance. Representative programs will, at times, generate ugly data. That is what makes trending worth doing.

Trending as Hypothesis Testing, Not Chart Decoration

Trending has become a ritual. EM SOPs promise regular trend analysis. Quarterly reports bristle with plots and heat maps. Warning letter responses swear that “trends are monitored.”

Yet, in practice, most trending boils down to two actions:

  1. Plot excursion counts or percentages by area/quarter.
  2. Confirm that they are below predefined thresholds (excursion rate limits, contamination recovery rate limits, etc.).

This can catch gross failures. It does little for the subtler changes that matter most.

The Wrong Question: “Are We Under the Number?”

When trending is reduced to “staying under 1% excursions” or “within CRR limits,” we are asking the wrong question. Limits are not magic; they are guesses, often conservative and sometimes inherited, about what “normal” should look like.

If your excursion rate moves from 0.05% to 0.4% to 0.8% across four quarters and your only commentary is “still under 1%,” you are treating an arbitrary number as a metaphysical boundary. The system is speaking; you are ignoring it because the cell in the dashboard is still green.

The same goes for contamination recovery rates. USP <1116> introduced CRR specifically to get us away from binary hit/no‑hit thinking. But CRR can easily become just another “good/bad” threshold if we do not embed it in a broader hypothesis test.

The Right Question: “What Pattern Would Falsify Our Story?”

In my 2025 retrospective, I described investigations as opportunities to falsify the control strategy. Trending is the front end of that logic. Before you can falsify a story, you must decide what would count as falsification.

Most EM programs are full of unspoken hypotheses:

  • “If excursion rate ever exceeds X, we have a problem.”
  • “If mold appears in Grade C, the building envelope is compromised.”
  • “If we see TNTC in this room, an operator did something dramatically wrong.”

These thoughts exist as hallway comments and private thresholds in managers’ heads. They rarely make it into procedures.

A mature trending program would make them explicit. For example:

  • Predefined trend triggers:
    • Four consecutive quarters of increasing excursion rate, regardless of absolute level.
    • A statistically significant increase in CRR versus the prior two-year baseline.
    • Recurrence of the same organism species in the same location over multiple months.
    • Emergence of organisms outside the current disinfectant challenge panel.
  • Explicit CCS linkages:
    • “This pattern would contradict our assumption that weekly sporicide is sufficient in Buffer Prep.”
    • “This cluster would contradict our assumption that the gowning procedure is robust under peak traffic.”

In the Rechon warning letter post, I emphasized temporal correlation: contamination patterns aligned with specific campaigns, maintenance events, or staffing changes are not curiosities; they are tests of our explanatory model. Trend analysis that never confronts the CCS with these tests remains decorative.

Three Levels of Trend Analysis

Practically, it helps to distinguish three nested levels of trend analysis:

  1. Descriptive – What happened?
    • Excursion counts and percentages by room, grade, quarter.
    • CRR by parameter and area versus internal limits and historical baselines.
    • Organism distributions over time.
  2. Relational – What does it correlate with?
    • Overlay EM excursions with campaign schedules, change controls, shutdowns, HVAC events, and staffing patterns.
    • Ask, “When X happens, does Y tend to happen as well?”
  3. Explanatory – What does this say about our CCS?
    • Map observed trends back to specific CCS elements: cleaning regime, gowning, HVAC, material/personnel flow.
    • Ask, “If this pattern persists, which CCS or risk assessment statements would we need to rewrite?”

Most organizations live at level 1, dabble in level 2, and rarely touch level 3. But level 3 is where trending actually becomes hypothesis testing.

In The Quality Continuum in Pharmaceutical Manufacturing, I wrote about QC’s role in providing continuity across detection, response, and learning. EM trending is one of the places QC can either uphold that continuum or quietly break it by staying at the descriptive level.

Seasonal Molds and Convenient Amnesia

Seasonality is a good example of where EM trending and investigation often part ways with reality.

Many facilities can tell you, in a hand-wavy way, that “we always see more molds in the fall” or “pollen season is rough on our Grade D.” Fewer can show you a disciplined comparison of Q4 versus Q4 across multiple years, with room-by-room and species-level analysis.

The usual pattern looks like this:

  • A cluster of mold excursions appears in Q4.
  • Each individual event is investigated as a standalone deviation: root cause “seasonal loading,” “door left open,” “operator movement,” etc.
  • The quarterly report notes an “increase in mold recoveries consistent with seasonal variation.”
  • No one actually compares the magnitude and distribution of this Q4 spike to prior years in a way that could falsify the “just seasonal” story.

The phrase “consistent with” is doing a lot of work there. Consistent with does not mean explained by. It means “we can imagine a world where this pattern is seasonal.”

A more disciplined approach would:

  • Collect 3–5 years of Q4 data and compare mold counts and species distributions to other quarters.
  • Look at spatial patterns: are these molds appearing in the same areas repeatedly, or migrating?
  • Correlate with facility and CCS changes: new disinfectants, altered cleaning frequencies, HVAC modifications, construction, landscaping changes.

If the story is “seasonal loading,” that story should make predictions:

  • The spike should repeat with roughly similar magnitude and species profile year-on-year, absent major changes in controls.
  • Rooms with greater exchange with the external environment should be more affected than those with tight controls.

If those predictions do not hold, the hypothesis fails. Perhaps what we actually have is a cleaning regime that is adequate at baseline but fragile under seasonal stress; or a building envelope that slowly degraded; or a CCS that never truly considered spores as a separate risk dimension.

Trending without this kind of explicit, falsifiable seasonal analysis can lull us into a comforting narrative about inevitable variation, instead of pushing us to ask whether our controls are robust enough.

Investigation as the Continuation of Trending

If trending is hypothesis testing at the population level, investigation is the continuation of that testing at the event level.

In several posts, I have written about investigation craft:

  • Using cognitive interviewing instead of leading questions.
  • Avoiding the “Golden Day” fallacy, where we focus only on what was different on the day it went wrong and ignore the many days it went right.
  • Distinguishing between negative reasoning (“no evidence of”) and causal reasoning (“this factor contributed to…”).

EM gives us a special sort of investigation problem. We are often dealing with:

  • Low signal-to-noise ratio.
  • Long latency between event and detection.
  • Data that are inherently spatial and temporal (room, site, campaign, season).

When an EM excursion occurs, the temptation is to compress the narrative down to the single day, the single shift, the single operator. We write: “On this day, operator X failed to do Y, leading to Z.”

That can be true. It is rarely the whole truth.

The Golden Day vs the Typical Day

The Golden Day fallacy appears when we contrast the excursion day to an imaginary “typical day” and then attribute all differences to the excursion. The problem is that most of the time, we do not actually understand what a typical day looks like in any rigorous sense.

Trending should inform that understanding. For example:

  • If a room has a history of low-level hits clustered around certain interventions, then seeing a spike during such an intervention may be a case of the same mechanism operating more strongly, not a unique one-off.
  • If a species has appeared sporadically over months across different surfaces, the excursion might be the moment the underlying reservoir finally crossed a threshold, not the moment the contamination was created.

Good EM investigations make heavy use of trend data as context. They ask:

  • “What does the last year of data in this room look like?”
  • “Have we seen this organism before, and where?”
  • “Which parts of the CCS would predict that this should not happen here?”

The investigation then moves from “What happened on Tuesday?” to “What does Tuesday tell us about a pattern we may have been ignoring?”

Negative Evidence and Silent Failures

Another trap in EM investigations is the overuse of negative evidence:

  • “No HVAC deviations were noted.”
  • “Cleaning logs were complete.”
  • “No maintenance activities were recorded.”

Each of these is a statement about documentation, not reality. They are not useless—records matter—but they are not the same as positive evidence of proper behavior.

When we string together a series of “no deviations noted” statements and conclude that “no systemic issues were identified,” we have quietly moved from absence of evidence to evidence of absence.

Trend-informed EM investigations counter this by looking for silent failures:

  • If we see a slow increase in low-level counts in a room with “perfect” cleaning records, what does that say about the sensitivity of our cleaning oversight?
  • If we consistently recover organisms that our disinfectant efficacy studies never challenged, what does that say about our DE study design?

In other words, investigations should use EM data to question the sensitivity and specificity of our own controls, not just to confirm that paperwork exists.

A Composite Case: When EM Told Two Stories

Consider a composite, anonymized scenario that will feel familiar.

Over the course of a year, a facility sees:

  • A quarterly excursion rate that increases from 0.1% to 0.7%, always under the 1.0% internal limit.
  • Recurrent viable air excursions and occasional TNTC readings in two Grade C cell culture rooms during peak campaigns.
  • A cluster of mold recoveries in Q4 in both Grade C and D areas, including species not previously seen at the site.
  • A contamination recovery rate that remains within internal CRR limits for all grades.

The quarterly EM report dutifully notes:

  • “Excursion rate remains below 1%; EM program continues to demonstrate control.”
  • “Increased excursions seen in Grade C areas consistent with high activity.”
  • “Mold recoveries consistent with seasonal variation.”

Investigations for the individual deviations attribute causes to:

  • Operator aseptic technique.
  • Increased production activity.
  • Seasonal mold loading.

No trend deviation is opened. No update is made to the CCS.

From a strict, spec-driven point of view, this is plausible. From a hypothesis-testing point of view, it is deeply unsatisfying.

A more ambitious approach would treat the year’s data as a falsification challenge to the CCS:

  • The CCS claimed cleaning frequencies and disinfectant rotation were sufficient for Grade C under expected facility loading. Yet under peak load, the system appears fragile.
  • The CCS claimed gowning procedures and personnel flow were robust for cell culture operations. Recurrent TNTC and high viable air counts suggest a different story.
  • The CCS and DE study implicitly assumed the disinfectant panel and contact times were adequate against relevant molds. The appearance of new species and seasonal clustering should trigger a revisit of those assumptions.

In this view, the “trend deviation” is not an administrative nicety. It is the vehicle for making the CCS falsification explicit and forcing the organization to decide:

  • Do we update the control strategy and invest in new controls?
  • Or do we defend the current strategy with stronger evidence?

Either answer is more honest than quietly declaring everything “within limits.”

Making EM Falsifiable by Design

If EM is going to function as a falsifiable story rather than a compliance ritual, a few design principles help.

1. Design for Representation, Not Respectability

Sampling plans should start from the premise that data will sometimes be uncomfortable. That means:

  • Sampling when rooms are at their busiest, not when they are at their tidiest.
  • Including sites that are awkward, noisy, or politically sensitive because they are truly high risk.
  • Formalizing in procedures that pre‑cleaning specifically for EM is not permitted (and verifying this in practice).

If EM results never make anyone uncomfortable, they are probably not representative.

2. Treat Risk Assessments as Versioned Hypotheses

The EM risk assessment and CCS should be treated as versioned, hypothesis-bearing documents:

  • Each version should explicitly state key assumptions: e.g., “Weekly sporicide is sufficient for Grade C floors under expected traffic.”
  • Trend analysis should regularly review whether observed patterns still align with those assumptions.
  • When they do not, the CCS and risk assessment should be revised, not simply the justification text.

This links EM data to change control in a way that Contamination Control, Risk Management and Change Control sketched conceptually but rarely gets fully implemented.

3. Use Annual Organism Review as a Falsification Step

Annual organism reviews for disinfectant challenge panels are often treated as administrative ticks: yes, we still have a Gram-positive, a Gram-negative, a yeast, a mold, and maybe a facility isolate or two.

A more useful review would ask:

  • Which organisms actually dominated our EM recoveries this year?
  • Which organisms recurred in high-risk rooms?
  • Which organisms appeared for the first time, and where?
  • Which of these are covered by our current disinfectant efficacy panel, and which are not?

When there is a mismatch, that is a hypothesis failure: our DE panel is not representative of the real flora. The response might be to:

  • Add one or two high-frequency isolates to the next DE study.
  • Re‑evaluate contact times or concentrations.
  • Re-examine how disinfectant is applied in challenging locations.

This turns the organism review into an explicit test of how well our lab studies generalize to the field.

4. Integrate Trend Triggers into Investigation Governance

Trend triggers—like consecutive quarters of increase, or recurrent species in a location—should be codified and tied directly to deviation types. For example:

  • “Any four-quarter monotonic increase in excursion rate in a grade triggers a site-level EM trend deviation.”
  • “Any repeated recovery of the same mold in the same room over three months triggers a mold trend deviation.”

These trend deviations should then be treated with the same seriousness as a major one-off excursion, because they represent repeated falsification of a CCS assumption, not a single-point failure.

Culture: Pretty Charts vs Uncomfortable Truths

Behind all of this sits culture. Environmental monitoring lives in a tension between two expectations:

  • Regulators expect EM to be representative of normal operations.
  • Leadership often expects EM results to be respectable—low, stable, reassuring.

Those expectations are not always compatible.

A representative EM program will sometimes show uncomfortable patterns:

  • A room that is chronically fragile under certain campaigns.
  • A mold species that stubbornly reappears despite cleaning.
  • A slow drift upward in viable counts in a high-risk area.

If every excursion turns into a hunt for the “operator at fault,” people learn quickly that ignorance is safer than insight. Sampling windows get narrowed, “special cleaning” becomes routine, and the data gradually become aspirational.

Building a culture where EM can falsify our own stories requires a few commitments:

  • An excursion is the start of a learning conversation, not the end of a blame assignment.
  • Trend deviations are opportunities to reconsider strategies, not black marks.
  • Quality and operations jointly own the CCS and EM program; neither can use the other as a shield.

In Lessons from the Rechon Life Science Warning Letter, I argued that contamination events are often the visible tip of a long, shared history of decisions that made the system brittle. EM is one of the few tools that can reveal that history in real time—if we let it.

Questions to Ask of Your Own EM Program

If you want to stress-test your own EM trending and investigation system, a few questions can help. Treat this as a discussion tool, not a checklist.

About representation

  • When are most of your EM samples taken: during peak activity or during “quiet times”?
  • If you shadowed an EM tech for a week, what unwritten rules would you see about when and where they really sample?

About risk and CCS

  • Can you point to specific CCS statements that your EM data are actively testing?
  • When was the last time an EM trend led to a formal change to the CCS, rather than just a CAPA or training?

About trending

  • Do your trend reports do more than plot counts versus limits?
  • Have you defined patterns (e.g., consecutive increases, changing organism profiles) that automatically trigger deeper review?

About investigation

  • How often do EM investigations bring in trend data from previous months as part of the causal reasoning?
  • How often does the conclusion “no systemic issue identified” rest primarily on “no deviations found in records”?

About organisms and disinfectants

  • Does your current disinfectant efficacy panel match the organisms you actually recover?
  • Have you added or removed isolates based on organism review in the last three years?

If the honest answers make you uncomfortable, that is a good sign. It means there is room to turn EM from a hygiene ritual into a genuine falsification engine for your control strategy.

Environmental monitoring is, at its best, a continuous experiment we run on our own systems. Every sample is an invitation for the facility to contradict the story we tell about it. Trending and investigation are how we listen to those contradictions and decide whether to learn from them or explain them away.

We can continue to treat EM as a series of charts we wave at auditors. Or we can treat it as evidence in an ongoing argument between our control strategies and the stubbornness of reality.

The second option is harder. It is also the only one that moves us forward.

f

Equipment Lifecycle Management in the Eyes of the FDA

The October 2025 Warning Letter to Apotex Inc. is fascinating not because it reveals anything novel about FDA expectations, but because it exposes the chasm between what we know we should do and what we actually allow to happen on our watch. Evaluate it together with what we are seeing for Complete Response Letter (CRL) data, we can see that companies continue to struggle with the concept of equipment lifecycle management.

This isn’t about a few leaking gloves or deteriorated gaskets. This is about systemic failure in how we conceptualize, resource, and execute equipment management across the entire GMP ecosystem. Let me walk you through what the Apotex letter really tells us, where the FDA is heading next, and why your current equipment qualification program is probably insufficient.

The Apotex Warning Letter: A Case Study in Lifecycle Management Failure

The FDA’s Warning Letter to Apotex (WL: 320-26-12, October 31, 2025) reads like a checklist of every equipment lifecycle management failure I’ve witnessed in two decades of quality oversight. The agency cited 21 CFR 211.67(a) equipment maintenance failures, 21 CFR 211.192 inadequate investigations, and 21 CFR 211.113(b) aseptic processing deficiencies. But these citations barely scratch the surface of what actually went wrong.

The Core Failures: A Pattern of Deferral and Neglect

Between September 2023 and April 2025—18 months—Apotex experienced at least eight critical equipment failures during leak testing. Their personnel responded by retesting until they achieved passing results rather than investigating root causes. Think about that timeline. Eight failures over 18 months means a failure every 2-3 months, each one representing a signal that their equipment was degrading. When investigators finally examined the system, they found over 30 leaking areas. This wasn’t a single failure; this was systemic equipment deterioration that the organization chose to work around rather than address.

The letter documents white particle buildup on manufacturing equipment surfaces, particles along conveyor systems, deteriorated gasket seals, and discolored gloves. Investigators observed a six-millimeter glove breach that was temporarily closed with a cable tie before production continued. They found tape applied to “false covers” as a workaround. These aren’t just housekeeping issues—they’re evidence that Apotex had crossed from proactive maintenance into reactive firefighting, and then into dangerous normalization of deviation.

Most damning: Apotex had purchased upgraded equipment nearly a year before the FDA inspection but continued using the deteriorating equipment that was actively generating particles contaminating their nasal spray products. They had the solution in their possession. They chose not to implement it.

The Investigation Gap: Equipment Failures as Quality System Failures

The FDA hammered Apotex on their failure to investigate, but here’s what’s really happening: equipment failures are quality system failures until proven otherwise. When a leak happens , you don’t just replace whatever component leaked. You ask:

  • Why did this component fail when others didn’t?
  • Is this a batch-specific issue or a systemic supplier problem?
  • How many products did this breach potentially affect?
  • What does our environmental monitoring data tell us about the timeline of contamination?
  • Are our maintenance intervals appropriate?

Apotex’s investigators didn’t ask these questions. Their personnel retested until they got passing results—a classic example of “testing into compliance” that I’ve seen destroy quality cultures. The quality unit failed to exercise oversight, and management failed to resource proper root cause analysis. This is what happens when quality becomes a checkbox exercise rather than an operational philosophy.​

BLA CRL Trends: The Facility Equipment Crisis Is Accelerating

The Apotex warning letter doesn’t exist in isolation. It’s part of a concerning trend in FDA enforcement that’s becoming impossible to ignore. Facility inspection concerns dominate CRL justifications. Manufacturing and CMC deficiencies account for approximately 44% of all CRLs. For biologics specifically, facility-related issues are even more pronounced.​

The Biologics-Specific Challenge

Biologics license applications face unique equipment lifecycle scrutiny. The 2024-2025 CRL data shows multiple biosimilars rejected due to third-party manufacturing facility issues despite clean clinical data. Tab-cel (tabelecleucel) received a CRL citing problems at a contract manufacturing organization—the FDA rejected an otherwise viable therapy because the facility couldn’t demonstrate equipment control.​

This should terrify every biotech quality leader. The FDA is telling us: your clinical data is worthless if your equipment lifecycle management is suspect. They’re not wrong. Biologics manufacturing depends on consistent equipment performance in ways small molecule chemistry doesn’t. A 0.2°C deviation in a bioreactor temperature profile, caused by a poorly maintained chiller, can alter glycosylation patterns and change the entire safety profile of your product. The agency knows this, and they’re acting accordingly.

The Top 10 Facility Equipment Deficiencies Driving CRLs

Genesis AEC’s analysis of 200+ CRLs identified consistent equipment lifecycle themes:​

  1. Inadequate Facility Segregation and Flow (cross-contamination risks from poor equipment placement)
  2. Missing or Incomplete Commissioning & Qualification (especially HVAC, WFI, clean steam systems)
  3. Fire Protection and Hazardous Material Handling Deficiencies (equipment safety systems)
  4. Critical Utility System Failures (WFI loops with dead legs, inadequate sanitization)
  5. Environmental Monitoring System Gaps (manual data recording, lack of 21 CFR Part 11 compliance)
  6. Container Closure and Packaging Validation Issues (missing extractables/leachables data, CCI testing gaps)
  7. Inadequate Cleanroom Classification and Control (ISO 14644 and EU Annex 1 compliance failures)
  8. Lack of Preventive Maintenance and Asset Management (missing calibration records, unclear maintenance responsibilities)
  9. Inadequate Documentation and Change Control (HVAC setpoint changes without impact assessment)
  10. Sustainability and Environmental Controls Overlooked (temperature/humidity excursions affecting product stability)

Notice what’s not on this list? Equipment selection errors. The FDA isn’t seeing companies buy the wrong equipment. They’re seeing companies buy the right equipment and then fail to manage it across its lifecycle. This is a crucial distinction. The problem isn’t capital allocation—it’s operational execution.

FDA’s Shift to “Equipment Lifecycle State of Control”

The FDA has introduced a significant conceptual shift in how they discuss equipment management. The Apotex Warning Letter is part of the agency’s new emphasis on “equipment lifecycle state of control” . This isn’t just semantic gamesmanship. It represents a fundamental understanding that discrete qualification events are not enough and that continuous lifecycle management is long overdue.

What “State of Control” Actually Means

Traditional equipment qualification followed a linear path: DQ → IQ → OQ → PQ → periodic requalification. State of control means:

  • Continuous monitoring of equipment performance parameters, not just periodic checks
  • Predictive maintenance based on performance data, not just manufacturer-recommended intervals
  • Real-time assessment of equipment degradation signals (particle generation, seal wear, vibration changes)
  • Integrated change management that treats equipment modifications as potential quality events
  • Traceable decision-making about when to repair, refurbish, or retire equipment

The FDA is essentially saying: qualification is a snapshot; state of control is a movie. And they want to see the entire film, not just the trailer.

This aligns perfectly with the agency’s broader push toward Quality Management Maturity. As I’ve previously written about QMM, the FDA is moving away from checking compliance boxes and toward evaluating whether organizations have the infrastructure, culture, and competence to manage quality dynamically. Equipment lifecycle management is the perfect test case for this shift because equipment degradation is inevitable, predictable, and measurable. If you can’t manage equipment lifecycle, you can’t manage quality.​

Global Regulatory Convergence: WHO, EMA, and PIC/S Perspectives

The FDA isn’t operating in a vacuum. Global regulators are converging on equipment lifecycle management as a critical inspection focus, though their approaches differ in emphasis.

EMA: The Annex 15 Lifecycle Approach

EMA’s process validation guidance explicitly requires IQ, OQ, and PQ for equipment and facilities as part of the validation lifecycle. Unlike FDA’s three-stage process validation model, EMA frames qualification as ongoing throughout the product lifecycle. Their 2023 revision of Annex 15 emphasizes:​

  • Validation Master Plans that include equipment lifecycle considerations
  • Ongoing Process Verification that incorporates equipment performance data
  • Risk-based requalification triggered by changes, deviations, or trends
  • Integration with Product Quality Reviews (PQRs) to assess equipment impact on product quality

The EMA expects you to prove your equipment remains qualified through annual PQRs and continuous data review having been more explicit about a lifecycle approach for years.

PIC/S: The Change Management Imperative

PIC/S PI 054-1 on change management provides crucial guidance on equipment lifecycle triggers. The document explicitly identifies equipment upgrades as changes that require formal assessment, planning, and implementation controls. Critically, PIC/S emphasizes:​

  • Interim controls when equipment issues are identified but not yet remediated
  • Post-implementation monitoring to ensure changes achieve intended risk reduction
  • Documentation of rejected changes, especially those related to quality/safety hazard mitigation

The Apotex case is a PIC/S textbook violation: they identified equipment deterioration (hazard), purchased upgraded equipment (change proposal), but failed to implement it with appropriate interim controls or timeline management. The result was continued production with deteriorating equipment—exactly what PIC/S guidance is designed to prevent.

WHO: The Resource-Limited Perspective

WHO’s equipment lifecycle guidance, while focused on medical equipment in low-resource settings, offers surprisingly relevant insights for GMP facilities. Their framework emphasizes:​

  • Planning based on lifecycle cost, not just purchase price
  • Skill development and training as core lifecycle components
  • Decommissioning protocols that ensure data integrity and product segregation

The WHO model is refreshingly honest about resource constraints, which applies to many GMP facilities facing budget pressure. Their key insight: proper lifecycle management actually reduces total cost of ownership by 3-10x compared to run-to-failure approaches. This is the business case that quality leaders need to make to CFOs who view maintenance as a cost center.​

The Six-System Inspection Model: Where Equipment Lifecycle Fits

FDA’s Six-System Inspection Model—particularly the Facilities and Equipment System—provides the structural framework for understanding equipment lifecycle requirements. As I’ve previously written, this system “ensures that facilities and equipment are suitable for their intended use and maintained properly” with focus on “design, maintenance, cleaning, and calibration.”​

The Interconnectedness Problem

Here’s where many organizations fail: they treat the six systems as silos. Equipment lifecycle management bleeds across all of them:

  • Production System: Equipment performance directly impacts process capability
  • Laboratory Controls: Analytical equipment lifecycle affects data integrity
  • Materials System: Equipment changes can affect raw material compatibility
  • Packaging and Labeling: Equipment modifications require revalidation
  • Quality System: Equipment deviations trigger CAPA and change control

The Apotex warning letter demonstrates this interconnectedness perfectly. Their equipment failures (Facilities & Equipment) led to container-closure integrity issues (Packaging), which they failed to investigate properly (Quality), resulting in distributed product that was potentially adulterated (Production). The FDA’s response required independent assessments of investigations, CAPA, and change management—three separate systems all impacted by equipment lifecycle failures.

The “State of Control” Assessment Questions

If FDA inspectors show up tomorrow, here’s what they’ll ask about your equipment lifecycle management:

  1. Design Qualification: Do your User Requirements Specifications include lifecycle maintenance requirements? Are you specifying equipment with modular upgrade paths, or are you buying disposable assets?
  2. Change Management: When you purchase upgraded equipment, what triggers its implementation? Is there a formal risk assessment linking equipment deterioration to product quality? Or do you wait for failures?
  3. Preventive Maintenance: Are your PM intervals based on manufacturer recommendations, or on actual performance data? Do you have predictive maintenance programs using vibration analysis, thermal imaging, or particle counting?
  4. Decommissioning: When equipment reaches end-of-life, do you have formal retirement protocols that assess data integrity impact? Or does old equipment sit in corners of the cleanroom “just in case”?
  5. Training: Do your operators understand equipment lifecycle concepts? Can they recognize early degradation signals? Or do they just call maintenance when something breaks?

These aren’t theoretical questions. They’re directly from recent 483 observations and CRL deficiencies.​

The Business Case: Why Equipment Lifecycle Management Is Economic Imperative

Let’s be blunt: the pharmaceutical industry has treated equipment as a capital expense to be minimized, not an asset to be optimized. This is catastrophically wrong. The Apotex warning letter shows the true cost of this mindset:

  • Product recalls: Multiple ophthalmic and oral solutions recalled
  • Production suspension: Sterile manufacturing halted
  • Independent assessments: Required third-party evaluation of entire quality system
  • Reputational damage: Public warning letter, potential import alert
  • Opportunity cost: Products stuck in regulatory limbo while competitors gain market share

Contrast this with the investment required for proper lifecycle management:

  • Predictive maintenance systems: $50,000-200,000 for sensors and software
  • Enhanced training programs: $10,000-30,000 annually
  • Lifecycle documentation systems: $20,000-100,000 implementation
  • Total: Less than the cost of a single batch recall

The ROI is undeniable. Equipment lifecycle management isn’t a cost center—it’s risk mitigation with quantifiable financial returns.

The CFO Conversation

I’ve had this conversation with CFOs more times than I can count. Here’s what works:

Don’t say: “We need more maintenance budget.”

Say: “Our current equipment lifecycle risk exposure is $X million based on recent CRL trends and warning letters. Investing $Y in lifecycle management reduces that risk by Z% and extends asset utilization by 2-3 years, deferring $W million in capital expenditures.”

Bring data. Show them the Apotex letter. Show them the Tab-cel CRL. Show them the 51 CRLs driven by facility concerns. CFOs understand risk-adjusted returns. Frame equipment lifecycle management as portfolio risk management, not engineering overhead.

Practical Framework: Building an Equipment Lifecycle Management Program

Enough theory. Here’s the practical framework I’ve implemented across multiple DS facilities, refined through inspections, and validated against regulatory expectations.

Phase 1: Asset Criticality Assessment

Not all equipment deserves equal lifecycle attention. Use a risk-based approach:

Criticality Class A (Direct Impact): Equipment whose failure directly impacts product quality, safety, or efficacy. Bioreactors, purification skids, sterile filling lines, environmental monitoring systems. These require full lifecycle management including continuous monitoring, predictive maintenance, and formal retirement protocols.

Criticality Class B (Indirect Impact): Equipment whose failure impacts GMP environment but not direct product attributes. HVAC units, WFI systems, clean steam generators. These require enhanced lifecycle management with robust PM programs and performance trending.

Criticality Class C (No Impact): Non-GMP equipment. Standard maintenance practices apply.

Phase 2: Lifecycle Documentation Architecture

Create a master equipment lifecycle file for each Class A and B asset containing:

  1. User Requirements Specification with lifecycle maintenance requirements
  2. Design Qualification including maintainability and upgrade path assessment
  3. Commissioning Protocol (IQ/OQ/PQ) with acceptance criteria that remain valid throughout lifecycle
  4. Maintenance Master Plan defining PM intervals, spare parts strategy, and predictive monitoring
  5. Performance Trending Protocol specifying parameters to monitor, alert limits, and review frequency
  6. Change Management History documenting all modifications with impact assessment
  7. Retirement Protocol defining end-of-life triggers and data migration requirements

As I’ve written about in my posts on GMP-critical systems, documentation must be living documents that evolve with the asset, not static files that gather dust after qualification.​

Phase 3: Predictive Maintenance Implementation

Move beyond manufacturer-recommended intervals to condition-based maintenance:

  • Vibration analysis for rotating equipment (pumps, agitators)
  • Thermal imaging for electrical systems and heat transfer equipment
  • Particle counting for cleanroom equipment and filtration systems
  • Pressure decay testing for sterile barrier systems
  • Oil analysis for hydraulic and lubrication systems

The goal is to detect degradation 6-12 months before failure, allowing planned intervention during scheduled shutdowns.

Phase 4: Integrated Change Control

Equipment changes must flow through formal change control with:

  • Technical assessment by engineering and quality
  • Risk evaluation using FMEA or similar tools
  • Regulatory assessment for potential prior approval requirements
  • Implementation planning with interim controls if needed
  • Post-implementation review to verify effectiveness

The Apotex case shows what happens when you skip the interim controls. They identified the need for upgraded equipment (change) but failed to implement the necessary bridge measures to ensure product quality while waiting for that equipment to come online. They allowed the “future state” (new equipment) to become an excuse for neglecting the “current state” (deteriorating equipment).

This is a failure of Change Management Logic. In a robust quality system, the moment you identify that equipment requires replacement due to performance degradation, you have acknowledged a risk. If you cannot replace it immediately—due to capital cycles, lead times, or qualification timelines—you must implement interim controls to mitigate that risk.

For Apotex, those interim controls should have been:

  • Reduced run durations to minimize stress on failing seals.
  • Increased sampling plans (e.g., 100% leak testing verification or enhanced AQLs).
  • Shortened maintenance intervals (replacing gaskets every batch instead of every campaign).
  • Enhanced environmental monitoring focused specifically on the degrade zones.

Instead, they did nothing. They continued business as usual, likely comforting themselves with the purchase order for the new machine. The FDA’s response was unambiguous: A purchase order is not a CAPA. Until the new equipment is qualified and operational, your legacy equipment must remain in a state of control, or production must stop. There is no regulatory “grace period” for deteriorating assets.

Phase 5: The Cultural Shift—From “Repair” to “Reliability”

The final and most difficult phase of this framework is cultural. You cannot write a SOP for this; you have to lead it.

Most organizations operate on a “Break-Fix” mentality:

  1. Equipment runs until it alarms or fails.
  2. Maintenance fixes it.
  3. Quality investigates (or papers over) the failure.
  4. Production resumes.

The FDA’s “Lifecycle State of Control” demands a “Predict-Prevent” mentality:

  1. Equipment is monitored for degradation signals (vibration, heat, particle counts).
  2. Maintenance intervenes before failure limits are reached.
  3. Quality reviews trends to confirm the intervention was effective.
  4. Production continues uninterrupted.

To achieve this, you need to change how you incentivize your teams. Stop rewarding “heroic” fixes at 2 AM. Start rewarding the boring, invisible work of preventing the failure in the first place. As I’ve written before regarding Quality Management Maturity (QMM), mature quality systems are quiet systems. Chaos is not a sign of hard work; it’s a sign of lost control.

Conclusion: The Choice Before Us

The warning letter to Apotex Inc. and the rising tide of facility-related CRLs are not random compliance noise. They are signal flares. The regulatory expectations for equipment management have fundamentally shifted from static qualification (Is it validated?) to dynamic lifecycle management (Is it in a state of control right now?).

The FDA, EMA, and PIC/S have converged on a single truth: You cannot assure product quality if you cannot guarantee equipment performance.

We are at an inflection point. The industry’s aging infrastructure, combined with the increasing complexity of biologic processes and the unforgiving nature of residue control, has created a perfect storm. We can no longer treat equipment maintenance as a lower-tier support function. It is a core GMP activity, equal in criticality to batch record review or sterility testing.

As Quality Leaders, we have two choices:

  1. The Apotex Path: Treat equipment upgrades as capital headaches to be deferred. Ignore the “minor” leaks and “insignificant” residues. Let the maintenance team bandage the wounds while we focus on “strategic” initiatives. This path leads to 483s, warning letters, CRLs, and the excruciating public failure of seeing your facility’s name in an FDA press release.
  2. The Lifecycle Path: Embrace the complexity. Resource the predictive maintenance programs. Validate the residue removal. Treat every equipment change as a potential risk to patient safety. Build a system where equipment reliability is the foundation of your quality strategy, not an afterthought.

The second path is expensive. It is technically demanding. It requires fighting for budget dollars that don’t have immediate ROI. But it allows you to sleep at night, knowing that when—not if—the FDA investigator asks to see your equipment maintenance history, you won’t have to explain why you used a cable tie to fix a glove port.

You’ll simply show them the data that proves you’re in control.

Choose wisely.

When Investigation Excellence Meets Contamination Reality: Lessons from the Rechon Life Science Warning Letter

The FDA’s April 30, 2025 warning letter to Rechon Life Science AB serves as a great learning opportunity about the importance robust investigation systems to contamination control to drive meaningful improvements. This Swedish contract manufacturer’s experience offers profound lessons for quality professionals navigating the intersection of EU Annex 1‘s contamination control strategy requirements and increasingly regulatory expectations. It is a mistake to think that just because the FDA doesn’t embrace the prescriptive nature of Annex 1 the agency is not fully aligned with the intent.

This Warning Letter resonates with similar systemic failures at companies like LeMaitre Vascular, Sanofi and others. The Rechon warning letter demonstrates a troubling but instructive pattern: organizations that fail to conduct meaningful contamination investigations inevitably find themselves facing regulatory action that could have been prevented through better investigation practices and systematic contamination control approaches.

The Cascade of Investigation Failures: Rechon’s Contamination Control Breakdown

Aseptic Process Failures and the Investigation Gap

Rechon’s primary violation centered on a fundamental breakdown in aseptic processing—operators were routinely touching critical product contact surfaces with gloved hands, a practice that was not only observed but explicitly permitted in their standard operating procedures. This represents more than poor technique; it reveals an organization that had normalized contamination risks through inadequate investigation and assessment processes.

The FDA’s citation noted that Rechon failed to provide environmental monitoring trend data for surface swab samples, representing exactly the kind of “aspirational data” problem. When investigation systems don’t capture representative information about actual manufacturing conditions, organizations operate in a state of regulatory blindness, making decisions based on incomplete or misleading data.

This pattern reflects a broader failure in contamination investigation methodology: environmental monitoring excursions require systematic evaluation that includes all environmental data (i.e. viable and non-viable tests) and must include areas that are physically adjacent or where related activities are performed. Rechon’s investigation gaps suggest they lacked these fundamental systematic approaches.

Environmental Monitoring Investigations: When Trend Analysis Fails

Perhaps more concerning was Rechon’s approach to persistent contamination with objectionable microorganisms—gram-negative organisms and spore formers—in ISO 5 and 7 areas since 2022. Their investigation into eight occurrences of gram-negative organisms concluded that the root cause was “operators talking in ISO 7 areas and an increase of staff illness,” a conclusion that demonstrates fundamental misunderstanding of contamination investigation principles.

As an aside, ISO7/Grade C is not normally an area we see face masks.

Effective investigations must provide comprehensive evaluation including:

  • Background and chronology of events with detailed timeline analysis
  • Investigation and data gathering activities including interviews and training record reviews
  • SME assessments from qualified microbiology and manufacturing science experts
  • Historical data review and trend analysis encompassing the full investigation zone
  • Manufacturing process assessment to determine potential contributing factors
  • Environmental conditions evaluation including HVAC, maintenance, and cleaning activities

Rechon’s investigation lacked virtually all of these elements, focusing instead on convenient behavioral explanations that avoided addressing systematic contamination sources. The persistence of gram-negative organisms and spore formers over a three-year period represented a clear adverse trend requiring a comprehensive investigation approach.

The Annex 1 Contamination Control Strategy Imperative: Beyond Compliance to Integration

The Paradigm Shift in Contamination Control

The revised EU Annex 1, effective since August 2023 demonstrates the current status of regulatory expectations around contamination control, moving from isolated compliance activities toward integrated risk management systems. The mandatory Contamination Control Strategy (CCS) requires manufacturers to develop comprehensive, living documents that integrate all aspects of contamination risk identification, mitigation, and monitoring.

Industry implementation experience since 2023 has revealed that many organizations are faiing to make meaningful connections between existing quality systems and the Annex 1 CCS requirements. Organizations struggle with the time and resource requirements needed to map existing contamination controls into coherent strategies, which often leads to discovering significant gaps in their understanding of their own processes.

Representative Environmental Monitoring Under Annex 1

The updated guidelines place emphasis on continuous monitoring and representative sampling that reflects actual production conditions rather than idealized scenarios. Rechon’s failure to provide comprehensive trend data demonstrates exactly the kind of gap that Annex 1 was designed to address.

Environmental monitoring must function as part of an integrated knowledge system that combines explicit knowledge (documented monitoring data, facility design specifications, cleaning validation reports) with tacit knowledge about facility-specific contamination risks and operational nuances. This integration demands investigation systems capable of revealing actual contamination patterns rather than providing comfortable explanations for uncomfortable realities.

The Design-First Philosophy

One of Annex 1’s most significant philosophical shifts is the emphasis on design-based contamination control rather than monitoring-based approaches. As we see from Warning Letters, and other regulatory intelligence, design gaps are frequently being cited as primary compliance failures, reinforcing the principle that organizations cannot monitor or control their way out of poor design.

This design-first philosophy fundamentally changes how contamination investigations must be conducted. Instead of simply investigating excursions after they occur, robust investigation systems must evaluate whether facility and process designs create inherent contamination risks that make excursions inevitable. Rechon’s persistent contamination issues suggest their investigation systems never addressed these fundamental design questions.

Best Practice 1: Implement Comprehensive Microbial Assessment Frameworks

Structured Organism Characterization

Effective contamination investigations begin with proper microbial assessments that characterize organisms based on actual risk profiles rather than convenient categorizations.

  • Complete microorganism documentation encompassing organism type, Gram stain characteristics, potential sources, spore-forming capability, and objectionable organism status. The structured approach outlined in formal assessment templates ensures consistent evaluation across different sample types (in-process, environmental monitoring, water and critical utilities).
  • Quantitative occurrence assessment using standardized vulnerability scoring systems that combine occurrence levels (Low, Medium, High) with nature and history evaluations. This matrix approach prevents investigators from minimizing serious contamination events through subjective assessments.
  • Severity evaluation based on actual manufacturing impact rather than theoretical scenarios. For environmental monitoring excursions, severity assessments must consider whether microorganisms were detected in controlled environments during actual production activities, the potential for product contamination, and the effectiveness of downstream processing steps.
  • Risk determination through systematic integration of vulnerability scores and severity ratings, providing objective classification of contamination risks that drives appropriate corrective action responses.

Rechon’s superficial investigation approach suggests they lacked these systematic assessment frameworks, focusing instead on behavioral explanations that avoided comprehensive organism characterization and risk assessment.

Best Practice 2: Establish Cross-Functional Investigation Teams with Defined Competencies

Investigation Team Composition and Qualifications

Major contamination investigations require dedicated cross-functional teams with clearly defined responsibilities and demonstrated competencies. The investigation lead must possess not only appropriate training and experience but also technical knowledge of the process and cGMP/quality system requirements, and ability to apply problem-solving tools.

Minimum team composition requirements for major investigations must include:

  • Impacted Department representatives (Manufacturing, Facilities) with direct operational knowledge
  • Subject Matter Experts (Manufacturing Sciences and Technology, QC Microbiology) with specialized technical expertise
  • Contamination Control specialists serving as Quality Assurance approvers with regulatory and risk assessment expertise

Investigation scope requirements must encompass systematic evaluation including background/chronology documentation, comprehensive data gathering activities (interviews, training record reviews), SME assessments, impact statement development, historical data review and trend analysis, and laboratory investigation summaries.

Training and Competency Management

Investigation team effectiveness depends on systematic competency development and maintenance. Teams must demonstrate proficiency in:

  • Root cause analysis methodologies including fishbone analysis, why-why questioning, fault tree analysis, and failure mode and effects analysis approaches suited to contamination investigation contexts.
  • Contamination microbiology principles including organism identification, source determination, growth condition assessment, and disinfectant efficacy evaluation specific to pharmaceutical manufacturing environments.
  • Risk assessment and impact evaluation capabilities that can translate investigation findings into meaningful product, process, and equipment risk determinations.
  • Regulatory requirement understanding encompassing both domestic and international contamination control expectations, investigation documentation standards, and CAPA development requirements.

The superficial nature of Rechon’s gram-negative organism investigation suggests their teams lacked these fundamental competencies, resulting in conclusions that satisfied neither regulatory expectations nor contamination control best practices.

Best Practice 3: Conduct Meaningful Historical Data Review and Comprehensive Trend Analysis

Investigation Zone Definition and Data Integration

Effective contamination investigations require comprehensive trend analysis that extends beyond simple excursion counting to encompass systematic pattern identification across related operational areas. As established in detailed investigation procedures, historical data review must include:

  • Physically adjacent areas and related activities recognition that contamination events rarely occur in isolation. Processing activities spanning multiple rooms, secondary gowning areas leading to processing zones, material transfer airlocks, and all critical utility distribution points must be included in investigation zones.
  • Comprehensive environmental data analysis encompassing all environmental data (i.e. viable and non-viable tests) to identify potential correlations between different contamination indicators that might not be apparent when examining single test types in isolation.
  • Extended historical review capabilities for situations where limited or no routine monitoring was performed during the questioned time frame, requiring investigation teams to expand their analytical scope to capture relevant contamination patterns.
  • Microorganism identification pattern assessment to determine shifts in routine microflora or atypical or objectionable organisms, enabling detection of contamination source changes that might indicate facility or process deterioration.

Temporal Correlation Analysis

Sophisticated trend analysis must correlate contamination events with operational activities, environmental conditions, and facility modifications that might contribute to adverse trends:

  • Manufacturing activity correlation examining whether contamination patterns correlate with specific production campaigns, personnel schedules, cleaning activities, or maintenance operations that might introduce contamination sources.
  • Environmental condition assessment including HVAC system performance, pressure differential maintenance, temperature and humidity control, and compressed air quality that could influence contamination recovery patterns.
  • Facility modification impact evaluation determining whether physical environment changes, equipment installations, utility upgrades, or process modifications correlate with contamination trend emergence or intensification.

Rechon’s three-year history of gram-negative and spore-former recovery represented exactly the kind of adverse trend requiring this comprehensive analytical approach. Their failure to conduct meaningful trend analysis prevented identification of systematic contamination sources that behavioral explanations could never address.

Best Practice 4: Integrate Investigation Findings with Dynamic Contamination Control Strategy

Knowledge Management and CCS Integration

Under Annex 1 requirements, investigation findings must feed directly into the overall Contamination Control Strategy, creating continuous improvement cycles that enhance contamination risk understanding and control effectiveness. This integration requires sophisticated knowledge management systems that capture both explicit investigation data and tacit operational insights.

  • Explicit knowledge integration encompasses formal investigation reports, corrective action documentation, trending analysis results, and regulatory correspondence that must be systematically incorporated into CCS risk assessments and control measure evaluations.
  • Tacit knowledge capture including personnel experiences with contamination events, operational observations about facility or process vulnerabilities, and institutional understanding about contamination source patterns that may not be fully documented but represent critical CCS inputs.

Risk Assessment Dynamic Updates

CCS implementation demands that investigation findings trigger systematic risk assessment updates that reflect enhanced understanding of contamination vulnerabilities:

  • Contamination source identification updates based on investigation findings that reveal previously unrecognized or underestimated contamination pathways requiring additional control measures or monitoring enhancements.
  • Control measure effectiveness verification through post-investigation monitoring that demonstrates whether implemented corrective actions actually reduce contamination risks or require further enhancement.
  • Monitoring program optimization based on investigation insights about contamination patterns that may indicate needs for additional sampling locations, modified sampling frequencies, or enhanced analytical methods.

Continuous Improvement Integration

The CCS must function as a living document that evolves based on investigation findings rather than remaining static until the next formal review cycle:

  • Investigation-driven CCS updates that incorporate new contamination risk understanding into facility design assessments, process control evaluations, and personnel training requirements.
  • Performance metrics integration that tracks investigation quality indicators alongside traditional contamination control metrics to ensure investigation systems themselves contribute to contamination risk reduction.
  • Cross-site knowledge sharing mechanisms that enable investigation insights from one facility to enhance contamination control strategies at related manufacturing sites.

Best Practice 5: Establish Investigation Quality Metrics and Systematic Oversight

Investigation Completeness and Quality Assessment

Organizations must implement systematic approaches to ensure investigation quality and prevent the superficial analysis demonstrated by Rechon. This requires comprehensive quality metrics that evaluate both investigation process compliance and outcome effectiveness:

  • Investigation completeness verification using a rubric or other standardized checklists that ensure all required investigation elements have been addressed before investigation closure. These must verify background documentation adequacy, data gathering comprehensiveness, SME assessment completion, impact evaluation thoroughness, and corrective action appropriateness.
  • Root cause determination quality assessment evaluating whether investigation conclusions demonstrate scientific rigor and logical connection between identified causes and observed contamination events. This includes verification that root cause analysis employed appropriate methodologies and that conclusions can withstand independent technical review.
  • Corrective action effectiveness verification through systematic post-implementation monitoring that demonstrates whether corrective actions achieved their intended contamination risk reduction objectives.

Management Review and Challenge Processes

Effective investigation oversight requires management systems that actively challenge investigation conclusions and ensure scientific rationale supports all determinations:

  • Technical review panels comprising independent SMEs who evaluate investigation methodology, data interpretation, and conclusion validity before investigation closure approval for major and critical deviations. I strongly recommend this as part of qualification and re-qualification activities.
  • Regulatory perspective integration ensuring investigation approaches and conclusions align with current regulatory expectations and enforcement trends rather than relying on outdated compliance interpretations.
  • Cross-functional impact assessment verifying that investigation findings and corrective actions consider all affected operational areas and don’t create unintended contamination risks in other facility areas.

CAPA System Integration and Effectiveness Tracking

Investigation findings must integrate with robust CAPA systems that ensure systematic improvements rather than isolated fixes:

  • Systematic improvement identification that links investigation findings to broader facility or process enhancement opportunities rather than limiting corrective actions to immediate excursion sources.
  • CAPA implementation quality management including resource allocation verification, timeline adherence monitoring, and effectiveness verification protocols that ensure corrective actions achieve intended risk reduction.
  • Knowledge management integration that captures investigation insights for application to similar contamination risks across the organization and incorporates lessons learned into training programs and preventive maintenance activities.

Rechon’s continued contamination issues despite previous investigations suggest their CAPA processes lacked this systematic improvement approach, treating each contamination event as isolated rather than symptoms of broader contamination control weaknesses.

A visual diagram presents a "Living Contamination Control Strategy" progressing toward a "Holistic Approach" through a winding path marked by five key best practices. Each best practice is highlighted in a circular node along the colored pathway.

Best Practice 01: Comprehensive microbial assessment frameworks through structured organism characterization.

Best Practice 02: Cross functional teams with the right competencies.

Best Practice 03: Meaningful historic data through investigation zones and temporal correlation.

Best Practice 04: Investigations integrated with Contamination Control Strategy.

Best Practice 05: Systematic oversight through metrics and challenge process.

The diagram represents a continuous improvement journey from foundational practices focused on organism assessment and team competency to integrating data, investigations, and oversight, culminating in a holistic contamination control strategy.

The Investigation-Annex 1 Integration Challenge: Building Investigation Resilience

Holistic Contamination Risk Assessment

Contamination control requires investigation systems that function as integral components of comprehensive strategies rather than reactive compliance activities.

Design-Investigation Integration demands that investigation findings inform facility design assessments and process modification evaluations. When investigations reveal design-related contamination sources, CCS updates must address whether facility modifications or process changes can eliminate contamination risks at their source rather than relying on monitoring and control measures.

Process Knowledge Enhancement through investigation activities that systematically build organizational understanding of contamination vulnerabilities, control measure effectiveness, and operational factors that influence contamination risk profiles.

Personnel Competency Development that leverages investigation findings to identify training needs, competency gaps, and behavioral factors that contribute to contamination risks requiring systematic rather than individual corrective approaches.

Technology Integration and Future Investigation Capabilities

Advanced Monitoring and Investigation Support Systems

The increasing sophistication of regulatory expectations necessitates corresponding advances in investigation support technologies that enable more comprehensive and efficient contamination risk assessment:

Real-time monitoring integration that provides investigation teams with comprehensive environmental data streams enabling correlation analysis between contamination events and operational variables that might not be captured through traditional discrete sampling approaches.

Automated trend analysis capabilities that identify contamination patterns and correlations across multiple data sources, facility areas, and time periods that might not be apparent through manual analysis methods.

Integrated knowledge management platforms that capture investigation insights, corrective action outcomes, and operational observations in formats that enable systematic application to future contamination risk assessments and control strategy optimization.

Investigation Standardization and Quality Enhancement

Technology solutions must also address investigation process standardization and quality improvement:

Investigation workflow management systems that ensure consistent application of investigation methodologies, prevent shortcuts that compromise investigation quality, and provide audit trails demonstrating compliance with regulatory expectations.

Cross-site investigation coordination capabilities that enable investigation insights from one facility to inform contamination risk assessments and investigation approaches at related manufacturing sites.

Building Organizational Investigation Excellence

Cultural Transformation Requirements

The evolution from compliance-focused contamination investigations toward risk-based contamination control strategies requires fundamental cultural changes that extend beyond procedural updates:

Leadership commitment demonstration through resource allocation for investigation system enhancement, personnel competency development, and technology infrastructure investment that enables comprehensive contamination risk assessment rather than minimal compliance achievement.

Cross-functional collaboration enhancement that breaks down organizational silos preventing comprehensive investigation approaches and ensures investigation teams have access to all relevant operational expertise and information sources.

Continuous improvement mindset development that views contamination investigations as opportunities for systematic facility and process enhancement rather than unfortunate compliance burdens to be minimized.

Investigation as Strategic Asset

Organizations that excel in contamination investigation develop capabilities that provide competitive advantages beyond regulatory compliance:

Process optimization opportunities identification through investigation activities that reveal operational inefficiencies, equipment performance issues, and facility design limitations that, when addressed, improve both contamination control and operational effectiveness.

Risk management capability enhancement that enables proactive identification and mitigation of contamination risks before they result in regulatory scrutiny or product quality issues requiring costly remediation.

Regulatory relationship management through demonstration of investigation competence and commitment to continuous improvement that can influence regulatory inspection frequency and focus areas.

The Cost of Investigation Mediocrity: Lessons from Enforcement

Regulatory Consequences and Business Impact

Rechon’s experience demonstrates the ultimate cost of inadequate contamination investigations: comprehensive regulatory action that threatens market access and operational continuity. The FDA’s requirements for extensive remediation—including independent assessment of investigation systems, comprehensive personnel and environmental monitoring program reviews, and retrospective out-of-specification result analysis—represent exactly the kind of work that should be conducted proactively rather than reactively.

Resource Allocation and Opportunity Cost

The remediation requirements imposed on companies receiving warning letters far exceed the resource investment required for proactive investigation system development:

  • Independent consultant engagement costs for comprehensive facility and system assessment that could be avoided through internal investigation capability development and systematic contamination control strategy implementation.
  • Production disruption resulting from regulatory holds, additional sampling requirements, and corrective action implementation that interrupts normal manufacturing operations and delays product release.
  • Market access limitations including potential product recalls, import restrictions, and regulatory approval delays that affect revenue streams and competitive positioning.

Reputation and Trust Impact

Beyond immediate regulatory and financial consequences, investigation failures create lasting reputation damage that affects customer relationships, regulatory standing, and business development opportunities:

  • Customer confidence erosion when investigation failures become public through warning letters, regulatory databases, and industry communications that affect long-term business relationships.
  • Regulatory relationship deterioration that can influence future inspection focus areas, approval timelines, and enforcement approaches that extend far beyond the original contamination control issues.
  • Industry standing impact that affects ability to attract quality personnel, develop partnerships, and maintain competitive positioning in increasingly regulated markets.

Gap Assessment Framework: Organizational Investigation Readiness

Investigation System Evaluation Criteria

Organizations should systematically assess their investigation capabilities against current regulatory expectations and best practice standards. This assessment encompasses multiple evaluation dimensions:

  • Technical Competency Assessment
    • Do investigation teams possess demonstrated expertise in contamination microbiology, facility design, process engineering, and regulatory requirements?
    • Are investigation methodologies standardized, documented, and consistently applied across different contamination scenarios?
    • Does investigation scope routinely include comprehensive trend analysis, adjacent area assessment, and environmental correlation analysis?
    • Are investigation conclusions supported by scientific rationale and independent technical review?
  • Resource Adequacy Evaluation
    • Are sufficient personnel resources allocated to enable comprehensive investigation completion within reasonable timeframes?
    • Do investigation teams have access to necessary analytical capabilities, reference materials, and technical support resources?
    • Are investigation budgets adequate to support comprehensive data gathering, expert consultation, and corrective action implementation?
    • Does management demonstrate commitment through resource allocation and investigation priority establishment?
  • Integration and Effectiveness Assessment
    • Are investigation findings systematically integrated into contamination control strategy updates and facility risk assessments?
    • Do CAPA systems ensure investigation insights drive systematic improvements rather than isolated fixes?
    • Are investigation outcomes tracked and verified to confirm contamination risk reduction achievement?
    • Do knowledge management systems capture and apply investigation insights across the organization?

From Investigation Adequacy to Investigation Excellence

Rechon Life Science’s experience serves as a cautionary tale about the consequences of investigation mediocrity, but it also illustrates the transformation potential inherent in comprehensive contamination control strategy implementation. When organizations invest in systematic investigation capabilities—encompassing proper team composition, comprehensive analytical approaches, effective knowledge management, and continuous improvement integration—they build competitive advantages that extend far beyond regulatory compliance.

The key insight emerging from regulatory enforcement patterns is that contamination control has evolved from a specialized technical discipline into a comprehensive business capability that affects every aspect of pharmaceutical manufacturing. The quality of an organization’s contamination investigations often determines whether contamination events become learning opportunities that strengthen operations or regulatory nightmares that threaten business continuity.

For quality professionals responsible for contamination control, the message is unambiguous: investigation excellence is not an optional enhancement to existing compliance programs—it’s a fundamental requirement for sustainable pharmaceutical manufacturing in the modern regulatory environment. The organizations that recognize this reality and invest accordingly will find themselves well-positioned not only for regulatory success but for operational excellence that drives competitive advantage in increasingly complex global markets.

The regulatory landscape has fundamentally changed, and traditional approaches to contamination investigation are no longer sufficient. Organizations must decide whether to embrace the investigation excellence imperative or face the consequences of continuing with approaches that regulatory agencies have clearly indicated are inadequate. The choice is clear, but the window for proactive transformation is narrowing as regulatory expectations continue to evolve and enforcement intensifies.

The question facing every pharmaceutical manufacturer is not whether contamination control investigations will face increased scrutiny—it’s whether their investigation systems will demonstrate the excellence necessary to transform regulatory challenges into competitive advantages. Those that choose investigation excellence will thrive; those that don’t will join Rechon Life Science and others in explaining their investigation failures to regulatory agencies rather than celebrating their contamination control successes in the marketplace.

Engineering Runs in the ASTM E2500 Validation Lifecycle

Engineering runs (ERs) represent a critical yet often underappreciated component of modern biopharmaceutical validation strategies. Defined as non-GMP-scale trials that simulate production processes to identify risks and optimize parameters, Engineering Runs bridge the gap between theoretical process design and manufacturing. Their integration into the ASTM E2500 verification framework creates a powerful synergy – combining Good Engineering Practice (GEP) with Quality Risk Management (QRM) to meet evolving regulatory expectations.

When aligned with ICH Q10’s pharmaceutical quality system (PQS) and the ASTM E2500 lifecycle approach, ERs transform from operational exercises into strategic tools for:

  • Design space verification per ICH Q8
  • Scale-up risk mitigation during technology transfer
  • Preparing for operational stability
  • Continuous process verification in commercial manufacturing

ASTM E2500 Framework Primer: The Four Pillars of Modern Verification

ASTM E2500 offers an iterative lifecycle approach to validation:

  1. Requirements Definition
    Subject Matter Experts (SMEs) collaboratively identify critical aspects impacting product quality using QRM tools. This phase emphasizes:
    • Process understanding over checklist compliance
    • Supplier quality systems evaluation
    • Risk-based testing prioritization
  2. Specification & Design
    The standard mandates “right-sized” documentation – detailed enough to ensure product quality without unnecessary bureaucracy.
  3. Verification
    This phase provides a unified verification approach focusing on:
    • Critical process parameters (CPPs)
    • Worst-case scenario testing
    • Leveraging vendor testing data
  4. Acceptance & Release
    Final review incorporates ICH Q10’s management responsibilities, ensuring traceability from initial risk assessments to verification outcomes.

Engineering runs serve as a critical bridge between design verification and formal Process Performance Qualification (PPQ). ERs validate critical aspects of manufacturing systems by confirming:

  1. Equipment functionality under simulated GMP conditions
  2. Process parameter boundaries for Critical Process Parameters (CPPs)
  3. Facility readiness through stress-testing utilities, workflows, and contamination controls
 Demonstration/ Training Run prior to GMP areaShakedown. Demonstration/Training Run in GMP areaEngineering RuncGMP Manufacturing
Room and Equipment
RoomN/AIOQ Post-ApprovalReleased and Active
Process GasGeneration and Distribution Released Point of use assembly PQ complete
Process utility
Process EquipmentFunctionally verified or calibrated as required (commissioned)IOQ ApprovedFull released
Analytical EquipmentReleased
AlarmsN/AAlarm ranges and plan definedAlarms qualified
Raw Materials
Bill of MaterialsRM in progressApproved
SuppliersApproval in ProgressApproved
SpecificationsIn DraftEffective
ReleaseNon-GMP Usage decisionReleased
Process Documentation
Source DocumentationTo be defined in Tech Transfer PlanEngineering Run ProtocolTech Transfer closed
Batch Records and product specific Work InstructionsDraftReviewed DraftApproved
Process and Equipment SOPsN/ADraftEffective
Product LabelsN/ADraft LabelsApproved Labels
QC Testing and Documentation
BSC and Personnel Environmental MonitoringN/AEffective
Analytical MethodsSuitable for usePhase Appropriate Validation
StabilityN/AIn place
Certificate of AnalysisN/ADefined in Engineering ProtocolEffective
Sampling PlanDraftDraft use as defined in engineering protocolEffective
Operations/Execution
Operator TrainingObserve and perform operations to gain hands on experience with SME observationProcess specific equipment OJT Gown qualifiedBSC OJT Aseptic OJT Material Transfer OJT (All training in eQMS)Training in Use
Process LockAs defined in Tech Transfer Plan6-week prior to executionApproved Process Description
DeviationsN/AN/AProcess – Per Engineering Run protocol FUSE – per SOPPer SOP
Final DispositionN/AN/ANot for Human UsePer SOP
OversitePP&DMS&TQA on the floor and MS&T as necessary