I think folks tend to fall into a trap when it comes to equipment and GAMP5, automatically assuming that because it is equipment it must be Category 3. Oh, how that can lead to problems.
When thinking about equipment it is best to think in terms of “No Configuration” and ” Low Configuration” software. This terminology is used to describe software that requires little to no configuration or customization to meet the user’s needs.
No Configuration(NoCo) aligns with GAMP 5 Category 3 software, which is described as “Non-Configured Products”. These are commercial off-the-shelf software applications that are used as-is, without any customization or with only minimal parameter settings. My microwave is NoCo.
Low Configuration(LoCo) typically falls between Category 3 and Category 4 software. It refers to software that requires some configuration, but not to the extent of fully configurable systems. My PlayStation is LoCo.
The distinction between these categories is important for determining the appropriate validation approach:
Category 3 (NoCo) software generally requires less extensive validation efforts, as it is used without significant modifications. Truly it can be implicit testing.
Software with low configuration may require a bit more scrutiny in validation, but still less than fully configurable or custom-developed systems.
Remember that GAMP 5 emphasizes a continuum approach rather than strict categorization. The level of validation effort should be based on the system’s impact on patient safety, product quality, and data integrity, as well as the extent of configuration or customization.
When is Something Low Configuration?
Low Configuration refers to software that requires minimal setup or customization to meet user needs, falling between Category 3 (Non-Configured Products) and Category 4 (Configured Products) software. Here’s a breakdown of what counts as low configuration:
Parameter settings: Software that allows basic parameter adjustments without altering core functionality.
Limited customization: Applications that permit some tailoring to specific workflows, but not extensive modifications.
Standard modules: Software that uses pre-built, configurable modules to adapt to business processes.
Default configurations: Systems that can be used with supplier-provided default settings or with minor adjustments.
Simple data input: Applications that allow input of specific data or ranges, such as electronic chart recorders with input ranges and alarm setpoints.
Basic user interface customization: Software that allows minor changes to the user interface without altering underlying functionality.
Report customization: Systems that permit basic report formatting or selection of data fields to display.
Simple workflow adjustments: Applications that allow minor changes to predefined workflows without complex programming.
It’s important to note that the distinction between low configuration and more extensive configuration (Category 4) can sometimes be subjective. The key is to assess the extent of configuration required and its impact on the system’s core functionality and GxP compliance. Organizations should document their rationale for categorization in system risk assessments or validation plans.
Attribute
Category 3 (No Configuration)
Low Configuration
Category 4
Configuration Level
No configuration
Minimal configuration
Extensive configuration
Parameter Settings
Fixed or minimal
Basic adjustments
Complex adjustments
Customization
None
Limited
Extensive
Modules
Pre-built, non-configurable
Standard, slightly configurable
Highly configurable
Default Settings
Used as-is
Minor adjustments
Significant modifications
Data Input
Fixed format
Simple data/range input
Complex data structures
User Interface
Fixed
Basic customization
Extensive customization
Workflow Adjustments
None
Minor changes
Significant alterations
User Account Management
Basic, often single-user
Limited user roles and permissions
Advanced user management with multiple roles and access levels
Report Customization
Pre-defined reports
Basic formatting/field selection
Advanced report design
Example Equipment
pH meter
Electronic chart recorder
Chromatography data system
Validation Effort
Minimal
Moderate
Extensive
Risk Level
Low
Low to Medium
Medium to High
Supplier Documentation
Heavily relied upon
Partially relied upon
Supplemented with in-house testing
Here’s the thing to be aware of, a lot of equipment these days is more category 4 than 3, as the manufacturers include all sorts of features, such as user account management and trending and configurable reports. And to be frank, I’ve seen too many situations where Programmable Logic Controllers (PLCs) didn’t take into account all that configuration from standard function libraries to control specific manufacturing processes.
Your methodology needs to keep up with the technological growth curve.
I hasn’t been difficult to notice that a whole lot of biological new drug applications have been rejected in the last few years, many for CMC reasons. Recently CDER Director Patrizia Cavazzoni spoke on the matter at a recent at a Duke University and FDA event at the National Press Club iin the video above.
“Our standards have not changed. We have exactly the same standards as we had in 2018 and 2019,” she said, before going on to talk about how the quality related issues the FDA is seeing: contamination, overall oversight, manufacturing controls or insufficient quality management systems.
Max Van Tassell, a senior pharmaceutical quality assessor in CDER’s Office of Pharmaceutical Quality, provided insights from analyzing 100 complete response letters (CRLs) for Biologics License Applications (BLAs) issued between 2014 and 2024. He noted that facility-related deficiencies in CRLs typically stem from inadequate demonstration that proposed corrective and preventive actions would effectively mitigate risks identified during on-site inspections.
It should be a key takeaway from this presentation that:
A colleague asks “In the era of digitalization and electronic signatures, do you believe in continuing to collect wet ink signature as part of employee training file? Can Part 11 electronic signature be used as an attestation that electronic signature is legally binding as handwritten signature?”
Great question. Collecting wet signatures is a real pain. Transitioning to digital practices can also significantly streamline our processes. It seems like a win-win. What could go wrong?
First, let’s ask “just how digital are you?”. It is essential to inventory your various practices and determine what is what. I think there are several categories here:
Starts as paper, retained as paper
It starts as paper and is retained as electronic. For example, you might print a form, fill it out, and route it through DocuSign or your eDMS for approval.
Starts as electronic, retained as paper
The entire lifecycle is electronic.
Most pharmaceutical companies are in a weird situation where we do a lot of work, starting on paper, scanning it, and then approving it. This is especially true at virtual companies, where a lot of the action happens at a CxO.
Do that inventory because you probably have more paper than you think—lots of paper. Plus, having an inventory will allow you to decide on future steps.
Before we get to the solution, let’s look at the regulatory requirements.
A is for Attributable (that’s good enough for me)
First Principle: Records should be signed and dated using a unique identifier attributable to the author. (PIC/S Data Integrity Guidance 8.6.1 Expectation 4.)
The guidance then goes on to say, “Check that there are signature and initials logs that are controlled and current and that demonstrate the use of unique examples, not just standardized printed letters.”
Second Principle: Persons using electronic signatures shall, prior to or at the time of such use, certify to the agency that the electronic signatures in their system, used on or after August 20, 1997, are intended to be the legally binding equivalent of traditional handwritten signatures. (21CFR11.100(c))
To comply with 21 CFR 11.100(c), organizations must:
Prepare a Certification Letter: Draft a letter to the FDA certifying that the electronic signatures used in their system are legally binding.
Submit the Certification: Send the certification letter to the FDA.
Maintain Records: For future reference, keep a copy of the certification letter in the organization’s regulatory information management system (RIM) or quality management system (QMS) records.
Keep Individual Records: Everyone should affirm that the electronic signature used across systems is binding.
Be Prepared for Requests: Be ready to provide additional certification or testimony if the FDA requests. Like, say, an inspection.
This regulation ensures that electronic signatures are treated with the same level of trust and legal standing as traditional handwritten signatures, thereby supporting the integrity and reliability of electronic records in FDA-regulated industries.
Third Principle: The FDA lives within a constellation of other laws
Individual employees generally do not need to provide a wet signature attesting to the legally binding nature of an electronic signature. However, there are some important considerations:
Legal validity: Electronic signatures are legally binding in the United States under the ESIGN Act and UETA, provided certain conditions are met.
Intent and consent: Two critical elements for a legally binding electronic signature are:
Intent to sign
Consent to do business electronically
Best practices for employers:
Implement a uniform policy on how employees sign agreements and onboarding documents.
Consider using two-factor verification for electronic signatures to provide additional proof of authenticity.
Ensure clear labeling of buttons and boxes for electronic signatures.
Include a consent clause for electronic transactions.
Provide an opt-out option for those unable to sign electronically.
While employees generally don’t need to provide a wet signature attesting to the legally binding nature of an electronic signature, employers should ensure their electronic signature process demonstrates intent and consent.
What to do
If your inventory showed everything is electronic, great. Get that attestation from the user as part of new hire orientation, and you are good to go. That attestation can be electronic. It just needs to be quickly retrievable in a way to answer an inspection.
If the inventory showed any paper, then yes, keep collecting those signature/initial logs.
Occasionally the FDA writes a Warning Letter that is a succinct lesson in what is important about a quality system. In this Warning Letter they masterfully describe what a CAPA Program is. As this one further describes how to deal with an inadequate cleaning program it is near and dear to my heart.
I’ve seen my fair share of risk assessments listing data quality or bias as hazards. I tend to think that is pretty sloppy. I especially see this a lot in conversations around AI/ML. Data quality is not a risk. It is a causal factor in the failure or severity.
Data Quality and Data Bias
Data Quality
Data quality refers to how well a dataset meets certain criteria that make it fit for its intended use. The key dimensions of data quality include:
Accuracy – The data correctly represents the real-world entities or events it’s supposed to describe.
Completeness – The dataset contains all the necessary information without missing values.
Consistency – The data is uniform and coherent across different systems or datasets.
Timeliness – The data is up-to-date and available when needed.
Validity – The data conforms to defined business rules and parameters.
Uniqueness – There are no duplicate records in the dataset.
High-quality data is crucial for making informed quality decisions, conducting accurate analyses, and developing reliable AI/ML models. Poor data quality can lead to operational issues, inaccurate insights, and flawed strategies.
Data Bias
Data bias refers to systematic errors or prejudices present in the data that can lead to inaccurate or unfair outcomes, especially in machine learning and AI applications. Some common types of data bias include:
Sampling bias – When the data sample doesn’t accurately represent the entire population.
Selection bias – When certain groups are over- or under-represented in the dataset.
Reporting bias – When the frequency of events in the data doesn’t reflect real-world frequencies.
Measurement bias – When the data collection method systematically skews the results.
Algorithmic bias – When the algorithms or models introduce biases in the results.
Data bias can lead to discriminatory outcomes and produce inaccurate predictions or classifications.
Relationship between Data Quality and Bias
While data quality and bias are distinct concepts, they are closely related:
Poor data quality can introduce or exacerbate biases. For example, incomplete or inaccurate data may disproportionately affect certain groups.
High-quality data doesn’t necessarily mean unbiased data. A dataset can be accurate, complete, and consistent but still contain inherent biases.
Addressing data bias often involves improving certain aspects of data quality, such as completeness and representativeness.
Organizations must implement robust data governance practices to ensure high-quality and unbiased data, regularly assess their data for quality issues and potential biases, and use techniques like data cleansing, resampling, and algorithmic debiasing.
Identifying the Hazards and the Risks
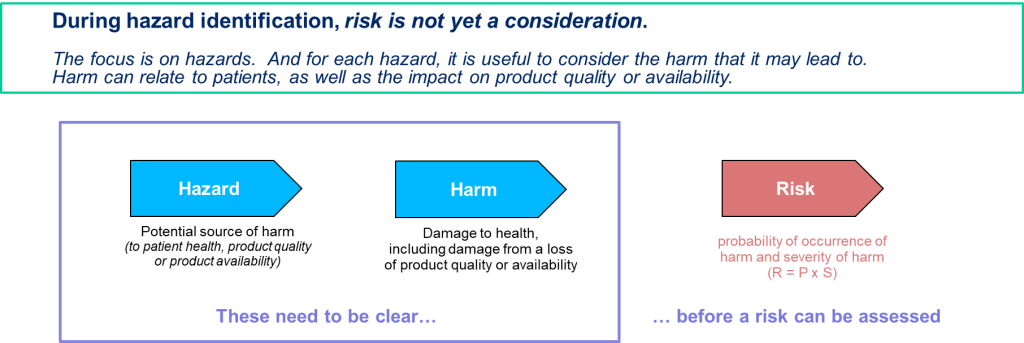
It is critical to remember the difference between a hazard and a risk. Data quality is a causal factor in the hazard, not a harm.
Think of it like a fever. An open wound is a causal factor for the fever, which has a root cause of poor wound hygiene. I can have the factor (the wound), but without the presence of the root cause (poor wound hygiene), the event (fever) would not develop (okay, there may be other root causes in play as well; remember there is never really just one root cause).
Potential Issues of Poor Data Quality and Inadequate Data Governance
The risks associated with poor data quality and inadequate data governance can significantly impact organizations. Here are the key areas where risks can develop:
Decreased Data Quality
Inaccurate, incomplete, or inconsistent data leads to flawed decision-making
Errors in customer information, product details, or financial data can cause operational issues
Poor quality data hinders effective analysis and forecasting
Compliance Failures:
Non-compliance with regulations can result in regulatory actions
Legal complications and reputational damage from failing to meet regulatory requirements
Increased scrutiny from regulatory bodies
Security Breaches
Inadequate data protection increases vulnerability to cyberattacks and data breaches
Financial costs associated with breach remediation, legal fees, and potential fines
Loss of customer trust and long-term reputational damage
Operational Inefficiencies
Time wasted on manual data cleaning and correction
Reduced productivity due to employees working with unreliable data
Inefficient processes resulting from poor data integration or inconsistent data formats
Missed Opportunities
Failure to identify market trends or customer insights due to unreliable data
Missed sales leads or potential customers because of inaccurate contact information
Inability to capitalize on business opportunities due to lack of trustworthy data
Poor Decision-Making
Decisions based on inaccurate or incomplete data leading to suboptimal outcomes, including deviations and product/study impact
Misallocation of resources due to flawed insights from poor quality data
Inability to effectively measure and improve performance
Potential Issues of Data Bias
Data bias presents significant risks across various domains, particularly when integrated into machine learning (ML) and artificial intelligence (AI) systems. These risks can manifest in several ways, impacting both individuals and organizations.
Discrimination and Inequality
Data bias can lead to discriminatory outcomes, systematically disadvantaging certain groups based on race, gender, age, or socioeconomic status. For example:
Judicial Systems: Biased algorithms used in risk assessments for bail and sentencing can result in harsher penalties for people of color compared to their white counterparts, even when controlling for similar circumstances.
Healthcare: AI systems trained on biased medical data may provide suboptimal care recommendations for minority groups, potentially exacerbating health disparities.
Erosion of Trust and Reputation
Organizations that rely on biased data for decision-making risk losing the trust of their customers and stakeholders. This can have severe reputational consequences:
Customer Trust: If customers perceive that an organization’s AI systems are biased, they may lose trust in the brand, leading to a decline in customer loyalty and revenue.
Reputation Damage: High-profile cases of AI bias, such as discriminatory hiring practices or unfair loan approvals, can attract negative media attention and public backlash.
Legal and Regulatory Risks
There are significant legal and regulatory risks associated with data bias:
Compliance Issues: Organizations may face legal challenges and fines if their AI systems violate anti-discrimination laws.
Regulatory Scrutiny: Increasing awareness of AI bias has led to calls for stricter regulations to ensure fairness and accountability in AI systems.
Poor Decision-Making
Biased data can lead to erroneous decisions that negatively impact business operations:
Operational Inefficiencies: AI models trained on biased data may make poor predictions, leading to inefficient resource allocation and operational mishaps.
Financial Losses: Incorrect decisions based on biased data can result in financial losses, such as extending credit to high-risk individuals or mismanaging inventory.
Amplification of Existing Biases
AI systems can perpetuate and even amplify existing biases if not properly managed:
Feedback Loops: Biased AI systems can create feedback loops where biased outcomes reinforce the biased data, leading to increasingly skewed results over time.
Entrenched Inequities: Over time, biased AI systems can entrench societal inequities, making it harder to address underlying issues of discrimination and inequality.
Ethical and Moral Implications
The ethical implications of data bias are profound:
Fairness and Justice: Biased AI systems challenge the principles of fairness and justice, raising moral questions about using such technologies in critical decision-making processes.
Human Rights: There are concerns that biased AI systems could infringe on human rights, particularly in areas like surveillance, law enforcement, and social services.
Perform the Risk Assessment
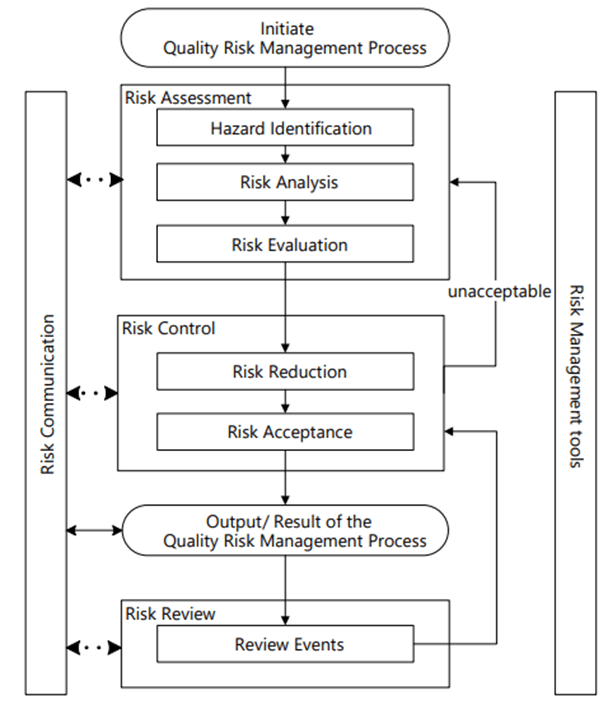
ICH Q9 (r1) Risk Management Process
Risk Management happens at the system/process level, where an AI/ML solution will be used. As appropriate, it drills down to the technology level. Never start with the technology level.
Hazard Identification
It is important to identify product quality hazards that may ultimately lead to patient harm. What is the hazard of that bad decision? What is the hazard of bad quality data? Those are not hazards; they are causes.
Hazard identification, the first step of a risk assessment, begins with a well-defined question defining why the risk assessment is being performed. It helps define the system and the appropriate scope of what will be studied. It addresses the “What might go wrong?” question, including identifying the possible consequences of hazards. The output of the hazard identification step is the identification of the possibilities (i.e., hazards) that the risk event (e.g., impact to product quality) happens.
The risk question takes the form of “What is the risk of using AI/ML solution for <Process/System> to <purpose of AI/MIL solution.” For example, “What is the risk of using AI/ML to identify deviation recurrence and help prioritize CAPAs?” or “What is the risk of using AI/ML to monitor real-time continuous manufacturing to determine the need to evaluate for a potential diversion?”
We can now identify the specific failure modes associated with AI/ML. This may involve deeep dive risk assessments. A failure mode is the specific way a failure occurs. So in this case, the specific way that bad data or bad decision making can happen. Multiple failure modes can, and usually do, lead to the same hazardous situation.
Make sure you drill down on failure causes. If more than 5 potential causes can be identified for a proposed failure mode, it is too broad and probably written at a high level in the process or item being risk assessed. It should be broken down into several specific failure modes with fewer potential causes and more manageable.
Start with an outline of how the process works and a description of the AI/ML (special technology) used in the process. Then, interrogate the following for potential failure modes:
The steps in the process or item under study in which AI/ML interventions occur;
The process/procedure documentation for example, master batch records, SOPs, protocols, etc.
Current and proposed process/procedure in sufficient detail to facilitate failure mode identification;