The Importance of a Quality Plan

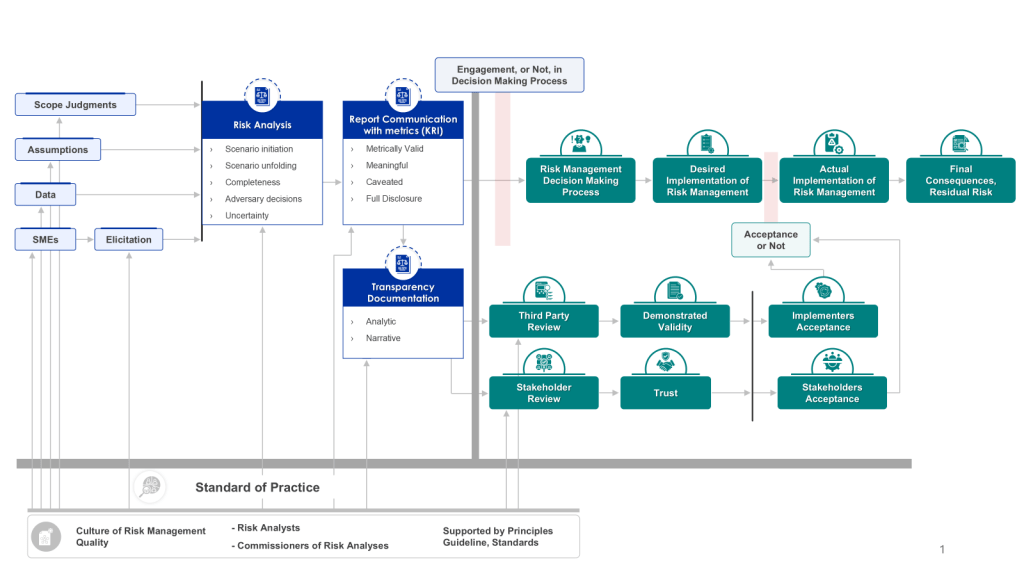
In the ever-evolving landscape of pharmaceutical manufacturing, quality management has become a cornerstone of success. Two key frameworks guiding this pursuit of excellence are the ICH Q10 Pharmaceutical Quality System and the FDA’s Quality Management Maturity (QMM) program. At the heart of these initiatives lies the quality plan – a crucial document that outlines an organization’s approach to ensuring consistent product quality and continuous improvement.

What is a Quality Plan?

A quality plan serves as a roadmap for achieving quality objectives and ensuring that all stakeholders are aligned in their pursuit of excellence.

Key components of a quality plan typically include:

  1. Organizational objectives to drive quality
  2. Steps involved in the processes
  3. Allocation of resources, responsibilities, and authority
  4. Specific documented standards, procedures, and instructions
  5. Testing, inspection, and audit programs
  6. Methods for measuring achievement of quality objectives

Aligning with ICH Q10 Management Responsibilities

ICH Q10 provides a model for an effective pharmaceutical quality system that goes beyond the basic requirements of Good Manufacturing Practice (GMP). To meet ICH Q10 management responsibilities, a quality plan should address the following areas:

1. Management Commitment

The quality plan should clearly articulate top management’s commitment to quality. This includes allocating necessary resources, participating in quality system oversight, and fostering a culture of quality throughout the organization.

2. Quality Policy and Objectives

Align your quality plan with your organization’s overall quality policy. Define specific, measurable quality objectives that support the broader goals of quality realization, establishing and maintaining a state of control, and facilitating continual improvement.

3. Planning

Outline the strategic approach to quality management, including how quality considerations are integrated into product lifecycle stages from development through to discontinuation.

4. Resource Management

Detail how resources (human, financial, and infrastructural) will be allocated to support quality initiatives. This includes provisions for training and competency development of personnel.

5. Management Review

Establish a process for regular management review of the quality system’s performance. This should include assessing the need for changes to the quality policy, objectives, and other elements of the quality system.

Aligning with FDA’s Quality Management Maturity Model

The FDA’s QMM program aims to encourage pharmaceutical manufacturers to go beyond basic compliance and foster a culture of quality and continuous improvement. To align your quality plan with QMM principles, consider incorporating the following elements:

1. Quality Culture

Describe how your organization will foster a strong quality culture mindset. This includes promoting open communication, encouraging employee engagement in quality initiatives, and recognizing quality-focused behaviors.

2. Continuous Improvement

Detail processes for identifying areas where quality management practices can be enhanced. This might include regular assessments, benchmarking against industry best practices, and implementing improvement projects.

3. Risk Management

Outline a proactive approach to risk management that goes beyond basic compliance. This should include processes for identifying, assessing, and mitigating risks to product quality and supply chain reliability.

4. Performance Metrics

Define key performance indicators (KPIs) that will be used to measure and monitor quality performance. These metrics should align with the FDA’s focus on product quality, patient safety, and supply chain reliability.

5. Knowledge Management

Describe systems and processes for capturing, sharing, and utilizing knowledge gained throughout the product lifecycle. This supports informed decision-making and continuous improvement.
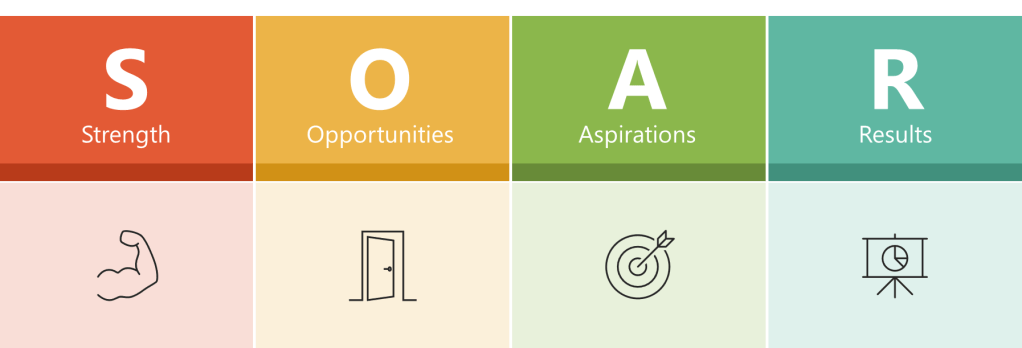
The SOAR Analysis

A SOAR Analysis is a strategic planning framework that focuses on an organization’s positive aspects and future potential. The acronym SOAR stands for Strengths, Opportunities, Aspirations, and Results.

Key Components

  1. Strengths: This quadrant identifies what the organization excels at, its assets, capabilities, and greatest accomplishments.
  2. Opportunities: This section explores external circumstances, potential for growth, and how challenges can be reframed as opportunities.
  3. Aspirations: This part focuses on the organization’s vision for the future, dreams, and what it aspires to achieve.
  4. Results: This quadrant outlines the measurable outcomes that will indicate success in achieving the organization’s aspirations.

Characteristics and Benefits

  • Positive Focus: Unlike SWOT analysis, SOAR emphasizes strengths and opportunities rather than weaknesses and threats.
  • Collaborative Approach: It engages stakeholders at all levels of the organization, promoting a shared vision.
  • Action-Oriented: SOAR is designed to guide constructive conversations and lead to actionable strategies.
  • Future-Focused: While addressing current strengths and opportunities, SOAR also projects a vision for the future.

Application

SOAR analysis is typically conducted through team brainstorming sessions and visualized using a 2×2 matrix. It can be applied to various contexts, including business strategy, personal development, and organizational change.

By leveraging existing strengths and opportunities to pursue shared aspirations and measurable results, SOAR analysis provides a framework for positive organizational growth and strategic planning.

The SOAR Analysis for Quality Plan Writing

Utilizing a SOAR (Strengths, Opportunities, Aspirations, Results) analysis can be an effective approach to drive the writing of a quality plan. This strategic planning tool focuses on positive aspects and future potential, making it particularly useful for developing a forward-looking quality plan. Here’s how you can leverage SOAR analysis in this process:

Conducting the SOAR Analysis

Strengths

Begin by identifying your organization’s current strengths related to quality. Consider:

  • Areas where your organization excels in quality management
  • Significant quality-related accomplishments
  • Unique quality offerings that set you apart from competitors

Ask questions like:

  • What are our greatest quality-related assets and capabilities?
  • Where do we consistently meet or exceed quality standards?

Opportunities

Next, explore external opportunities that could enhance your quality initiatives. Look for:

  • Emerging technologies that could improve quality processes
  • Market trends that emphasize quality
  • Potential partnerships or collaborations to boost quality efforts

Consider:

  • How can we leverage external circumstances to improve our quality?
  • What new skills or resources could elevate our quality standards?

Aspirations

Envision your preferred future state for quality in your organization. This step involves:

  • Defining what you want to be known for in terms of quality
  • Aligning quality goals with overall organizational vision

Ask:

  • What is our ideal quality scenario?
  • How can we integrate quality excellence into our long-term strategy?

Results

Finally, determine measurable outcomes that will indicate success in your quality initiatives. This includes:

  • Specific, quantifiable quality metrics
  • Key performance indicators (KPIs) for quality improvement
  • Key behavior indicators (KBIs) and Key risk indicators (KRIs)

Consider:

  • How will we measure progress towards our quality goals?
  • What tangible results will demonstrate our quality aspirations have been achieved?

Writing the Quality Plan

With the SOAR analysis complete, use the insights gained to craft your quality plan:

  1. Executive Summary: Provide an overview of your quality vision, highlighting key strengths and opportunities identified in the SOAR analysis.
  2. Quality Objectives: Translate your aspirations into concrete, measurable objectives. Ensure these align with the strengths and opportunities identified.
  3. Strategic Initiatives: Develop action plans that leverage your strengths to capitalize on opportunities and achieve your quality aspirations. For each initiative, specify:
    • Resources required
    • Timeline for implementation
    • Responsible parties
  4. Performance Metrics: Establish a system for tracking the results identified in your SOAR analysis. Include both leading and lagging indicators of quality performance.
  5. Continuous Improvement: Outline processes for regular review and refinement of the quality plan, incorporating feedback and new insights as they emerge.
  6. Resource Allocation: Based on the strengths and opportunities identified, detail how resources will be allocated to support quality initiatives.
  7. Training and Development: Address any skill gaps identified during the SOAR analysis, outlining plans for employee training and development in quality-related areas.
  8. Risk Management: While SOAR focuses on positives, acknowledge potential challenges and outline strategies to mitigate risks to quality objectives.

By utilizing the SOAR analysis framework, your quality plan will be grounded in your organization’s strengths, aligned with external opportunities, inspired by aspirational goals, and focused on measurable results. This approach ensures a positive, forward-looking quality strategy that engages stakeholders and drives continuous improvement.

A well-crafted quality plan serves as a bridge between regulatory requirements, industry best practices, and an organization’s specific quality goals. By aligning your quality plan with ICH Q10 management responsibilities and the FDA’s Quality Management Maturity model, you create a robust framework for ensuring product quality, fostering continuous improvement, and building a resilient, quality-focused organization.

Scale of Remediation Under a Consent Decree

The recent Sanofi Warning Letter certainly gets me thinking about the work of a consent decree and the scale and ‘stickiness‘ within an organization.

Scale of Remediation

In the Sanofi-Genzyme consent decree there were these concentric circles of required activities. At the center was the plant the issue was discovered, the Allston Landing Facility, which had the full brunt of remediation.

The next level out were the plants in Framingham and Northborough. They had remediation actions to be done, including reduced third party oversight for critical activities for a more limited time. The consent decree was on a much reduced scale at these sites.

The next level out was the former Genzyme sites beyond the Massachusetts core. They did alignment to the new standards created as part of the consent decree. Finally the rest of Sanofi, after Sanofi bought Genzyme, pretty much ignored it.

This balkanization meant that the culture across the organization never really changed. The cultural resistance of the site/silos fostered a culture of “us vs. them” mentality within the organization. Without a unified organizational culture, it is much harder to implement and maintain changes across the entire company.

The Slippery Slope: How Quality Improvements Can Erode Over Time

The erosion of quality culture at Sanofi demonstrated by this new Warning Letter isn’t unique to this case. Even when quality improvement initiatives are launched with great enthusiasm and initial success it is not uncommon for these hard-won gains to gradually erode over time, leaving organizations back where they started or even worse off. This phenomenon of “quality backsliding” can be frustrating and costly.

Why Quality Improvements Fade

There are several reasons why quality improvements may deteriorate over time:

Leadership Changes: When key champions of quality initiatives leave or change roles, their successors may not prioritize maintaining those improvements. New leaders often want to make their own mark, potentially abandoning or de-emphasizing existing quality programs.

Budget Cuts: In times of financial pressure, quality improvement efforts are often seen as “nice to have” rather than essential. Resources dedicated to sustaining improvements may be reallocated, leading to a gradual decline in performance.

Complacency: Initial success can breed complacency. Once targets are met, there may be less motivation to continue pushing for further improvements or even maintaining current standards.

Loss of Focus: As new priorities emerge, attention and resources can shift away from quality initiatives. Without ongoing commitment, processes can slowly revert to old, less effective ways of working.

Lack of Standardization: If improvements aren’t fully standardized and integrated into daily operations, they remain dependent on individual efforts rather than becoming part of the organizational culture.

PQS Efficiency – Is Efficiency Good?

I do love a house metaphor or visualization, almost as I like a good tree, and this visualization of the house of quality is one I often return to. I want to turn to the question of efficiency, as it is often one I hear stressed by many leaders, and frankly I think the use can get a little off-kilter.

We can define efficiency as the “productivity of a process and the utilization of resources.” The St Gallen reports commissioned by the FDA as part of the quality metrics initiative finds that efficiency and effectiveness in pharmaceutical quality systems are positively correlated, though the relationship is not as strong as some may expect.

The study analyzed data from over 60 pharmaceutical manufacturing plants found a slight positive correlation between measures of quality system effectiveness and efficiency. This indicates that plants with more effective quality systems also tend to be more efficient in their operations. However, effectiveness only explained about 4% of the variation in efficiency scores, suggesting other factors play a major role as well.

To dig deeper, the researchers separated plants into four groups based on their levels of quality effectiveness and efficiency. The top performing group excelled in both areas, while the lowest group struggled with both. Interestingly, there were also groups that performed well in one area but not the other. This reveals that effectiveness and efficiency, while related, are distinct capabilities that must be built separately.

What really set apart the top performers was their higher implementation of operational excellence practices across areas like total productive maintenance, quality management, and just-in-time production. They also tended to have more empowered employees and a stronger culture of continuous improvement. This suggests that building these foundational capabilities is key to achieving both quality and efficiency.

The research provides evidence that quality and efficiency can be mutually reinforcing when the right systems and culture are in place. However, it also shows this is not automatic – companies must be intentional about developing both in tandem. Those that focus solely on efficiency without building quality maturity may struggle to sustain performance in the long run. The most successful manufacturers find ways to make quality a driver of operational excellence, not a constraint on it.

Dangers of an Excessive Focus on Efficiency

An excessive focus on efficiency in organizations can further lead to several unintended negative consequences:

Reduced Resilience and Flexibility

Prioritizing efficiency often involves streamlining processes, reducing redundancies, and optimizing resource allocation. While this can boost short-term productivity, it can also make organizations less resilient to unexpected disruptions.

Stifled Innovation and Creativity

Efficiency-driven environments tend to emphasize standardization and predictability, which can hinder innovation. When resources are tightly controlled and risk-aversion is high, there’s little room for experimentation and creative problem-solving. This can leave companies vulnerable to being outpaced by more innovative competitors.

Employee Burnout and Disengagement

Pushing for ever-increasing efficiency can lead to work environments where employees are constantly pressured to do more with less. This approach can increase stress levels, leading to burnout, reduced morale, and ultimately, lower overall productivity. Overworked employees may struggle with work-life balance and experience health issues, potentially resulting in higher turnover rates.

Compromised Quality

There’s often a delicate balance between efficiency and quality. In the pursuit of faster and cheaper ways of doing things, organizations may inadvertently compromise on product or service quality. Over time, this can erode brand reputation and customer loyalty.

Short-term Focus at the Expense of Long-term Success

An overemphasis on efficiency can lead to a myopic focus on short-term gains while neglecting long-term strategic objectives. This can result in missed opportunities for sustainable growth and innovation.

Resource Dilution and Competing Priorities

When organizations try to be efficient across too many initiatives simultaneously, it can lead to resource dilution. This often results in many projects being worked on, but few being completed effectively or on time. Competing priorities can also lead to different departments working at cross-purposes, potentially canceling out each other’s efforts.

Loss of Human Connection and Engagement

Prioritizing task efficiency over human connection can have significant negative impacts on workplace culture and employee engagement. A lack of connection in the workplace can chip away at healthy mindsets and organizational culture.

Reduced Adaptability to Change

Highly efficient systems are often optimized for specific conditions. When those conditions change, such systems may struggle to adapt. This can leave organizations vulnerable in rapidly changing business environments.

To mitigate these risks, organizations should strive for a balance between efficiency and other important factors such as resilience, innovation, and employee well-being. This may involve maintaining some redundancies, allowing for periods of “productive inefficiency,” and fostering a culture that values both productivity and human factors.

Quality and Efficiency

Building efficiency from quality, often referred to as “Good Quality – Good Business”, is best tackled by:

  1. Reduced waste and rework: By focusing on quality, companies can reduce defects, errors, and the need for rework. This directly improves efficiency by reducing wasted time, materials, and labor.
  2. Improved processes: Quality initiatives often involve analyzing and optimizing processes. These improvements can lead to more streamlined operations and better resource utilization.
  3. Enhanced reliability: High-quality products and processes tend to be more reliable. This reliability can reduce downtime, maintenance costs, and other inefficiencies.
  4. Cultural excellence: Organizations with a higher levels of cultural excellence, including employee engagement and continuous improvement mindsets supports both quality and efficiency improvements.

The important thing to remember is efficiency that does not help the worker, that does not build resilience, is not efficiency at all.

Models of Verification

In the pharmaceutical industry, qualification and validation is a critical process to ensure the quality, safety, and efficacy of products. Over the years, several models have emerged to guide efforts for facilities, utilities, systems, equipment, and processes. This blog post will explore three prominent models: the 4Q model, the V-model, and the W-model. We’ll also discuss relevant regulatory guidelines and industry standards.

The 4Q Model

The 4Q model is a widely accepted approach to qualification in the pharmaceutical industry. It consists of four stages:

  1. Design Qualification (DQ): This initial stage focuses on documenting that the design of facilities, systems, and equipment is suitable for the intended purpose. DQ should verify that the proposed design of facilities, systems, and equipment is suitable for the intended purpose. The requirements of the user requirements specification (URS) should be verified during DQ.
  2. Installation Qualification (IQ): IQ verifies that the equipment or system has been properly installed according to specifications. IQ should include verification of the correct installation of components and instrumentation against engineering drawings and specifications — the pre-defined criteria.
  3. Operational Qualification (OQ): This stage demonstrates that the equipment or system operates as intended across the expected operating ranges. OQ should ensure the system is operating as designed, confirming the upper and lower operating limits, and/or “worst case” conditions. Depending on the complexity of the equipment, OQ may be performed as a combined Installation/Operation Qualification (IOQ). The completion of a successful OQ should allow for the finalization of standard operating and cleaning procedures, operator training, and preventative maintenance requirements.
  4. Performance Qualification (PQ): PQ confirms that the equipment or system consistently performs as expected under routine production conditions. PQ should normally follow the successful completion of IQ and OQ, though in some cases, it may be appropriate to perform PQ in conjunction with OQ or Process Validation. PQ should include tests using production materials, qualified substitutes, or simulated products proven to have equivalent behavior under normal operating conditions with worst-case batch sizes. The extent of PQ tests depends on the results from development and the frequency of sampling during PQ should be justified.

The V-Model

The V-model, introduced by the International Society of Pharmaceutical Engineers (ISPE) in 1994, provides a visual representation of the qualification process:

  1. The left arm of the “V” represents the planning and specification phases.
  2. The bottom of the “V” represents the build and unit testing phases.
  3. The right arm represents the execution and qualification phases.

This model emphasizes the relationship between each development stage and its corresponding testing phase, promoting a systematic approach to validation.

The W-Model

The W-model is an extension of the V-model that explicitly incorporates commissioning activities:

  1. The first “V” represents the traditional V-model stages.
  2. The center portion of the “W” represents commissioning activities.
  3. The second “V” represents qualification activities.

This model provides more granularity to what is identified as “verification testing,” including both commissioning (e.g., FAT, SAT) and qualification testing (IQ, OQ, PQ).

Aspect4Q ModelV-ModelW-Model
StagesDQ, IQ, OQ, PQUser Requirements, Functional Specs, Design Specs, IQ, OQ, PQUser Requirements, Functional Specs, Design Specs, Commissioning, IQ, OQ, PQ
FocusSequential qualification stagesLinking development and testing phasesIntegrating commissioning with qualification
FlexibilityModerateHighHigh
Emphasis on CommissioningLimitedLimitedExplicit
Risk-based ApproachCan be incorporatedCan be incorporatedInherently risk-based

Where Qualifcation Fits into the Regulatory Landscape and Industry Guidelines

WHO Guidelines

The World Health Organization (WHO) provides guidance on validation and qualification in its “WHO good manufacturing practices for pharmaceutical products: main principles”. While not explicitly endorsing a specific model, WHO emphasizes the importance of a systematic approach to validation.

EMA Guidelines

The European Medicines Agency (EMA) has published guidelines on process validation for the manufacture of biotechnology-derived active substances and data to be provided in regulatory submissions. These guidelines align with the principles of ICH Q8, Q9, and Q10, promoting a lifecycle approach to validation.

Annex 15 provides guidance on qualification and validation in pharmaceutical manufacturing. Regarding Design Qualification (DQ), Installation Qualification (IQ), Operational Qualification (OQ), and Performance Qualification (PQ) which is pretty much either the V or W model.

Annex 15 emphasizes a lifecycle approach to validation, considering all stages from initial development of the user requirements specification through to the end of use of the equipment, facility, utility, or system. The main stages of qualification and some suggested criteria are indicated as a “could” option, allowing for flexibility in approach.

Annex 15 provides a structured yet flexible approach to qualification, allowing pharmaceutical manufacturers to adapt their validation strategies to the complexity of their equipment and processes while maintaining compliance with regulatory requirements.

FDA Guidance

The U.S. Food and Drug Administration (FDA) issued its “Guidance for Industry: Process Validation: General Principles and Practices” in 2011. This guidance emphasizes a lifecycle approach to process validation, consisting of three stages: process design, process qualification, and continued process verification.

ASTM E2500

ASTM E2500, “Standard Guide for Specification, Design, and Verification of Pharmaceutical and Biopharmaceutical Manufacturing Systems and Equipment,” provides a risk-based approach to validation. It introduces the concept of “verification” as an alternative to traditional qualification steps, allowing for more flexible and efficient validation processes.

ISPE Guidelines

The International Society for Pharmaceutical Engineering (ISPE) has published several baseline guides and good practice guides that complement regulatory requirements. These include guides on commissioning and qualification, as well as on the implementation of ASTM E2500.

Baseline Guide Vol 5: Commissioning & Qualification (Second Edition)

This guide offers practical guidance on implementing a science and risk-based approach to commissioning and qualification (C&Q). Key aspects include:

  • Applying Quality Risk Management to C&Q
  • Best practices for User Requirements Specification, Design Review, Design Qualification, and acceptance/release
  • Efficient use of change management to support C&Q
  • Good Engineering Practice documentation standards

The guide aims to simplify and improve the C&Q process by integrating concepts from regulatory guidances (EMA, FDA, ISO) and replacing certain aspects of previous approaches with Quality Risk Management and Good Engineering Practice concepts.

Conclusion

While the 4Q, V, and W models provide structured approaches to validation, the pharmaceutical industry is increasingly moving towards risk-based and science-driven methodologies. Regulatory agencies and industry organizations are promoting flexible approaches that focus on critical aspects of product quality and patient safety.

By leveraging guidelines such as ASTM E2500 and ISPE recommendations, pharmaceutical companies can develop efficient validation strategies that meet regulatory requirements while optimizing resources. The key is to understand the principles behind these models and guidelines and apply them in a way that best suits the specific needs of each facility, system, or process.

Measuring the Effectiveness of Risk Analysis in Engaging the Risk Management Decision-Making Process

Effective risk analysis is crucial for informed decision-making and robust risk management. Simply conducting a risk analysis is not enough; its effectiveness in engaging the risk management decision-making process is paramount. This effectiveness is largely driven by the transparency and documentation of the analysis, which supports both stakeholder and third-party reviews. Let’s explore how we can measure this effectiveness and why it matters.

The Importance of Transparency and Documentation

Transparency and documentation form the backbone of an effective risk analysis process. They ensure that the methodology, assumptions, and results of the analysis are clear and accessible to all relevant parties. This clarity is essential for:

  1. Building trust among stakeholders
  2. Facilitating informed decision-making
  3. Enabling thorough reviews by internal and external parties
  4. Ensuring compliance with regulatory requirements

Key Metrics for Measuring Effectiveness

To gauge the effectiveness of risk analysis in engaging the decision-making process, consider the following metrics:

1. Stakeholder Engagement Level

Measure the degree to which stakeholders actively participate in the risk analysis process and utilize its outputs. This can be quantified by:

  • Number of stakeholder meetings or consultations
  • Frequency of stakeholder feedback on risk reports
  • Percentage of stakeholders actively involved in risk discussions

2. Decision Influence Rate

Assess how often risk analysis findings directly influence management decisions. Track:

  • Percentage of decisions that reference risk analysis outputs
  • Number of risk mitigation actions implemented based on analysis recommendations

3. Risk Reporting Quality

Evaluate the clarity and comprehensiveness of risk reports. Consider:

  • Readability scores of risk documentation
  • Completeness of risk data presented
  • Timeliness of risk reporting

This is a great place to leverage a rubric.

4. Third-Party Review Outcomes

Analyze the results of internal and external audits or reviews:

  • Number of findings or recommendations from reviews
  • Time taken to address review findings
  • Improvement in review scores over time

5. Risk Analysis Utilization

Measure how frequently risk analysis tools and outputs are accessed and used:

  • Frequency of access to risk dashboards or reports
  • Number of departments utilizing risk analysis outputs
  • Time spent by decision-makers reviewing risk information

Implementing Effective Measurement

To implement these metrics effectively:

  1. Establish Baselines: Determine current performance levels for each metric to track improvements over time.
  2. Set Clear Targets: Define specific, measurable goals for each metric aligned with organizational objectives.
  3. Utilize Technology: Implement risk management software to automate data collection and analysis, improving accuracy and timeliness.
  4. Regular Reporting: Create a schedule for regular reporting of these metrics to relevant stakeholders.
  5. Continuous Improvement: Use the insights gained from these measurements to refine the risk analysis process continually.

Enhancing Transparency and Documentation

To improve the effectiveness of risk analysis through better transparency and documentation:

Standardize Risk Reporting

Develop standardized templates and formats for risk reports to ensure consistency and completeness. This standardization facilitates easier comparison and analysis across different time periods or business units.

Implement a Risk Taxonomy

Create a common language for risk across the organization. A well-defined risk taxonomy ensures that all stakeholders understand and interpret risk information consistently.

Leverage Visualization Tools

Utilize data visualization techniques to present risk information in an easily digestible format. Visual representations can make complex risk data more accessible to a broader audience, enhancing engagement in the decision-making process.

Maintain a Comprehensive Audit Trail

Document all steps of the risk analysis process, including data sources, methodologies, assumptions, and decision rationales. This audit trail is crucial for both internal reviews and external audits.

Foster a Culture of Transparency

Encourage open communication about risks throughout the organization. This cultural shift can lead to more honest and accurate risk reporting, ultimately improving the quality of risk analysis.

Conclusion

Measuring the effectiveness of risk analysis in engaging the risk management decision-making process is crucial for organizations seeking to optimize their risk management strategies. By focusing on transparency and documentation, and implementing key metrics to track performance, organizations can ensure that their risk analysis efforts truly drive informed decision-making and robust risk management.

Remember, the goal is not just to conduct risk analysis, but to make it an integral part of the organization’s decision-making fabric. By continuously measuring and improving the effectiveness of risk analysis, organizations can build resilience, enhance stakeholder trust, and navigate uncertainties with greater confidence.