Reducing Subjectivity in Quality Risk Management: Aligning with ICH Q9(R1)

In a previous post, I discussed how overcoming subjectivity in risk management and decision-making requires fostering a culture of quality and excellence. This is an issue that it is important to continue to evaluate and push for additional improvement.

The revised ICH Q9(R1) guideline, finalized in January 2023, introduces critical updates to Quality Risk Management (QRM) practices, emphasizing the need to address subjectivity, enhance formality, improve risk-based decision-making, and manage product availability risks. These revisions aim to ensure that QRM processes are more science-driven, knowledge-based, and effective in safeguarding product quality and patient safety. Two years later it is important to continue to build on key strategies for reducing subjectivity in QRM and aligning with the updated requirements.

Understanding Subjectivity in QRM

Subjectivity in QRM arises from personal opinions, biases, heuristics, or inconsistent interpretations of risks by stakeholders. This can impact every stage of the QRM process—from hazard identification to risk evaluation and mitigation. The revised ICH Q9(R1) explicitly addresses this issue by introducing a new subsection, “Managing and Minimizing Subjectivity,” which emphasizes that while subjectivity cannot be entirely eliminated, it can be controlled through structured approaches.

The guideline highlights that subjectivity often stems from poorly designed scoring systems, differing perceptions of hazards and risks among stakeholders, and cognitive biases. To mitigate these challenges, organizations must adopt robust strategies that prioritize scientific knowledge and data-driven decision-making.

Strategies to Reduce Subjectivity

Leveraging Knowledge Management

ICH Q9(R1) underscores the importance of knowledge management as a tool to reduce uncertainty and subjectivity in risk assessments. Effective knowledge management involves systematically capturing, organizing, and applying internal and external knowledge to inform QRM activities. This includes maintaining centralized repositories for technical data, fostering real-time information sharing across teams, and learning from past experiences through structured lessons-learned processes.

By integrating knowledge management into QRM, organizations can ensure that decisions are based on comprehensive data rather than subjective estimations. For example, using historical data on process performance or supplier reliability can provide objective insights into potential risks.

To integrate knowledge management (KM) more effectively into quality risk management (QRM), organizations can implement several strategies to ensure decisions are based on comprehensive data rather than subjective estimations:

Establish Robust Knowledge Repositories

Create centralized, easily accessible repositories for storing and organizing historical data, lessons learned, and best practices. These repositories should include:

  • Process performance data
  • Supplier reliability metrics
  • Deviation and CAPA records
  • Audit findings and inspection observations
  • Technology transfer documentation

By maintaining these repositories, organizations can quickly access relevant historical information when conducting risk assessments.

Implement Knowledge Mapping

Conduct knowledge mapping exercises to identify key sources of knowledge within the organization. This process helps to:

Use the resulting knowledge maps to guide risk assessment teams to relevant information and expertise.

Develop Data Analytics Capabilities

Invest in data analytics tools and capabilities to extract meaningful insights from historical data. For example:

  • Use statistical process control to identify trends in manufacturing performance
  • Apply machine learning algorithms to predict potential quality issues based on historical patterns
  • Utilize data visualization tools to present complex risk data in an easily understandable format

These analytics can provide objective, data-driven insights into potential risks and their likelihood of occurrence.

Integrate KM into QRM Processes

Embed KM activities directly into QRM processes to ensure consistent use of available knowledge:

  • Include a knowledge gathering step at the beginning of risk assessments
  • Require risk assessment teams to document the sources of knowledge used in their analysis
  • Implement a formal process for capturing new knowledge generated during risk assessments

This integration helps ensure that all relevant knowledge is considered and that new insights are captured for future use.

Foster a Knowledge-Sharing Culture

Encourage a culture of knowledge sharing and collaboration within the organization:

  • Implement mentoring programs to facilitate the transfer of tacit knowledge
  • Establish communities of practice around key risk areas
  • Recognize and reward employees who contribute valuable knowledge to risk management efforts

By promoting knowledge sharing, organizations can tap into the collective expertise of their workforce to improve risk assessments.

Implementing Structured Risk-Based Decision-Making

The revised guideline introduces a dedicated section on risk-based decision-making, emphasizing the need for structured approaches that consider the complexity, uncertainty, and importance of decisions. Organizations should establish clear criteria for decision-making processes, define acceptable risk tolerance levels, and use evidence-based methods to evaluate options.

Structured decision-making tools can help standardize how risks are assessed and prioritized. Additionally, calibrating expert opinions through formal elicitation techniques can further reduce variability in judgments.

Addressing Cognitive Biases

Cognitive biases—such as overconfidence or anchoring—can distort risk assessments and lead to inconsistent outcomes. To address this, organizations should provide training on recognizing common biases and their impact on decision-making. Encouraging diverse perspectives within risk assessment teams can also help counteract individual biases.

For example, using cross-functional teams ensures that different viewpoints are considered when evaluating risks, leading to more balanced assessments. Regularly reviewing risk assessment outputs for signs of bias or inconsistencies can further enhance objectivity.

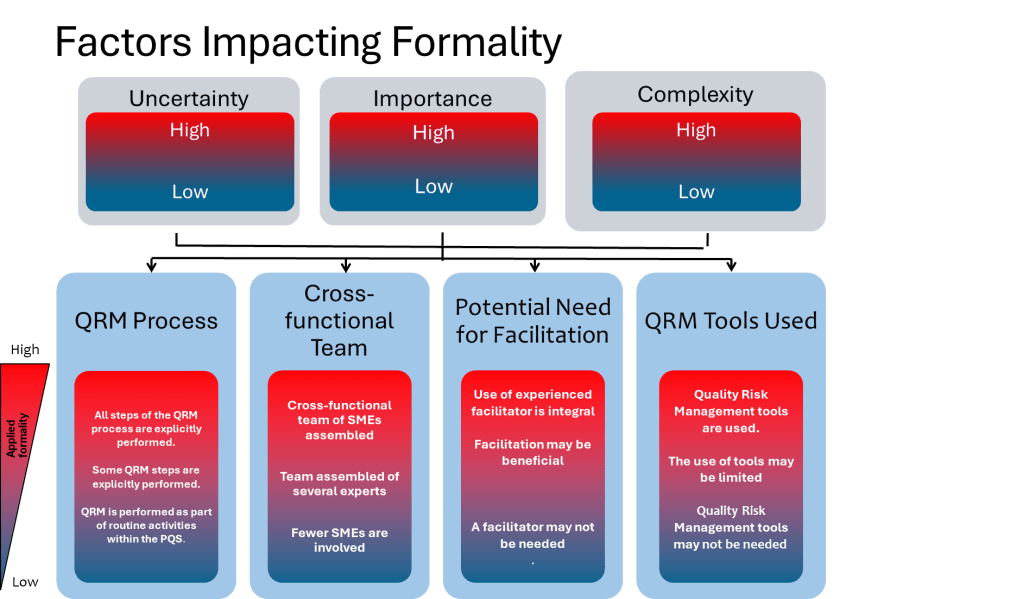
Enhancing Formality in QRM

ICH Q9(R1) introduces the concept of a “formality continuum,” which aligns the level of effort and documentation with the complexity and significance of the risk being managed. This approach allows organizations to allocate resources effectively by applying less formal methods to lower-risk issues while reserving rigorous processes for high-risk scenarios.

For instance, routine quality checks may require minimal documentation compared to a comprehensive risk assessment for introducing new manufacturing technologies. By tailoring formality levels appropriately, organizations can ensure consistency while avoiding unnecessary complexity.

Calibrating Expert Opinions

We need to recognize the importance of expert knowledge in QRM activities, but also acknowledges the potential for subjectivity and bias in expert judgments. We need to ensure we:

  • Implement formal processes for expert opinion elicitation
  • Use techniques to calibrate expert judgments, especially when estimating probabilities
  • Provide training on common cognitive biases and their impact on risk assessment
  • Employ diverse teams to counteract individual biases
  • Regularly review risk assessment outputs for signs of bias or inconsistencies

Calibration techniques may include:

  • Structured elicitation protocols that break down complex judgments into more manageable components
  • Feedback and training to help experts align their subjective probability estimates with actual frequencies of events
  • Using multiple experts and aggregating their judgments through methods like Cooke’s classical model
  • Employing facilitation techniques to mitigate groupthink and encourage independent thinking

By calibrating expert opinions, organizations can leverage valuable expertise while minimizing subjectivity in risk assessments.

Utilizing Cooke’s Classical Model

Cooke’s Classical Model is a rigorous method for evaluating and combining expert judgments to quantify uncertainty. Here are the key steps for using the Classical Model to evaluate expert judgment:

Select and calibrate experts:
    • Choose 5-10 experts in the relevant field
    • Have experts assess uncertain quantities (“calibration questions”) for which true values are known or will be known soon
    • These calibration questions should be from the experts’ domain of expertise
    Elicit expert assessments:
      • Have experts provide probabilistic assessments (usually 5%, 50%, and 95% quantiles) for both calibration questions and questions of interest
      • Document experts’ reasoning and rationales
      Score expert performance:
      • Evaluate experts on two measures:
        a) Statistical accuracy: How well their probabilistic assessments match the true values of calibration questions
        b) Informativeness: How precise and focused their uncertainty ranges are
      Calculate performance-based weights:
        • Derive weights for each expert based on their statistical accuracy and informativeness scores
        • Experts performing poorly on calibration questions receive little or no weight
        Combine expert assessments:
        • Use the performance-based weights to aggregate experts’ judgments on the questions of interest
        • This creates a “Decision Maker” combining the experts’ assessments
        Validate the combined assessment:
        • Evaluate the performance of the weighted combination (“Decision Maker”) using the same scoring as for individual experts
        • Compare to equal-weight combination and best-performing individual experts
        Conduct robustness checks:
        • Perform cross-validation by using subsets of calibration questions to form weights
        • Assess how well performance on calibration questions predicts performance on questions of interest

        The Classical Model aims to create an optimal aggregate assessment that outperforms both equal-weight combinations and individual experts. By using objective performance measures from calibration questions, it provides a scientifically defensible method for evaluating and synthesizing expert judgment under uncertainty.

        Using Data to Support Decisions

        ICH Q9(R1) emphasizes the importance of basing risk management decisions on scientific knowledge and data. The guideline encourages organizations to:

        • Develop robust knowledge management systems to capture and maintain product and process knowledge
        • Create standardized repositories for technical data and information
        • Implement systems to collect and convert data into usable knowledge
        • Gather and analyze relevant data to support risk-based decisions
        • Use quantitative methods where feasible, such as statistical models or predictive analytics

        Specific approaches for using data in QRM may include:

        • Analyzing historical data on process performance, deviations, and quality issues to inform risk assessments
        • Employing statistical process control and process capability analysis to evaluate and monitor risks
        • Utilizing data mining and machine learning techniques to identify patterns and potential risks in large datasets
        • Implementing real-time data monitoring systems to enable proactive risk management
        • Conducting formal data quality assessments to ensure decisions are based on reliable information

        Digitalization and emerging technologies can support data-driven decision making, but remember that validation requirements for these technologies should not be overlooked.

        Improving Risk Assessment Tools

        The design of risk assessment tools plays a critical role in minimizing subjectivity. Tools with well-defined scoring criteria and clear guidance on interpreting results can reduce variability in how risks are evaluated. For example, using quantitative methods where feasible—such as statistical models or predictive analytics—can provide more objective insights compared to qualitative scoring systems.

        Organizations should also validate their tools periodically to ensure they remain fit-for-purpose and aligned with current regulatory expectations.

        Leverage Good Risk Questions

        A well-formulated risk question can significantly help reduce subjectivity in quality risk management (QRM) activities. Here’s how a good risk question contributes to reducing subjectivity:

        Clarity and Focus

        A good risk question provides clarity and focus for the risk assessment process. By clearly defining the scope and context of the risk being evaluated, it helps align all participants on what specifically needs to be assessed. This alignment reduces the potential for individual interpretations and subjective assumptions about the risk scenario.

        Specific and Measurable Terms

        Effective risk questions use specific and measurable terms rather than vague or ambiguous language. For example, instead of asking “What are the risks to product quality?”, a better question might be “What are the potential causes of out-of-specification dissolution results for Product X in the next 6 months?”. The specificity in the latter question helps anchor the assessment in objective, measurable criteria.

        Factual Basis

        A well-crafted risk question encourages the use of factual information and data rather than opinions or guesses. It should prompt the risk assessment team to seek out relevant data, historical information, and scientific knowledge to inform their evaluation. This focus on facts and evidence helps minimize the influence of personal biases and subjective judgments.

        Standardized Approach

        Using a consistent format for risk questions across different assessments promotes a standardized approach to risk identification and analysis. This consistency reduces variability in how risks are framed and evaluated, thereby decreasing the potential for subjective interpretations.

        Objective Criteria

        Good risk questions often incorporate or imply objective criteria for risk evaluation. For instance, a question like “What factors could lead to a deviation from the acceptable range of 5-10% for impurity Y?” sets clear, objective parameters for the assessment, reducing the room for subjective interpretation of what constitutes a significant risk.

        Promotes Structured Thinking

        Well-formulated risk questions encourage structured thinking about potential hazards, their causes, and consequences. This structured approach helps assessors focus on objective factors and causal relationships rather than relying on gut feelings or personal opinions.

        Facilitates Knowledge Utilization

        A good risk question should prompt the assessment team to utilize available knowledge effectively. It encourages the team to draw upon relevant data, past experiences, and scientific understanding, thereby grounding the assessment in objective information rather than subjective impressions.

        By crafting risk questions that embody these characteristics, QRM practitioners can significantly reduce the subjectivity in risk assessments, leading to more reliable, consistent, and scientifically sound risk management decisions.

        Fostering a Culture of Continuous Improvement

        Reducing subjectivity in QRM is an ongoing process that requires a commitment to continuous improvement. Organizations should regularly review their QRM practices to identify areas for enhancement and incorporate feedback from stakeholders. Investing in training programs that build competencies in risk assessment methodologies and decision-making frameworks is essential for sustaining progress.

        Moreover, fostering a culture that values transparency, collaboration, and accountability can empower teams to address subjectivity proactively. Encouraging open discussions about uncertainties or disagreements during risk assessments can lead to more robust outcomes.

        Conclusion

        The revisions introduced in ICH Q9(R1) represent a significant step forward in addressing long-standing challenges associated with subjectivity in QRM. By leveraging knowledge management, implementing structured decision-making processes, addressing cognitive biases, enhancing formality levels appropriately, and improving risk assessment tools, organizations can align their practices with the updated guidelines while ensuring more reliable and science-based outcomes.

        It has been two years, it is long past time be be addressing these in your risk management process and quality system.

        Ultimately, reducing subjectivity not only strengthens compliance with regulatory expectations but also enhances the quality of pharmaceutical products and safeguards patient safety—a goal that lies at the heart of effective Quality Risk Management.

        The Importance of a Quality Plan

        In the ever-evolving landscape of pharmaceutical manufacturing, quality management has become a cornerstone of success. Two key frameworks guiding this pursuit of excellence are the ICH Q10 Pharmaceutical Quality System and the FDA’s Quality Management Maturity (QMM) program. At the heart of these initiatives lies the quality plan – a crucial document that outlines an organization’s approach to ensuring consistent product quality and continuous improvement.

        What is a Quality Plan?

        A quality plan serves as a roadmap for achieving quality objectives and ensuring that all stakeholders are aligned in their pursuit of excellence.

        Key components of a quality plan typically include:

        1. Organizational objectives to drive quality
        2. Steps involved in the processes
        3. Allocation of resources, responsibilities, and authority
        4. Specific documented standards, procedures, and instructions
        5. Testing, inspection, and audit programs
        6. Methods for measuring achievement of quality objectives

        Aligning with ICH Q10 Management Responsibilities

        ICH Q10 provides a model for an effective pharmaceutical quality system that goes beyond the basic requirements of Good Manufacturing Practice (GMP). To meet ICH Q10 management responsibilities, a quality plan should address the following areas:

        1. Management Commitment

        The quality plan should clearly articulate top management’s commitment to quality. This includes allocating necessary resources, participating in quality system oversight, and fostering a culture of quality throughout the organization.

        2. Quality Policy and Objectives

        Align your quality plan with your organization’s overall quality policy. Define specific, measurable quality objectives that support the broader goals of quality realization, establishing and maintaining a state of control, and facilitating continual improvement.

        3. Planning

        Outline the strategic approach to quality management, including how quality considerations are integrated into product lifecycle stages from development through to discontinuation.

        4. Resource Management

        Detail how resources (human, financial, and infrastructural) will be allocated to support quality initiatives. This includes provisions for training and competency development of personnel.

        5. Management Review

        Establish a process for regular management review of the quality system’s performance. This should include assessing the need for changes to the quality policy, objectives, and other elements of the quality system.

        Aligning with FDA’s Quality Management Maturity Model

        The FDA’s QMM program aims to encourage pharmaceutical manufacturers to go beyond basic compliance and foster a culture of quality and continuous improvement. To align your quality plan with QMM principles, consider incorporating the following elements:

        1. Quality Culture

        Describe how your organization will foster a strong quality culture mindset. This includes promoting open communication, encouraging employee engagement in quality initiatives, and recognizing quality-focused behaviors.

        2. Continuous Improvement

        Detail processes for identifying areas where quality management practices can be enhanced. This might include regular assessments, benchmarking against industry best practices, and implementing improvement projects.

        3. Risk Management

        Outline a proactive approach to risk management that goes beyond basic compliance. This should include processes for identifying, assessing, and mitigating risks to product quality and supply chain reliability.

        4. Performance Metrics

        Define key performance indicators (KPIs) that will be used to measure and monitor quality performance. These metrics should align with the FDA’s focus on product quality, patient safety, and supply chain reliability.

        5. Knowledge Management

        Describe systems and processes for capturing, sharing, and utilizing knowledge gained throughout the product lifecycle. This supports informed decision-making and continuous improvement.

        The SOAR Analysis

        A SOAR Analysis is a strategic planning framework that focuses on an organization’s positive aspects and future potential. The acronym SOAR stands for Strengths, Opportunities, Aspirations, and Results.

        Key Components

        1. Strengths: This quadrant identifies what the organization excels at, its assets, capabilities, and greatest accomplishments.
        2. Opportunities: This section explores external circumstances, potential for growth, and how challenges can be reframed as opportunities.
        3. Aspirations: This part focuses on the organization’s vision for the future, dreams, and what it aspires to achieve.
        4. Results: This quadrant outlines the measurable outcomes that will indicate success in achieving the organization’s aspirations.

        Characteristics and Benefits

        • Positive Focus: Unlike SWOT analysis, SOAR emphasizes strengths and opportunities rather than weaknesses and threats.
        • Collaborative Approach: It engages stakeholders at all levels of the organization, promoting a shared vision.
        • Action-Oriented: SOAR is designed to guide constructive conversations and lead to actionable strategies.
        • Future-Focused: While addressing current strengths and opportunities, SOAR also projects a vision for the future.

        Application

        SOAR analysis is typically conducted through team brainstorming sessions and visualized using a 2×2 matrix. It can be applied to various contexts, including business strategy, personal development, and organizational change.

        By leveraging existing strengths and opportunities to pursue shared aspirations and measurable results, SOAR analysis provides a framework for positive organizational growth and strategic planning.

        The SOAR Analysis for Quality Plan Writing

        Utilizing a SOAR (Strengths, Opportunities, Aspirations, Results) analysis can be an effective approach to drive the writing of a quality plan. This strategic planning tool focuses on positive aspects and future potential, making it particularly useful for developing a forward-looking quality plan. Here’s how you can leverage SOAR analysis in this process:

        Conducting the SOAR Analysis

        Strengths

        Begin by identifying your organization’s current strengths related to quality. Consider:

        • Areas where your organization excels in quality management
        • Significant quality-related accomplishments
        • Unique quality offerings that set you apart from competitors

        Ask questions like:

        • What are our greatest quality-related assets and capabilities?
        • Where do we consistently meet or exceed quality standards?

        Opportunities

        Next, explore external opportunities that could enhance your quality initiatives. Look for:

        • Emerging technologies that could improve quality processes
        • Market trends that emphasize quality
        • Potential partnerships or collaborations to boost quality efforts

        Consider:

        • How can we leverage external circumstances to improve our quality?
        • What new skills or resources could elevate our quality standards?

        Aspirations

        Envision your preferred future state for quality in your organization. This step involves:

        • Defining what you want to be known for in terms of quality
        • Aligning quality goals with overall organizational vision

        Ask:

        • What is our ideal quality scenario?
        • How can we integrate quality excellence into our long-term strategy?

        Results

        Finally, determine measurable outcomes that will indicate success in your quality initiatives. This includes:

        • Specific, quantifiable quality metrics
        • Key performance indicators (KPIs) for quality improvement
        • Key behavior indicators (KBIs) and Key risk indicators (KRIs)

        Consider:

        • How will we measure progress towards our quality goals?
        • What tangible results will demonstrate our quality aspirations have been achieved?

        Writing the Quality Plan

        With the SOAR analysis complete, use the insights gained to craft your quality plan:

        1. Executive Summary: Provide an overview of your quality vision, highlighting key strengths and opportunities identified in the SOAR analysis.
        2. Quality Objectives: Translate your aspirations into concrete, measurable objectives. Ensure these align with the strengths and opportunities identified.
        3. Strategic Initiatives: Develop action plans that leverage your strengths to capitalize on opportunities and achieve your quality aspirations. For each initiative, specify:
          • Resources required
          • Timeline for implementation
          • Responsible parties
        4. Performance Metrics: Establish a system for tracking the results identified in your SOAR analysis. Include both leading and lagging indicators of quality performance.
        5. Continuous Improvement: Outline processes for regular review and refinement of the quality plan, incorporating feedback and new insights as they emerge.
        6. Resource Allocation: Based on the strengths and opportunities identified, detail how resources will be allocated to support quality initiatives.
        7. Training and Development: Address any skill gaps identified during the SOAR analysis, outlining plans for employee training and development in quality-related areas.
        8. Risk Management: While SOAR focuses on positives, acknowledge potential challenges and outline strategies to mitigate risks to quality objectives.

        By utilizing the SOAR analysis framework, your quality plan will be grounded in your organization’s strengths, aligned with external opportunities, inspired by aspirational goals, and focused on measurable results. This approach ensures a positive, forward-looking quality strategy that engages stakeholders and drives continuous improvement.

        A well-crafted quality plan serves as a bridge between regulatory requirements, industry best practices, and an organization’s specific quality goals. By aligning your quality plan with ICH Q10 management responsibilities and the FDA’s Quality Management Maturity model, you create a robust framework for ensuring product quality, fostering continuous improvement, and building a resilient, quality-focused organization.

        Scale of Remediation Under a Consent Decree

        The recent Sanofi Warning Letter certainly gets me thinking about the work of a consent decree and the scale and ‘stickiness‘ within an organization.

        Scale of Remediation

        In the Sanofi-Genzyme consent decree there were these concentric circles of required activities. At the center was the plant the issue was discovered, the Allston Landing Facility, which had the full brunt of remediation.

        The next level out were the plants in Framingham and Northborough. They had remediation actions to be done, including reduced third party oversight for critical activities for a more limited time. The consent decree was on a much reduced scale at these sites.

        The next level out was the former Genzyme sites beyond the Massachusetts core. They did alignment to the new standards created as part of the consent decree. Finally the rest of Sanofi, after Sanofi bought Genzyme, pretty much ignored it.

        This balkanization meant that the culture across the organization never really changed. The cultural resistance of the site/silos fostered a culture of “us vs. them” mentality within the organization. Without a unified organizational culture, it is much harder to implement and maintain changes across the entire company.

        The Slippery Slope: How Quality Improvements Can Erode Over Time

        The erosion of quality culture at Sanofi demonstrated by this new Warning Letter isn’t unique to this case. Even when quality improvement initiatives are launched with great enthusiasm and initial success it is not uncommon for these hard-won gains to gradually erode over time, leaving organizations back where they started or even worse off. This phenomenon of “quality backsliding” can be frustrating and costly.

        Why Quality Improvements Fade

        There are several reasons why quality improvements may deteriorate over time:

        Leadership Changes: When key champions of quality initiatives leave or change roles, their successors may not prioritize maintaining those improvements. New leaders often want to make their own mark, potentially abandoning or de-emphasizing existing quality programs.

        Budget Cuts: In times of financial pressure, quality improvement efforts are often seen as “nice to have” rather than essential. Resources dedicated to sustaining improvements may be reallocated, leading to a gradual decline in performance.

        Complacency: Initial success can breed complacency. Once targets are met, there may be less motivation to continue pushing for further improvements or even maintaining current standards.

        Loss of Focus: As new priorities emerge, attention and resources can shift away from quality initiatives. Without ongoing commitment, processes can slowly revert to old, less effective ways of working.

        Lack of Standardization: If improvements aren’t fully standardized and integrated into daily operations, they remain dependent on individual efforts rather than becoming part of the organizational culture.

        PQS Efficiency – Is Efficiency Good?

        I do love a house metaphor or visualization, almost as I like a good tree, and this visualization of the house of quality is one I often return to. I want to turn to the question of efficiency, as it is often one I hear stressed by many leaders, and frankly I think the use can get a little off-kilter.

        We can define efficiency as the “productivity of a process and the utilization of resources.” The St Gallen reports commissioned by the FDA as part of the quality metrics initiative finds that efficiency and effectiveness in pharmaceutical quality systems are positively correlated, though the relationship is not as strong as some may expect.

        The study analyzed data from over 60 pharmaceutical manufacturing plants found a slight positive correlation between measures of quality system effectiveness and efficiency. This indicates that plants with more effective quality systems also tend to be more efficient in their operations. However, effectiveness only explained about 4% of the variation in efficiency scores, suggesting other factors play a major role as well.

        To dig deeper, the researchers separated plants into four groups based on their levels of quality effectiveness and efficiency. The top performing group excelled in both areas, while the lowest group struggled with both. Interestingly, there were also groups that performed well in one area but not the other. This reveals that effectiveness and efficiency, while related, are distinct capabilities that must be built separately.

        What really set apart the top performers was their higher implementation of operational excellence practices across areas like total productive maintenance, quality management, and just-in-time production. They also tended to have more empowered employees and a stronger culture of continuous improvement. This suggests that building these foundational capabilities is key to achieving both quality and efficiency.

        The research provides evidence that quality and efficiency can be mutually reinforcing when the right systems and culture are in place. However, it also shows this is not automatic – companies must be intentional about developing both in tandem. Those that focus solely on efficiency without building quality maturity may struggle to sustain performance in the long run. The most successful manufacturers find ways to make quality a driver of operational excellence, not a constraint on it.

        Dangers of an Excessive Focus on Efficiency

        An excessive focus on efficiency in organizations can further lead to several unintended negative consequences:

        Reduced Resilience and Flexibility

        Prioritizing efficiency often involves streamlining processes, reducing redundancies, and optimizing resource allocation. While this can boost short-term productivity, it can also make organizations less resilient to unexpected disruptions.

        Stifled Innovation and Creativity

        Efficiency-driven environments tend to emphasize standardization and predictability, which can hinder innovation. When resources are tightly controlled and risk-aversion is high, there’s little room for experimentation and creative problem-solving. This can leave companies vulnerable to being outpaced by more innovative competitors.

        Employee Burnout and Disengagement

        Pushing for ever-increasing efficiency can lead to work environments where employees are constantly pressured to do more with less. This approach can increase stress levels, leading to burnout, reduced morale, and ultimately, lower overall productivity. Overworked employees may struggle with work-life balance and experience health issues, potentially resulting in higher turnover rates.

        Compromised Quality

        There’s often a delicate balance between efficiency and quality. In the pursuit of faster and cheaper ways of doing things, organizations may inadvertently compromise on product or service quality. Over time, this can erode brand reputation and customer loyalty.

        Short-term Focus at the Expense of Long-term Success

        An overemphasis on efficiency can lead to a myopic focus on short-term gains while neglecting long-term strategic objectives. This can result in missed opportunities for sustainable growth and innovation.

        Resource Dilution and Competing Priorities

        When organizations try to be efficient across too many initiatives simultaneously, it can lead to resource dilution. This often results in many projects being worked on, but few being completed effectively or on time. Competing priorities can also lead to different departments working at cross-purposes, potentially canceling out each other’s efforts.

        Loss of Human Connection and Engagement

        Prioritizing task efficiency over human connection can have significant negative impacts on workplace culture and employee engagement. A lack of connection in the workplace can chip away at healthy mindsets and organizational culture.

        Reduced Adaptability to Change

        Highly efficient systems are often optimized for specific conditions. When those conditions change, such systems may struggle to adapt. This can leave organizations vulnerable in rapidly changing business environments.

        To mitigate these risks, organizations should strive for a balance between efficiency and other important factors such as resilience, innovation, and employee well-being. This may involve maintaining some redundancies, allowing for periods of “productive inefficiency,” and fostering a culture that values both productivity and human factors.

        Quality and Efficiency

        Building efficiency from quality, often referred to as “Good Quality – Good Business”, is best tackled by:

        1. Reduced waste and rework: By focusing on quality, companies can reduce defects, errors, and the need for rework. This directly improves efficiency by reducing wasted time, materials, and labor.
        2. Improved processes: Quality initiatives often involve analyzing and optimizing processes. These improvements can lead to more streamlined operations and better resource utilization.
        3. Enhanced reliability: High-quality products and processes tend to be more reliable. This reliability can reduce downtime, maintenance costs, and other inefficiencies.
        4. Cultural excellence: Organizations with a higher levels of cultural excellence, including employee engagement and continuous improvement mindsets supports both quality and efficiency improvements.

        The important thing to remember is efficiency that does not help the worker, that does not build resilience, is not efficiency at all.

        Models of Verification

        In the pharmaceutical industry, qualification and validation is a critical process to ensure the quality, safety, and efficacy of products. Over the years, several models have emerged to guide efforts for facilities, utilities, systems, equipment, and processes. This blog post will explore three prominent models: the 4Q model, the V-model, and the W-model. We’ll also discuss relevant regulatory guidelines and industry standards.

        The 4Q Model

        The 4Q model is a widely accepted approach to qualification in the pharmaceutical industry. It consists of four stages:

        1. Design Qualification (DQ): This initial stage focuses on documenting that the design of facilities, systems, and equipment is suitable for the intended purpose. DQ should verify that the proposed design of facilities, systems, and equipment is suitable for the intended purpose. The requirements of the user requirements specification (URS) should be verified during DQ.
        2. Installation Qualification (IQ): IQ verifies that the equipment or system has been properly installed according to specifications. IQ should include verification of the correct installation of components and instrumentation against engineering drawings and specifications — the pre-defined criteria.
        3. Operational Qualification (OQ): This stage demonstrates that the equipment or system operates as intended across the expected operating ranges. OQ should ensure the system is operating as designed, confirming the upper and lower operating limits, and/or “worst case” conditions. Depending on the complexity of the equipment, OQ may be performed as a combined Installation/Operation Qualification (IOQ). The completion of a successful OQ should allow for the finalization of standard operating and cleaning procedures, operator training, and preventative maintenance requirements.
        4. Performance Qualification (PQ): PQ confirms that the equipment or system consistently performs as expected under routine production conditions. PQ should normally follow the successful completion of IQ and OQ, though in some cases, it may be appropriate to perform PQ in conjunction with OQ or Process Validation. PQ should include tests using production materials, qualified substitutes, or simulated products proven to have equivalent behavior under normal operating conditions with worst-case batch sizes. The extent of PQ tests depends on the results from development and the frequency of sampling during PQ should be justified.

        The V-Model

        The V-model, introduced by the International Society of Pharmaceutical Engineers (ISPE) in 1994, provides a visual representation of the qualification process:

        1. The left arm of the “V” represents the planning and specification phases.
        2. The bottom of the “V” represents the build and unit testing phases.
        3. The right arm represents the execution and qualification phases.

        This model emphasizes the relationship between each development stage and its corresponding testing phase, promoting a systematic approach to validation.

        The W-Model

        The W-model is an extension of the V-model that explicitly incorporates commissioning activities:

        1. The first “V” represents the traditional V-model stages.
        2. The center portion of the “W” represents commissioning activities.
        3. The second “V” represents qualification activities.

        This model provides more granularity to what is identified as “verification testing,” including both commissioning (e.g., FAT, SAT) and qualification testing (IQ, OQ, PQ).

        Aspect4Q ModelV-ModelW-Model
        StagesDQ, IQ, OQ, PQUser Requirements, Functional Specs, Design Specs, IQ, OQ, PQUser Requirements, Functional Specs, Design Specs, Commissioning, IQ, OQ, PQ
        FocusSequential qualification stagesLinking development and testing phasesIntegrating commissioning with qualification
        FlexibilityModerateHighHigh
        Emphasis on CommissioningLimitedLimitedExplicit
        Risk-based ApproachCan be incorporatedCan be incorporatedInherently risk-based

        Where Qualifcation Fits into the Regulatory Landscape and Industry Guidelines

        WHO Guidelines

        The World Health Organization (WHO) provides guidance on validation and qualification in its “WHO good manufacturing practices for pharmaceutical products: main principles”. While not explicitly endorsing a specific model, WHO emphasizes the importance of a systematic approach to validation.

        EMA Guidelines

        The European Medicines Agency (EMA) has published guidelines on process validation for the manufacture of biotechnology-derived active substances and data to be provided in regulatory submissions. These guidelines align with the principles of ICH Q8, Q9, and Q10, promoting a lifecycle approach to validation.

        Annex 15 provides guidance on qualification and validation in pharmaceutical manufacturing. Regarding Design Qualification (DQ), Installation Qualification (IQ), Operational Qualification (OQ), and Performance Qualification (PQ) which is pretty much either the V or W model.

        Annex 15 emphasizes a lifecycle approach to validation, considering all stages from initial development of the user requirements specification through to the end of use of the equipment, facility, utility, or system. The main stages of qualification and some suggested criteria are indicated as a “could” option, allowing for flexibility in approach.

        Annex 15 provides a structured yet flexible approach to qualification, allowing pharmaceutical manufacturers to adapt their validation strategies to the complexity of their equipment and processes while maintaining compliance with regulatory requirements.

        FDA Guidance

        The U.S. Food and Drug Administration (FDA) issued its “Guidance for Industry: Process Validation: General Principles and Practices” in 2011. This guidance emphasizes a lifecycle approach to process validation, consisting of three stages: process design, process qualification, and continued process verification.

        ASTM E2500

        ASTM E2500, “Standard Guide for Specification, Design, and Verification of Pharmaceutical and Biopharmaceutical Manufacturing Systems and Equipment,” provides a risk-based approach to validation. It introduces the concept of “verification” as an alternative to traditional qualification steps, allowing for more flexible and efficient validation processes.

        ISPE Guidelines

        The International Society for Pharmaceutical Engineering (ISPE) has published several baseline guides and good practice guides that complement regulatory requirements. These include guides on commissioning and qualification, as well as on the implementation of ASTM E2500.

        Baseline Guide Vol 5: Commissioning & Qualification (Second Edition)

        This guide offers practical guidance on implementing a science and risk-based approach to commissioning and qualification (C&Q). Key aspects include:

        • Applying Quality Risk Management to C&Q
        • Best practices for User Requirements Specification, Design Review, Design Qualification, and acceptance/release
        • Efficient use of change management to support C&Q
        • Good Engineering Practice documentation standards

        The guide aims to simplify and improve the C&Q process by integrating concepts from regulatory guidances (EMA, FDA, ISO) and replacing certain aspects of previous approaches with Quality Risk Management and Good Engineering Practice concepts.

        Conclusion

        While the 4Q, V, and W models provide structured approaches to validation, the pharmaceutical industry is increasingly moving towards risk-based and science-driven methodologies. Regulatory agencies and industry organizations are promoting flexible approaches that focus on critical aspects of product quality and patient safety.

        By leveraging guidelines such as ASTM E2500 and ISPE recommendations, pharmaceutical companies can develop efficient validation strategies that meet regulatory requirements while optimizing resources. The key is to understand the principles behind these models and guidelines and apply them in a way that best suits the specific needs of each facility, system, or process.