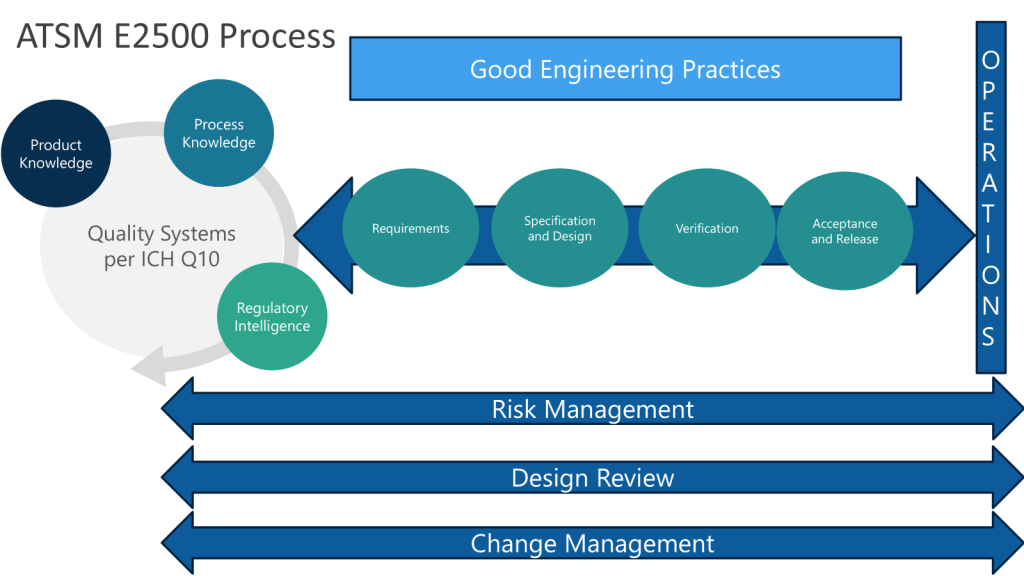
Equipment Effectiveness – a KPI with a few built in KBIs

A key KPI for a FUSE program is Overall Equipment Effectiveness (OEE) which measures the efficiency and productivity of equipment and production processes.

Definition of OEE

OEE is a percentage that represents the proportion of truly productive manufacturing time. It takes into account three main factors:

  1. Availability: The ratio of Run Time to Planned Production Time. It takes into account any events that stop planned production for an appreciable length of time.
  2. Performance: Anything that causes the manufacturing process to run at less than the maximum possible efficiency when it is running.
  3. Quality: Manufactured material that do not meet quality standards, including materialthat require rework and reprocessing.

The formula for calculating OEE is:

OEE = Availability × Performance × Quality

Components of OEE

Availability

Availability measures the percentage of scheduled time that the equipment is available to operate. It accounts for downtime losses.

Availability = Run Time / Planned Production Time

Performance

Performance compares the actual output of equipment to its theoretical maximum output at optimal speed.

Performance = (Ideal Cycle Time × Total Count) / Run Time

Quality

Quality represents the percentage of released material produced out of the total material produced.

Quality = Good Count / Total Count

Importance of OEE

OEE is crucial for several reasons:

  1. It provides a comprehensive view of manufacturing productivity.
  2. It helps identify losses and areas for improvement.
  3. It serves as a benchmark for comparing performance across different equipment or production lines.
  4. It supports continuous improvement initiatives.

Interpreting OEE Scores

While OEE scores can vary by industry, generally:

  • 100% OEE is perfect production
  • 85% is considered world-class
  • 60% is fairly typical
  • 40% is low but not uncommon for companies just starting to measure OEE

Benefits of Tracking OEE

  1. Identifies hidden capacity in manufacturing operations
  2. Reduces manufacturing costs
  3. Improves quality control
  4. Increases equipment longevity through better maintenance practices
  5. Enhances decision-making with data-driven insights

Improving OEE

To improve OEE, manufacturers can:

  1. Implement preventive maintenance programs
  2. Optimize changeover procedures
  3. Enhance operator training
  4. Use real-time monitoring systems
  5. Analyze root causes of downtime and quality issues
  6. Implement continuous improvement methodologies

By focusing on OEE, manufacturers can significantly enhance their productivity, reduce waste, and improve their bottom line. It’s a powerful metric that provides actionable insights for optimizing manufacturing processes.

The Effectiveness of the OEE Metric

Utilizing the rubric:

AttributeMeaningScoreWhat this means in My Organization
RelevanceHow strongly does this metric connect to business objectives?5Empirically Direct – Data proves the metric directly supports at least one business objective – the ability to meet client requirements
MeasurabilityHow much effort would it take to track this metric?3Medium – Data exists but in a variety of spreadsheets systems, minor collection or measurement challenges may exist. Will need to agree on what certain aspects of data means.
PrecisionHow often and by what margin does the metric change?5Once we agree on the metric and how to measure it, it should be Highly Predictable
ActionabilityCan we clearly articulate actions we would take in response to this metric?4Some consensus on action, and capability currently exists to take action. This metric will be used to drive consensus.
Presence of BaselineDoes internal or external baseline data exist to indicate good/poor performance for this metric?3Baseline must be based on incomplete or directional data. Quite frankly, the site is just qualified and there will be a rough patch.

This tells me this is a strong metric that requires a fair amount of work to implement. It is certainly going into the Metrics Plan.

A Deeper Dive into Equipment Availability

Equipment availability metric measures the proportion of time a piece of equipment or machinery is operational and ready for production compared to the total planned production time. It is a key component of Overall Equipment Effectiveness (OEE), along with Performance and Quality.

This metric directly impacts production capacity and throughput with a high availability indicating efficient maintenance practices and equipment reliability. This metric helps identify areas for improvement in operations and maintenance.

Definition and Calculation

Equipment availability is expressed as a percentage and calculated using the following formula:

Availability (%) = (Actual Operation Time / Planned Production Time) × 100

Where:

  • Actual Operation Time = Planned Production Time – Total Downtime
  • Planned Production Time = Total Time – Planned Downtime

For example, if a machine is scheduled to run for 8 hours but experiences 1 hour of unplanned downtime:

Availability = (8 hours – 1 hour) / 8 hours = 87.5%Types of Availability Metrics

Inherent Availability

This metric is often used by equipment designers and manufacturers. It only considers corrective maintenance downtime.

Inherent Availability = MTBF / (MTBF + MTTR)

Where:

  • MTBF = Mean Time Between Failures
  • MTTR = Mean Time To Repair

Achieved Availability

This version includes both corrective and preventive maintenance downtime, making it more useful for maintenance teams.

Achieved Availability = MTBM / (MTBM + M)

Where:

  • MTBM = Mean Time Between Maintenance
  • M = Mean Active Maintenance Time

Factors Affecting Equipment Availability

  1. Planned downtime (e.g., scheduled maintenance, changeovers)
  2. Unplanned downtime (e.g., breakdowns, unexpected repairs)
  3. Equipment reliability
  4. Maintenance strategies and effectiveness
  5. Operator skills and training

Improving Equipment Availability

To increase equipment availability, consider the following strategies:

  1. Implement preventive and predictive maintenance programs.
  2. Optimize changeover procedures and reduce setup times.
  3. Enhance operator training to improve equipment handling and minor maintenance skills.
  4. Use real-time monitoring systems to quickly identify and address issues.
  5. Analyze root causes of downtime and implement targeted improvements.
  6. Incorporate fault tolerance at the equipment design stage.
  7. Create asset-specific maintenance programs.

Relationship to Other Metrics

Equipment availability is closely related to other important manufacturing metrics:

  1. It’s one of the three components of OEE, alongside Performance and Quality.
  2. It’s distinct from but related to equipment reliability, which measures the probability of failure-free operation.
  3. It impacts overall plant efficiency and productivity.

By focusing on improving equipment availability, manufacturers can enhance their overall operational efficiency, reduce costs, and increase production capacity. Regular monitoring and analysis of this metric can provide valuable insights for continuous improvement initiatives in manufacturing processes.

To generate an equipment availability KPI in process manufacturing, you should follow these steps:

Calculate Equipment Availability

The basic formula for equipment availability is:

Availability = Run Time / Planned Production Time

Where:

  • Run Time = Planned Production Time – Downtime
  • Planned Production Time = Total Time – Planned Downtime

For example, if a machine is scheduled to run for 8 hours, but has 1 hour of unplanned downtime:

Availability = (8 hours – 1 hour) / 8 hours = 87.5%

Track Key Data Points

To calculate availability accurately, you need to track:

  • Total available time
  • Planned downtime (e.g. scheduled maintenance)
  • Unplanned downtime (e.g. breakdowns)
  • Actual production time

Implement Data Collection Systems

Use automated data collection systems like machine monitoring software or manufacturing execution systems (MES) to capture accurate, real-time data on equipment status and downtime.

Analyze Root Causes

Categorize and analyze causes of downtime to identify improvement opportunities. Common causes include:

  • Equipment failures
  • Changeovers/setups
  • Material shortages
  • Operator availability

Set Targets and Monitor Trends

  • Set realistic availability targets based on industry benchmarks and your current performance
  • Track availability over time to identify trends and measure improvement efforts
  • Compare availability across equipment and production lines

Take Action to Improve Availability

  • Implement preventive and predictive maintenance programs
  • Optimize changeover procedures
  • Improve operator training
  • Address chronic equipment issues

Use Digital Tools

Leverage technologies like IoT sensors, cloud analytics, and digital twins to gain deeper insights into equipment performance and predict potential failures.

Planned Production Time

Planned production time is the total amount of time scheduled for production activities, excluding planned downtime. It represents the time during which equipment or production lines are expected to be operational and producing goods. It can be rather tricky to agree on the exact meaning.

Calculation

The basic formula for planned production time is:

Planned Production Time = Total Time – Planned Downtime

Where:

  • Total Time is the entire time period being considered (e.g., a shift, day, week, or month)
  • Planned Downtime includes scheduled maintenance, changeovers, and other planned non-productive activities

Components of Planned Production Time

Total Time

This is the full duration of the period being analyzed, such as:

  • A single 8-hour shift
  • A 24-hour day
  • A 7-day week
  • A 30-day month
Planned Downtime

This includes all scheduled non-productive time, such as:

  • Preventive maintenance
  • Scheduled breaks
  • Shift changes
  • Planned changeovers between batches
  • Cleaning and sanitation procedures

Considerations for Batch Manufacturing

In batch production, several factors affect planned production time:

  1. Batch Changeovers: Time allocated for switching between different product batches must be accounted for as planned downtime.
  2. Equipment Setup: The time required to configure machinery for each new batch should be included in planned downtime.
  3. Quality Checks: Time for quality control procedures between batches may be considered part of planned production time or planned downtime, depending on the specific process.
  4. Cleaning Procedures: Time for cleaning equipment between batches is typically considered planned downtime.
  5. Material Handling: Time for loading raw materials and unloading finished products between batches may be part of planned production time or downtime, based on the specific process.
Example Calculation

Let’s consider a single 8-hour shift in a batch manufacturing facility:

  • Total Time: 8 hours
  • Planned Downtime:
  • Scheduled breaks: 30 minutes
  • Equipment setup for new batch: 45 minutes
  • Cleaning between batches: 15 minutes

Planned Production Time = 8 hours – (0.5 + 0.75 + 0.25) hours
= 8 hours – 1.5 hours
= 6.5 hours

In this example, the planned production time for the shift is 6.5 hours.

Metrics Scoring

As I develop metrics for FUSE, it is important to have a method rating a metric for effectiveness. Here’s the rubric I’ll be using.

RelevanceMeasurabilityPrecisionActionabilityPresence of Baseline
Rating ScaleHow strongly does this metric connect to business objectives?How much effort would it take to track this metric?How often and by what margin does the metric change?Can we clearly articulate actions we would take in response to this metric?Does internal or external baseline data exist to indicate good/poor performance for this metric?
5Empirically Direct – Data proves the metric directly supports at least one business objectiveAlmost None – Data already collected and visualized in a centralized systemHighly Predictable -– Metric fluctuates narrowly and infrequentlyClear consensus on action, and capability currently exists to take actionBaseline can be based on both internal and external data
4Logically Direct – Clear logic shows how the metric directly supports at least one business objectiveLow – Data collected and measured consistently, but not aggregated in central system.Somewhat Predictable – Metric fluxtuates either narrowly or infrequentlySome consensus on action, and capability currently exists to take actionBaseline can be based on either internal or external data
3Empirically Indirect – Data proves the metric indirectly supports at least one business objectiveMedium – Data exists but in local systems, minor collection or measurement challenges may exist.Neither Volatile or PredictableSome consensus on action, and capability to take action expected in the futureBaseline must be based on incomplete or directional data
2Logically Indirect – Clear logic shows how the metric indirectly supports at least one business objectiveHigh – Inconsistent measurements across sites, data not being collected regularly.Somewhat Volatile – Metric fluctuates either widely or frequentlySome consensus on action, but no current or expected future capability to take actionNo data exists to establish baseline, but data can be generated within six months
1Unclear – Connection to business objective is unclearPotentially Prohibitive – No defined measurement or collection method in place.Highly Volatile – Metric fluctuates widely and frequentlyNo consensus on actionNo data exists to establish baseline, and data needed will take more than a year to generate
Weights25%20%20%25%10%

Metrics Plan for Facility, Utility, System and Equipment

As October rolls around I am focusing on 3 things: finalizing a budget; organization design and talent management; and a 2025 metrics plan. One can expect those three things to be the focus of a lot of my blog posts in October.

Go and read my post on Metrics plans. Like many aspects of a quality management system we don’t spend nearly enough time planning for metrics.

So over the next month I’m going to develop the strategy for a metrics plan to ensure the optimal performance, safety, and compliance of our biotech manufacturing facility, with a focus on:

  1. Facility and utility systems efficiency
  2. Equipment reliability and performance
  3. Effective commissioning, qualification, and validation processes
  4. Robust quality risk management
  5. Stringent contamination control measures

Following the recommended structure of a metrics plan, here is the plan:

Rationale and Desired Outcomes

Implementing this metrics plan will enable us to:

  • Improve overall facility performance and product quality
  • Reduce downtime and maintenance costs
  • Ensure regulatory compliance
  • Minimize contamination risks
  • Optimize resource allocation

Metrics Framework

Our metrics framework will be based on the following key areas:

  1. Facility and Utility Systems
  2. Equipment Performance
  3. Commissioning, Qualification, and Validation (CQV)
  4. Quality Risk Management (QRM)
  5. Contamination Control

Success Criteria

Success will be measured by:

  • Reduction in facility downtime
  • Improved equipment reliability
  • Faster CQV processes
  • Decreased number of quality incidents
  • Reduced contamination events

Implementation Plan

Steps, Timelines & Milestones

  1. Develop detailed metrics for each key area (Month 1)
  2. Implement data collection systems (Month 2)
  3. Train personnel on metrics collection and analysis (Month 3)
  4. Begin data collection and initial analysis (Month 4)
  5. Review and refine metrics (Month 9)
  6. Full implementation and ongoing analysis (Month 12 onwards)

This plan gets me ready to evaluate these metrics as part of governance in January of next year.

In October I will breakdown some metrics, explaining them and provide the rationale, and demonstrate how to collect. I’ll be striving to break these metrics into key performance indicators (KPI), key behavior indicators (KBI) and key risk indicators (KRI).

Managing Change Controls Between a CDMO and a Sponsor/MAH

It is crucial for a Marketing Authorization Holder (MAH) to review and approve changes made by a Contract Development and Manufacturing Organization (CDMO) for several important reasons:

Regulatory Compliance

The Market Authorization Holder (MAH) – or the sponsor for pre-commercial GMP manufacturing – bears the primary responsibility for ensuring compliance with the marketing authorization and regulatory requirements throughout the product’s lifecycle. By reviewing and approving CDMO changes, the MAH can:

  • Ensure changes align with the approved marketing authorization
  • Verify that any variations to the marketing authorization are properly submitted to regulatory authorities
  • Maintain oversight of post-approval change management as required by regulations

Before I go any further on the topic I want you to go and read my post Classification of Changes for GMP/GDP. This post will build on that discussion.

I think it is better for the CDMO to put a lot of thought into this, and the MAH (the client) to evaluate and adapt. For all but the big players, the volume is going to be on the CDMO’s side. But if you are the client and your CDMO hasn’t taken this into account to the appropriate degree, you need to ensure appropriate steps taken. As such the rest of this post will be written from the CDMO’s side, but the same principles apply to the MAH (and should be included in the audit program).

Remember we have three goals:

  • Fulfill our contractual responsibilities
  • Help the MAH maintain appropriate control as the product owner
  • Ensure alignment between both parties on change implementation

The critical requirement here is ensuring the right changes get to the right client so they can be filled the right way. Returning to basics, we are approaching changes as:

Now it’s easy to apply this to product. Create and/or receive the design space and the control space. Everything that falls into a non-established condition does not get reported to the client at time of execution. If it is “Do and Report” is is in the APQR. If it is “Do and Record” they can see it during the audit.

Where a lot of CDMOs trip up here are facility and quality system changes. My recommendation here is the same, define a design space based on the CMC section of the Common Technical Document which basically boils down to:

The CMC (Chemistry, Manufacturing, and Controls) section of a regulatory dossier typically includes the following key facility-related information:

  • Manufacturing Facilities
    • Names and addresses of all manufacturing, testing, and storage facilities involved in production
    • Description of the manufacturing operations performed at each site
    • Floor plans and layouts of production areas
    • Details on utilities and support systems (HVAC, water, gases, etc.)
    • Information on facility design features for contamination control and product protection
  • Equipment
    • List of major production and laboratory equipment
    • Equipment specifications and capacities
    • Cleaning and maintenance procedures for equipment
  • Environmental Controls
    • Description of clean room classifications and environmental monitoring programs
    • Air handling systems and controls
    • Water systems (purified water, water for injection) and controls
  • Material Flow
    • Personnel and material flow diagrams
    • Segregation of operations to prevent cross-contamination
  • Quality Control Laboratories
    • Description of QC lab facilities and equipment
    • Environmental controls in QC labs
  • Storage Areas
    • Description of storage facilities for raw materials, intermediates, and finished products
    • Storage conditions and controls (temperature, humidity, etc.)

There is a whole lot of wiggle room here in things that fall into “Do and Record.” By building this into your change control system you can delineate what goes to to the client and what doesn’t. I recommend sitting down with this list and deciding what types of changes fall into “Tell and Do” – what you ask permission from clients before doing; “Do and Report” – what goes in the APQR; and, “Do and Record” – what the client sees when they audit.

You know have good rules on what changes go to a client for prior approval and which ones do not. This gets codified in two places: the change control process and the quality/technical agreement.

Some other things to build into your change control process:

  1. Documenting when a client requests a change, the reason and the impact on the platform. Remember you have other clients, and more and more CDMO’s are offering a platform, so there needs to be appropriate review and endorsement.
  2. Think through how changes to facility (and other platform elements) are communicated and gated for multiple clients. Have a mechanism to manage client specific activities and to track first-product impacted for multiple products.
  3. Have clear timelines and expectations on change communication and approval with the client in the quality/technical agreement. Hold each other accountable.
  4. Have contingency plans. There will always be that one client who will be in shortage if you make that urgent change just when you want/need to.
  5. Have a method for evaluating requested changes to the change plan by clients and making decisions around it. There will be that one client who doesn’t agree or wants something weird that disagrees with what all the other clients want.
  6. Have rules in place to manage changes inactive for long periods or extensions specific for those changes that rise to client approval. These will have a different flow than internal changes.

I’ve used a bit of commercial headspace for this post, relying on the APQR. For clinical processes, product tends to fall into campaign-mindset, so “Do and Report” ends up being more a clinical campaign change report than an APQR.

The 25% Tipping Point

Multiple studies have found that when approximately 25% of a population adopts a new behavior or belief, it can trigger a rapid shift toward widespread adoption. This suggests that change initiatives in organizations may gain critical momentum once about a quarter of employees get on board. The concept of a tipping point is really important in the development of a quality culture.

Factors Influencing Tipping Points

Several factors can affect where the tipping point occurs:

  • Strength of existing norms: More entrenched behaviors require larger minority groups to spark change.
  • Social costs: Higher penalties for non-conformity make change more difficult.
  • Visibility: Changes that are more observable spread more easily.
  • Incentives: Financial or other rewards for maintaining status quo can impede change.

Implications for Organizational Change

Based on this research, some key takeaways for driving change in organizations include:

  • Focus on early adopters: Concentrate efforts on getting 25-30% of employees to embrace the change initially.
  • Increase visibility: Make adoption of new behaviors highly visible to accelerate social contagion.
  • Reduce barriers: Minimize social or financial costs for early adopters of change.
  • Persistence is key: Change agents should persist even if initial efforts seem unsuccessful – they may be close to the tipping point.

The Role of Leadership

Leaders play a crucial role in engineering environments conducive to change. Given that they control key levers (incentives and social costs especially) not having leaders on board is devastating. Leaders need to:

  • Creating common understanding of benefits
  • Encouraging and supporting “change champions”
  • Aligning incentives with desired new behaviors
  • Facilitating rapid information flow about adoption