Cause-Consequence Analysis (CCA): A Powerful Tool for Risk Assessment

Cause-Consequence Analysis (CCA) is a versatile and comprehensive risk assessment technique that combines elements of fault tree analysis and event tree analysis. This powerful method allows analysts to examine both the causes and potential consequences of critical events, providing a holistic view of risk scenarios.

What is Cause-Consequence Analysis?

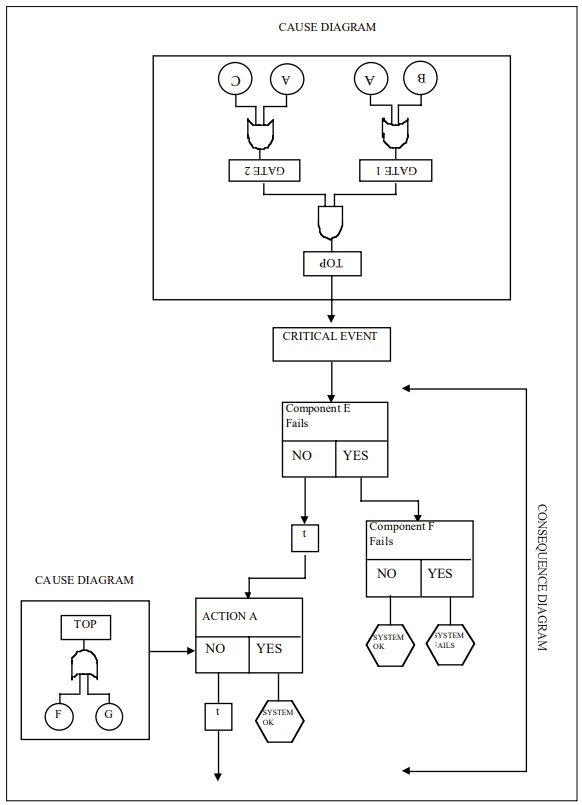
Cause-Consequence Analysis is a graphical method that integrates two key aspects of risk assessment:

  1. Cause analysis: Identifying and analyzing the potential causes of a critical event using fault tree-like structures.
  2. Consequence analysis: Evaluating the possible outcomes and their probabilities using event tree-like structures.

The result is a comprehensive diagram that visually represents the relationships between causes, critical events, and their potential consequences.

When to Use Cause-Consequence Analysis

CCA is particularly useful in the following situations:

  1. Complex systems analysis: When dealing with intricate systems where multiple factors can interact to produce various outcomes.
  2. Safety-critical industries: In sectors such as nuclear power, chemical processing, and aerospace, where understanding both causes and consequences is crucial.
  3. Multiple outcome scenarios: When a critical event can lead to various consequences depending on the success or failure of safety systems or interventions.
  4. Comprehensive risk assessment: When a thorough understanding of both the causes and potential impacts of risks is required.
  5. Decision support: To aid in risk management decisions by providing a clear picture of risk pathways and potential outcomes.

How to Implement Cause-Consequence Analysis

Implementing CCA involves several key steps:

1. Identify the Critical Event

Start by selecting a critical event – an undesired occurrence that could lead to significant consequences. This event serves as the focal point of the analysis.

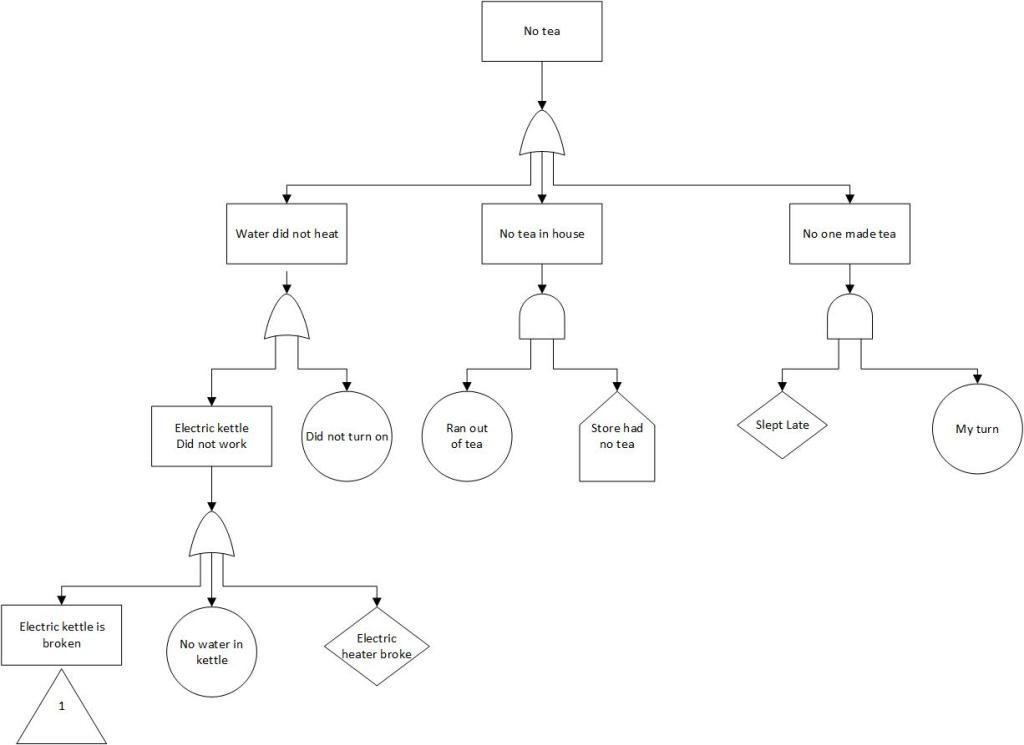
2. Construct the Cause Tree

Working backwards from the critical event, develop a fault tree-like structure to identify and analyze the potential causes. This involves:

  • Identifying primary, secondary, and root causes
  • Using logic gates (AND, OR) to show how causes combine
  • Assigning probabilities to basic events

3. Develop the Consequence Tree

Moving forward from the critical event, create an event tree-like structure to map out potential consequences:

  • Identify safety functions and barriers
  • Determine possible outcomes based on the success or failure of these functions
  • Include time delays where relevant

4. Integrate Cause and Consequence Trees

Combine the cause and consequence trees around the critical event to create a complete CCA diagram.

5. Analyze Probabilities

Calculate the probabilities of different outcome scenarios by combining the probabilities from both the cause and consequence portions of the diagram.

6. Evaluate and Interpret Results

Assess the overall risk picture, identifying the most critical pathways and potential areas for risk reduction.

Benefits of Cause-Consequence Analysis

CCA offers several advantages:

  • Comprehensive view: Provides a complete picture of risk scenarios from causes to consequences.
  • Flexibility: Can be applied to various types of systems and risk scenarios.
  • Visual representation: Offers a clear, graphical depiction of risk pathways.
  • Quantitative analysis: Allows for probability calculations and risk quantification.
  • Decision support: Helps identify critical areas for risk mitigation efforts.

Challenges and Considerations

While powerful, CCA does have some limitations to keep in mind:

  • Complexity: For large systems, CCA diagrams can become very complex and time-consuming to develop.
  • Expertise required: Proper implementation requires a good understanding of both fault tree and event tree analysis techniques.
  • Data needs: Accurate probability data for all events may not always be available.
  • Static representation: The basic CCA model doesn’t capture dynamic system behavior over time.

Cause-Consequence Analysis is a valuable tool in the risk assessment toolkit, offering a comprehensive approach to understanding and managing risk. By integrating cause analysis with consequence evaluation, CCA provides decision-makers with a powerful means of visualizing risk scenarios and identifying critical areas for intervention. While it requires some expertise to implement effectively, the insights gained from CCA can be invaluable in developing robust risk management strategies across a wide range of industries and applications.

Cause-Consequence Analysis Example

Process StepPotential CauseConsequenceMitigation Strategy
Upstream Bioreactor OperationLeak in single-use bioreactor bagContamination risk, batch lossUse reinforced bags with pressure sensors + secondary containment
Cell CultureFailure to maintain pH/temperatureReduced cell viability, lower mAb yieldReal-time monitoring with automated control systems
Harvest ClarificationPump malfunction during depth filtrationCell lysis releasing impuritiesRedundant pumping systems + surge tanks
Protein A ChromatographyLoss of column integrityInefficient antibody captureRegular integrity testing + parallel modular columns
Viral FiltrationMembrane foulingReduced throughput, extended processing timePre-filtration + optimized flow rates
FormulationImproper mixing during buffer exchangeProduct aggregation, inconsistent dosingAutomated mixing systems with density sensors
Aseptic FillingBreach in sterile barrierMicrobial contaminationClosed system transfer devices (CSTDs) + PUPSIT testing
Cold Chain StorageTemperature deviation during freezingProtein denaturationControlled rate freeze-thaw systems + temperature loggers

Key Risk Areas and Systemic Impacts

1. Contamination Cascade
Single-use system breaches can lead to:

  • Direct product loss ($500k-$2M per batch)
  • Facility downtime for decontamination (2-4 weeks)
  • Regulatory audit triggers

2. Supply Chain Interdependencies
Delayed delivery of single-use components causes:

  • Production schedule disruptions
  • Increased inventory carrying costs
  • Potential quality variability between suppliers

3. Environmental Tradeoffs
While reducing water/energy use by 30-40% vs stainless steel, single-use systems introduce:

  • Plastic waste generation (300-500 kg/batch)
  • Supply chain carbon footprint from polymer production

Mitigation Effectiveness Analysis

Control MeasureRisk Reduction (%)Cost Impact
Automated monitoring systems45-60High initial investment
Redundant fluid paths30-40Moderate
Supplier qualification25-35Low
Staff training programs15-25Recurring

This analysis demonstrates that single-use mAb manufacturing offers flexibility and contamination reduction benefits, but requires rigorous control of material properties, process parameters, and supply chain logistics. Modern solutions like closed-system automation and modular facility designs help mitigate key risks while maintaining the environmental advantages of single-use platforms.

Tree Analysis – Fault, Cause, Question and Success

The pictorial tree is a favorite for representing branching paths. Some common ones include Fault Tree Analysis (FTA); Cause Trees to analyze used retrospectively to analyze events that have already occurred; Question Trees to aid in problem-solving; and, even Success Trees to figure out why something went right.

Apple Tree illustration with long branching roots

Inductive or Deductive

Inductive Reasoning: Induction is reasoning from individual cases to a general conclusion. We start from a particular initiating condition and attempt to ascertain the effect of that fault or condition on a system.
Deductive Reasoning: Deduction is reasoning from the general to the specific. We start with the way the system has failed and we attempt to find out what modes of system behavior contribute to this failure.

The beauty of a pictorial representation is that depending on which way you go on the tree pictorially represents the form of reasoning that is used.

Inductive reasoning is the branches, and tools like a Cause Tree, are used to determine what system states (usually failed states) are possible. The inductive techniques provide answers to the generic question, “What happens if–?” The process consists of assuming a particular state of existence of a component or components and analyzing to determine the effect of that condition on the system.

Deductive reasoning is the roots, and tools like Fault Tree Analysis, take some specific system state, which is generally a failure state, and chains of more basic faults contributing to this
undesired events are built up in a systematic way to determine how a given failure can occur.

Success/Failure Space

We operate in a success/failure space. We are constantly identifying ways a thing can fail or the various ways of success.

Success/Failure Space

These are really just two sides of the coin in many ways, with identifiable points in success space coinciding with analogous points in failure space. “Maximum anticipated success” in success space coincides with “minimum anticipated failure” in failure space.

Like everything, how we frame the question helps us find answers. Certain questions require us to think in terms of failure space, others in success. There are advantages in both, but in risk management, the failure space is incredibly valuable.

Fault Tree Analysis

Fault Tree Analysis (FTA) is a tool for identifying and analyzing factors that contribute to an undesired event (called the “top event”). The top event is analyzed by first identifying its immediate and necessary causes. The logical relationship between these causes is represented by several gates such as AND and OR gates. Each cause is then analyzed step-wise in the same way until further analysis becomes unproductive. The result is a graphical representation of a Boolean equation in a tree diagram.

The Undesired Event

Fault tree analysis is a deductive failure analysis that focuses on one particular undesired event to determine the causes of this event. The undesired event constitutes the top event in a fault tree diagram and generally consists of a complete failure.

If the top event is too general, the analysis becomes unmanageable; if it is too specific, the analysis does not provide a sufficiently broad view.

Top events are usually a failure of a critical requirement or process step.

A fault tree is not a model of all possible failures or all possible causes for failure. A fault tree is tailored to its top event which corresponds to some particular failure mode, and the fault tree includes only those faults that contribute to this top event. These faults are not exhaustive – they cover only the most credible faults as assessed by the risk team.

The Symbology of a Fault Tree

Events

Base EventThe circle describes a basic initiating fault event that requires no further
development. The circle signifies that the appropriate limit of
resolution has been reached.
Undeveloped EventThe diamond describes a specific fault event that is not further developed, either because the event is of insufficient consequence or because information relevant to the event is unavailable.
Conditioning EventThe ellipse is used to record any conditions or restrictions that apply to any logic gate. It is used primarily with the INHIBIT and PRIORITY AND-gates.
External EventThe house is used to signify an event that is normally expected to occur: e.g., a phase change. The house symbol displays events that are not, of themselves, faults.

External does not mean external to the organization.
Intermediate EventAn intermediate event is a fault event that occurs because of one or more
antecedent causes acting through logic gates. All intermediate events are symbolized by rectangles.
Event Symbols used in a Fault Tree Analysis

Gates

There are two basic types of fault tree gates: the OR-gate and the AND-gate. All other gates are really special cases of these two basic types.

OR-gateThe OR-gate is used to show that the output event occurs only if one or more of the input events occur. There may be any number of input events to an OR-gate.
AND-gateThe AND-gate is used to show that the output fault occurs only if all the input faults occur. There may be any number of input faults to an AND-gate.
INHIBIT-gateThe INHIBIT-gate, represented by the hexagon, is a special case of the AND-gate. The output is caused by a single input, but some qualifying condition must be satisfied before the input can produce the output. The condition that must exist is the conditional input. A description of this conditional input is spelled out within an ellipse drawn to the right of the gate.
EXCLUSIVE OR-gate The EXCLUSIVE OR-gate is a special case of the OR-gate in which the output event occurs only if exactly one of the input events occur
PRIORITY AND-gateThe PRIORITY AND-gate is a special case of the AND-gate in which the output event occurs only if all input events occur in a specified ordered sequence. The sequence is usually shown inside an ellipse drawn to the right of the gate. In practice, the necessity of having a specific sequence is not usually encountered.
Gate Symbols used in a Fault Tree Analysis

Procedure

  1. Identify the system or process that will be examined, including boundaries that will limit the analysis. FTA often stems from a previous risk assessment, such as a FMEA or Structured What-If; or, it comes from a root cause analysis.
  2. Identify the members of the Risk Team. The Risk Team is comprised of the Process Owner, the Facilitator, and Subject Matter Experts (SMEs) with expertise in the process being reviewed.
  3. Identify the Top Event, the type of failure that will be analyzed as narrowly and specifically as possible.
  4. Identify the events that may be immediate cause sof the top event. Write these events at the level below te event they cause.
    1. For each event ask “Is this a basic failure? Or can it be analyzed for its immediate causes?”
      1. If the event is a basic failure, draw a circle around it.
      2. If it can be analyzed for its own causes draw a rectangle around it (NOTE: if appropriate, other event types are possible)
  5. Ask “How are these events related to the one they cause?” Use the gate symbols to show the relationships. The lower-level events are the input events. They one they cause, above the gate is the output event.
  6. For each event that is not basic, repeat steps 4 and 5. Continue until all branches of the tree end in a basic or undeveloped event.
  7. To determine the mathematical probability of failure, assign probabilities to each of the basic events. Use Boolean algebra to calculate the probability of each high-level event and the top event. Discussions of the math is a very different post.
  8. Analyze the tree to understand the relations between the causes and to find ways to prevent failures. Use the gate relationships to find the most efficient ways to reduce risk. Focus attention on the causes most likely to happen.
FTA example using lack of team (basic)

The Question Tree

A critical task in problem-solving is determining what kinds of analysis and corresponding data would best solve the problem. Rather than a shortage of techniques, there are too many to choose from, we can often reflexively use the same few, basic tools out of familiarity and habit. This can mislead when the situation is complex, non-routine, and/or unfamiliar.

This is where a Question Tree comes in handy to determine what analyses and data are suited for a particular problem-solving situation. This tool is also known as a logic tree or a decision tree. Question Trees are structures for seeing the elements of a problem clearly, and keeping track of different levels of the problem, which we can liken to trunks, branches, twigs, and leaves. You can arrange them from left to right, right to left, or top to bottom— whatever makes the elements easier for you to visualize. Think of a Question Tree as a mental model of your problem. Better trees have a clearer and more complete logic of relationships linking the parts to each other, are more comprehensive and have no overlap.

The Question Tree is very powerful when working through broad and complex problems that no single analysis or framework can solve. By developing a set of questions that are connected to one another in the form of a tree we can determine what data analysis is needed, which can help us break out of the habit of using the same analysis tool even when it is a bad one for the job.

The core question is the starting point. It is made easier to solve by decomposing it into a few, more specific sub-questions. The logic of decomposition is such that the answers to these sub-questions should together fully answer the question they emerge from. The first level of sub-questions may still be too broad to solve with specific analyses and data, so each is decomposed further.

The process of decomposition continues until a sub-question is reached that can be answered using a particular technique or framework, and the data needed is specific enough to be identified. A Question Tree is thus constructed, and the final set of questions indicates the analyses and data needed. As much as possible, the questions on the tree are also framed such that they have “yes” or “no” as potential answers.

They, too, are hypotheses to be settled with data, analysis, and evidence. They can also be used to test assumptions and beliefs, evaluate expectations, explore puzzles and oddities, and generate solution options.

In decomposing a question, ask whether the sub-questions are mutually exclusive and collectively exhaustive. This can help generate the sub-question not asked, and thus, reduce errors of omission. Building a Question Tree is an iterative and nonlinear process. If later information so dictates, previously done work on the tree should be adjusted.

Judgment plays a role in building a Question Tree, so it is unlikely that two people working independently on a complex starting question will create identical trees, but these are bound to overlap. Expertise matters and the strength of teams should be leveraged.

Success and Cause Trees

These are variations of the fault tree analysis: a Success Tree where the top event is desired and a Cause Tree used to investigate a past event as part of root cause analysis.