One of the many fascinating items in the recent Warning Letter to Sanofi is the FDA’s direction to provide a plan to perform “timely technological upgrades to the equipment/facility infrastructure.” This point drives home the point that staying current with technological advancements is crucial for maintaining compliance, improving efficiency, and ensuring product quality. Yet, I think it is fair to say we rarely see it this bluntly put as a requirement.
One of the many reasons this Warning Letter stands out is that this is (as far as I can tell) the same facility that won the ISPE’s Facility of the Year award in 2020. This means it is still a pretty new facility, and since it is one of the templates that many single-use biotech manufacturing facilities are based on, we had best pay attention. If a failure to maintain a state-of-the-art facility can contribute to this sort of Warning Letter, then many companies had best be paying close attention. There is a lot to unpack and learn here.
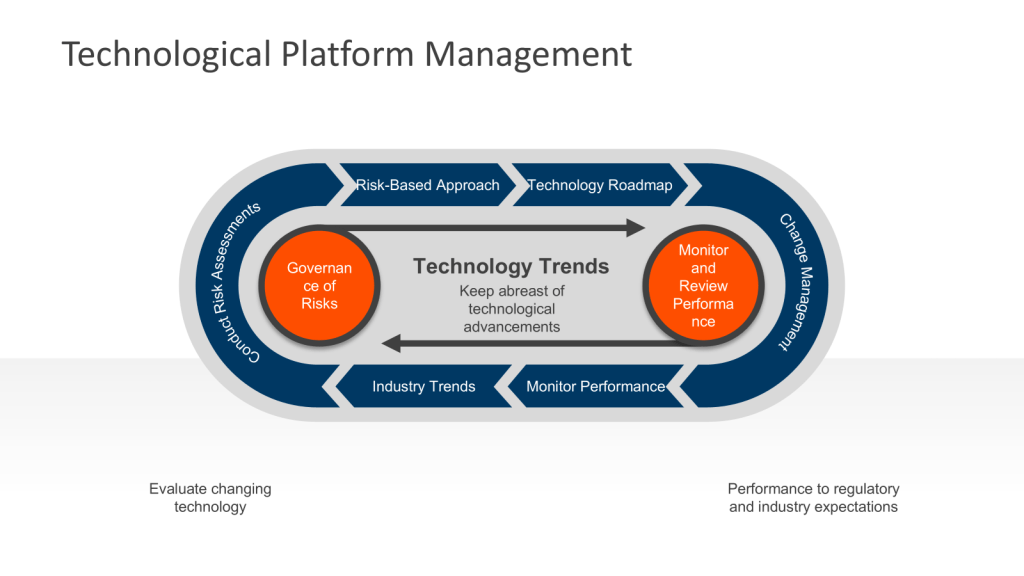
Establishing an Ongoing Technology Platform Process
To meet regulatory requirements and industry standards, facilities should implement a systematic approach to technological upgrades.
1. Conduct Regular Assessments
At least annually, perform comprehensive evaluations of your facility’s equipment, systems, and processes. This assessment should include:
Prioritize upgrades based on their potential impact on product quality, patient safety, and regulatory compliance. Utilize living risk assessments to get a sense of where issues are developing. These should be the evolution of the risk management that built the facility.
4. Create a Technology Roadmap
Develop a long-term plan for implementing upgrades, considering:
Budget constraints and return on investment
Regulatory timelines for submissions and approvals
Production schedules and potential downtime
Integration with existing systems and processes
5. Implement Change Management Procedures
Ensure there is a robust change management process in place to ensure that upgrades are implemented safely and effectively. This should include:
Detailed documentation of proposed changes
Impact assessments on product quality and regulatory compliance
6. Appropriate Verification – Commissioning, Qualification and Validation
Conduct thorough verification activities to demonstrate that the upgraded equipment or systems meet predetermined specifications and regulatory requirements.
7. Monitor and Review Performance
Continuously monitor the performance of upgraded systems and equipment to ensure they meet expectations and comply with cGMP requirements. Conduct periodic reviews to identify any necessary adjustments or further improvements. This is all part of Stage 3 of the FDA’s process validation model focusing on ongoing assurance that the process remains in a state of control during routine commercial manufacture. This stage is designed to:
Anticipate and prevent issues before they occur
Detect unplanned deviations from the process
Identify and correct problems
Leveraging Advanced Technologies
To stay ahead of regulatory expectations and industry trends, consider incorporating advanced technologies into your upgrade plans:
Single-Use Systems (SUS): Implement disposable components to reduce cleaning and validation requirements while improving flexibility.
Modern Microbial Methods (MMM): Implement advanced techniques used in microbiology that offer significant advantages over traditional culture-based methods
Process Analytical Technology (PAT): Integrate real-time monitoring and control systems to enhance product quality and process understanding.
Data Analytics and Artificial Intelligence: Implement advanced data analysis tools to identify trends, predict maintenance needs, and optimize processes.
Conclusion
Maintaining a state-of-the-art biotech facility requires a proactive and systematic approach to technological upgrades. By establishing an ongoing process for identifying and implementing improvements, facilities can ensure compliance with FDA requirements, align with industry standards, and stay competitive in the rapidly evolving biotech landscape.
Remember that the goal is not just to meet current regulatory expectations but to anticipate future requirements and position your facility at the forefront of biotech manufacturing excellence. By following this comprehensive approach and staying informed on industry developments, you can create a robust, flexible, and compliant manufacturing environment that supports the production of high-quality biopharmaceutical products.
A key KPI for a FUSE program is Overall Equipment Effectiveness (OEE) which measures the efficiency and productivity of equipment and production processes.
Definition of OEE
OEE is a percentage that represents the proportion of truly productive manufacturing time. It takes into account three main factors:
Availability: The ratio of Run Time to Planned Production Time. It takes into account any events that stop planned production for an appreciable length of time.
Performance: Anything that causes the manufacturing process to run at less than the maximum possible efficiency when it is running.
Quality: Manufactured material that do not meet quality standards, including materialthat require rework and reprocessing.
The formula for calculating OEE is:
OEE = Availability × Performance × Quality
Components of OEE
Availability
Availability measures the percentage of scheduled time that the equipment is available to operate. It accounts for downtime losses.
Availability = Run Time / Planned Production Time
Performance
Performance compares the actual output of equipment to its theoretical maximum output at optimal speed.
Performance = (Ideal Cycle Time × Total Count) / Run Time
Quality
Quality represents the percentage of released material produced out of the total material produced.
Quality = Good Count / Total Count
Importance of OEE
OEE is crucial for several reasons:
It provides a comprehensive view of manufacturing productivity.
It helps identify losses and areas for improvement.
It serves as a benchmark for comparing performance across different equipment or production lines.
It supports continuous improvement initiatives.
Interpreting OEE Scores
While OEE scores can vary by industry, generally:
100% OEE is perfect production
85% is considered world-class
60% is fairly typical
40% is low but not uncommon for companies just starting to measure OEE
Benefits of Tracking OEE
Identifies hidden capacity in manufacturing operations
Reduces manufacturing costs
Improves quality control
Increases equipment longevity through better maintenance practices
Enhances decision-making with data-driven insights
By focusing on OEE, manufacturers can significantly enhance their productivity, reduce waste, and improve their bottom line. It’s a powerful metric that provides actionable insights for optimizing manufacturing processes.
How strongly does this metric connect to business objectives?
5
Empirically Direct – Data proves the metric directly supports at least one business objective – the ability to meet client requirements
Measurability
How much effort would it take to track this metric?
3
Medium – Data exists but in a variety of spreadsheets systems, minor collection or measurement challenges may exist. Will need to agree on what certain aspects of data means.
Precision
How often and by what margin does the metric change?
5
Once we agree on the metric and how to measure it, it should be Highly Predictable
Actionability
Can we clearly articulate actions we would take in response to this metric?
4
Some consensus on action, and capability currently exists to take action. This metric will be used to drive consensus.
Presence of Baseline
Does internal or external baseline data exist to indicate good/poor performance for this metric?
3
Baseline must be based on incomplete or directional data. Quite frankly, the site is just qualified and there will be a rough patch.
This tells me this is a strong metric that requires a fair amount of work to implement. It is certainly going into the Metrics Plan.
A Deeper Dive into Equipment Availability
Equipment availability metric measures the proportion of time a piece of equipment or machinery is operational and ready for production compared to the total planned production time. It is a key component of Overall Equipment Effectiveness (OEE), along with Performance and Quality.
This metric directly impacts production capacity and throughput with a high availability indicating efficient maintenance practices and equipment reliability. This metric helps identify areas for improvement in operations and maintenance.
Definition and Calculation
Equipment availability is expressed as a percentage and calculated using the following formula:
Availability (%) = (Actual Operation Time / Planned Production Time) × 100
Where:
Actual Operation Time = Planned Production Time – Total Downtime
Planned Production Time = Total Time – Planned Downtime
For example, if a machine is scheduled to run for 8 hours but experiences 1 hour of unplanned downtime:
To increase equipment availability, consider the following strategies:
Implement preventive and predictive maintenance programs.
Optimize changeover procedures and reduce setup times.
Enhance operator training to improve equipment handling and minor maintenance skills.
Use real-time monitoring systems to quickly identify and address issues.
Analyze root causes of downtime and implement targeted improvements.
Incorporate fault tolerance at the equipment design stage.
Create asset-specific maintenance programs.
Relationship to Other Metrics
Equipment availability is closely related to other important manufacturing metrics:
It’s one of the three components of OEE, alongside Performance and Quality.
It’s distinct from but related to equipment reliability, which measures the probability of failure-free operation.
It impacts overall plant efficiency and productivity.
By focusing on improving equipment availability, manufacturers can enhance their overall operational efficiency, reduce costs, and increase production capacity. Regular monitoring and analysis of this metric can provide valuable insights for continuous improvement initiatives in manufacturing processes.
To generate an equipment availability KPI in process manufacturing, you should follow these steps:
Calculate Equipment Availability
The basic formula for equipment availability is:
Availability = Run Time / Planned Production Time
Where:
Run Time = Planned Production Time – Downtime
Planned Production Time = Total Time – Planned Downtime
For example, if a machine is scheduled to run for 8 hours, but has 1 hour of unplanned downtime:
To calculate availability accurately, you need to track:
Total available time
Planned downtime (e.g. scheduled maintenance)
Unplanned downtime (e.g. breakdowns)
Actual production time
Implement Data Collection Systems
Use automated data collection systems like machine monitoring software or manufacturing execution systems (MES) to capture accurate, real-time data on equipment status and downtime.
Analyze Root Causes
Categorize and analyze causes of downtime to identify improvement opportunities. Common causes include:
Equipment failures
Changeovers/setups
Material shortages
Operator availability
Set Targets and Monitor Trends
Set realistic availability targets based on industry benchmarks and your current performance
Track availability over time to identify trends and measure improvement efforts
Compare availability across equipment and production lines
Take Action to Improve Availability
Implement preventive and predictive maintenance programs
Optimize changeover procedures
Improve operator training
Address chronic equipment issues
Use Digital Tools
Leverage technologies like IoT sensors, cloud analytics, and digital twins to gain deeper insights into equipment performance and predict potential failures.
Planned Production Time
Planned production time is the total amount of time scheduled for production activities, excluding planned downtime. It represents the time during which equipment or production lines are expected to be operational and producing goods. It can be rather tricky to agree on the exact meaning.
Calculation
The basic formula for planned production time is:
Planned Production Time = Total Time – Planned Downtime
Where:
Total Time is the entire time period being considered (e.g., a shift, day, week, or month)
Planned Downtime includes scheduled maintenance, changeovers, and other planned non-productive activities
Components of Planned Production Time
Total Time
This is the full duration of the period being analyzed, such as:
A single 8-hour shift
A 24-hour day
A 7-day week
A 30-day month
Planned Downtime
This includes all scheduled non-productive time, such as:
Preventive maintenance
Scheduled breaks
Shift changes
Planned changeovers between batches
Cleaning and sanitation procedures
Considerations for Batch Manufacturing
In batch production, several factors affect planned production time:
Batch Changeovers: Time allocated for switching between different product batches must be accounted for as planned downtime.
Equipment Setup: The time required to configure machinery for each new batch should be included in planned downtime.
Quality Checks: Time for quality control procedures between batches may be considered part of planned production time or planned downtime, depending on the specific process.
Cleaning Procedures: Time for cleaning equipment between batches is typically considered planned downtime.
Material Handling: Time for loading raw materials and unloading finished products between batches may be part of planned production time or downtime, based on the specific process.
Example Calculation
Let’s consider a single 8-hour shift in a batch manufacturing facility: