If the history of pharmaceutical quality management were written as a geological timeline, 2025 would hopefully mark the end of the Holocene of Compliance—a long, stable epoch where “following the procedure” was sufficient to ensure survival—and the beginning of the Anthropocene of Complexity.
For decades, our industry has operated under a tacit social contract. We agreed to pretend that “compliance” was synonymous with “quality.” We agreed to pretend that a validated method would work forever because we proved it worked once in a controlled protocol three years ago. We agreed to pretend that “zero deviations” meant “perfect performance,” rather than “blind surveillance.” We agreed to pretend that if we wrote enough documents, reality would conform to them.
If I had my wish 2025 would be the year that contract finally dissolved.
Throughout the year—across dozens of posts, technical analyses, and industry critiques on this blog—I have tried to dismantle the comfortable illusions of “Compliance Theater” and show how this theater collides violently with the unforgiving reality of complex systems.
The connecting thread running through every one of these developments is the concept I have returned to obsessively this year: Falsifiable Quality.
This Year in Review is not merely a summary of blog posts. It is an attempt to synthesize the fragmented lessons of 2025 into a coherent argument. The argument is this: A quality system that cannot be proven wrong is a quality system that cannot be trusted.
If our systems—our validation protocols, our risk assessments, our environmental monitoring programs—are designed only to confirm what we hope is true (the “Happy Path”), they are not quality systems at all. They are comfort blankets. And 2025 was the year we finally started pulling the blanket off.
The Philosophy of Doubt
(Reflecting on: The Effectiveness Paradox, Sidney Dekker, and Gerd Gigerenzer)
Before we dissect the technical failures of 2025, let me first establish the philosophical framework that defined this year’s analysis.
In August, I published “The Effectiveness Paradox: Why ‘Nothing Bad Happened’ Doesn’t Prove Your Quality System Works.” It became one of the most discussed posts of the year because it attacked the most sacred metric in our industry: the trend line that stays flat.
We are conditioned to view stability as success. If Environmental Monitoring (EM) data shows zero excursions for six months, we throw a pizza party. If a method validation passes all acceptance criteria on the first try, we commend the development team. If a year goes by with no Critical deviations, we pay out bonuses.
But through the lens of Falsifiable Quality—a concept heavily influenced by the philosophy of Karl Popper, the challenging insights of Deming, and the safety science of Sidney Dekker, whom we discussed in November—these “successes” look suspiciously like failures of inquiry.
The Problem with Unfalsifiable Systems
Karl Popper famously argued that a scientific theory is only valid if it makes predictions that can be tested and proven false. “All swans are white” is a scientific statement because finding one black swan falsifies it. “God is love” is not, because no empirical observation can disprove it.
In 2025, I argued that most Pharmaceutical Quality Systems (PQS) are designed to be unfalsifiable.
- The Unfalsifiable Alert Limit: We set alert limits based on historical averages + 3 standard deviations. This ensures that we only react to statistical outliers, effectively blinding us to gradual drift or systemic degradation that remains “within the noise.”
- The Unfalsifiable Robustness Study: We design validation protocols that test parameters we already know are safe (e.g., pH +/- 0.1), avoiding the “cliff edges” where the method actually fails. We prove the method works where it works, rather than finding where it breaks.
- The Unfalsifiable Risk Assessment: We write FMEAs where the conclusion (“The risk is acceptable”) is decided in advance, and the RPN scores are reverse-engineered to justify it.
This is “Safety Theater,” a term Dekker uses to describe the rituals organizations perform to look safe rather than be safe.
Safety-I vs. Safety-II
In November’s post “Sidney Dekker: The Safety Scientist Who Influences How I Think About Quality,“ I explored Dekker’s distinction between Safety-I (minimizing things that go wrong) and Safety-II (understanding how things usually go right).
Traditional Quality Assurance is obsessed with Safety-I. We count deviations. We count OOS results. We count complaints. When those counts are low, we assume the system is healthy.
But as the LeMaitre Vascular warning letter showed us this year (discussed in Part III), a system can have “zero deviations” simply because it has stopped looking for them. LeMaitre had excellent water data—because they were cleaning the valves before they sampled them. They were measuring their ritual, not their water.
Falsifiable Quality is the bridge to Safety-II. It demands that we treat every batch record not as a compliance artifact, but as a hypothesis test.
- Hypothesis: “The contamination control strategy is effective.”
- Test: Aggressive monitoring in worst-case locations, not just the “representative” center of the room.
- Result: If we find nothing, the hypothesis survives another day. If we find something, we have successfully falsified the hypothesis—which is a good thing because it reveals reality.
The shift from “fearing the deviation” to “seeking the falsification” is a cultural pivot point of 2025.
The Epistemological Crisis in the Lab (Method Validation)
(Reflecting on: USP <1225>, Method Qualification vs. Validation, and Lifecycle Management)
Nowhere was the battle for Falsifiable Quality fought more fiercely in 2025 than in the analytical laboratory.
The proposed revision to USP <1225> Validation of Compendial Procedures (published in Pharmacopeial Forum 51(6)) arrived late in the year, but it serves as the perfect capstone to the arguments I’ve been making since January.
For forty years, analytical validation has been the ultimate exercise in “Validation as an Event.” You develop a method. You write a protocol. You execute the protocol over three days with your best analyst and fresh reagents. You print the report. You bind it. You never look at it again.
This model is unfalsifiable. It assumes that because the method worked in the “Work-as-Imagined” conditions of the validation study, it will work in the “Work-as-Done” reality of routine QC for the next decade.
The Reportable Result: Validating Decisions, Not Signals
The revised USP <1225>—aligned with ICH Q14(Analytical Procedure Development) and USP <1220> (The Lifecycle Approach)—destroys this assumption. It introduces concepts that force falsifiability into the lab.
The most critical of these is the Reportable Result.
Historically, we validated “the instrument” or “the measurement.” We proved that the HPLC could inject the same sample ten times with < 1.0% RSD.
But the Reportable Result is the final value used for decision-making—the value that appears on the Certificate of Analysis. It is the product of a complex chain: Sampling -> Transport -> Storage -> Preparation -> Dilution -> Injection -> Integration -> Calculation -> Averaging.
Validating the injection precision (the end of the chain) tells us nothing about the sampling variability (the beginning of the chain).
By shifting focus to the Reportable Result, USP <1225> forces us to ask: “Does this method generate decisions we can trust?”
The Replication Strategy: Validating “Work-as-Done”
The new guidance insists that validation must mimic the replication strategy of routine testing.
If your SOP says “We report the average of 3 independent preparations,” then your validation must evaluate the precision and accuracy of that average, not of the individual preparations.
This seems subtle, but it is revolutionary. It prevents the common trick of “averaging away” variability during validation to pass the criteria, only to face OOS results in routine production because the routine procedure doesn’t use the same averaging scheme.
It forces the validation study to mirror the messy reality of the “Work-as-Done,” making the validation data a falsifiable predictor of routine performance, rather than a theoretical maximum capability.
Method Qualification vs. Validation: The June Distinction
I wrote “Method Qualification and Validation,” clarifying a distinction that often confuses the industry.
- Qualification is the “discovery phase” where we explore the method’s limits. It is inherently falsifiable—we want to find where the method breaks.
- Validation has traditionally been the “confirmation phase” where we prove it works.
The danger, as I noted in that post, is when we skip the falsifiable Qualification step and go straight to Validation. We write the protocol based on hope, not data.
USP <1225> essentially argues that Validation must retain the falsifiable spirit of Qualification. It is not a coronation; it is a stress test.
The Death of “Method Transfer” as We Know It
In a Falsifiable Quality system, a method is never “done.” The Analytical Target Profile (ATP)—a concept from ICH Q14 that permeates the new thinking—is a standing hypothesis: “This method measures Potency within +/- 2%.”
Every time we run a system suitability check, every time we run a control standard, we are testing that hypothesis.
If the method starts drifting—even if it still passes broad system suitability limits—a falsifiable system flags the drift. An unfalsifiable system waits for the OOS.
The draft revision of USP <1225> is a call to arms. It asks us to stop treating validation as a “ticket to ride”—a one-time toll we pay to enter GMP compliance—and start treating it as a “ticket to doubt.” Validation gives us permission to use the method, but only as long as the data continues to support the hypothesis of fitness.
The Reality Check (The “Unholy Trinity” of Warning Letters)
Philosophy and guidelines are fine, but in 2025, reality kicked in the door. The regulatory year was defined by three critical warning letters—Sanofi, LeMaitre, and Rechon—that collectively dismantled the industry’s illusions of control.
It began, as these things often do, with a ghost from the past.
Sanofi Framingham: The Pendulum Swings Back
(Reflecting on: Failure to Investigate Critical Deviations and The Sanofi Warning Letter)
The year opened with a shock. On January 15, 2025, the FDA issued a warning letter to Sanofi’s Framingham facility—the sister site to the legacy Genzyme Allston landing, whose consent decree defined an entire generation of biotech compliance and of my career.
In my January analysis (“Failure to Investigate Critical Deviations: A Cautionary Tale“), I noted that the FDA’s primary citation was a failure to “thoroughly investigate any unexplained discrepancy.”
This is the cardinal sin of Falsifiable Quality.
An “unexplained discrepancy” is a signal from reality. It is the system telling you, “Your hypothesis about this process is wrong.”
- The Falsifiable Response: You dive into the discrepancy. You assume your control strategy missed something. You use Causal Reasoning (the topic of my May post) to find the mechanism of failure.
- The Sanofi Response: As the warning letter detailed, they frequently attributed failures to “isolated incidents” or superficial causes without genuine evidence.
This is the “Refusal to Falsify.” By failing to investigate thoroughly, the firm protects the comfortable status quo. They choose to believe the “Happy Path” (the process is robust) over the evidence (the discrepancy).
The Pendulum of Compliance
In my companion post (“Sanofi Warning Letter”), I discussed the “pendulum of compliance.” The Framingham site was supposed to be the fortress of quality, built on the lessons of the Genzyme crisis.
The failure at Sanofi wasn’t a lack of SOPs; it was a lack of curiosity.
The investigators likely had checklists, templates, and timelines (Compliance Theater), but they lacked the mandate—or perhaps the Expertise —to actually solve the problem.
This set the thematic stage for the rest of 2025. Sanofi showed us that “closing the deviation” is not the same as fixing the problem. This insight led directly into my August argument in “The Effectiveness Paradox“: You can close 100% of your deviations on time and still have a manufacturing process that is spinning out of control.
If Sanofi was the failure of investigation (looking back), Rechon and LeMaitre were failures of surveillance (looking forward). Together, they form a complete picture of why unfalsifiable systems fail.
Reflecting on: Rechon Life Science and LeMaitre Vascular
Philosophy and guidelines are fine, but in September, reality kicked in the door.
Two warning letters in 2025—Rechon Life Science (September) and LeMaitre Vascular (August)—provided brutal case studies in what happens when “representative sampling” is treated as a buzzword rather than a statistical requirement.
Rechon Life Science: The Map vs. The Territory
The Rechon Life Science warning letter was a significant regulatory signal of 2025 regarding sterile manufacturing. It wasn’t just a list of observations; it was an indictment of unfalsifiable Contamination Control Strategies (CCS).
We spent 2023 and 2024 writing massive CCS documents to satisfy Annex 1. Hundreds of pages detailing airflows, gowning procedures, and material flows. We felt good about them. We felt “compliant.”
Then the FDA walked into Rechon and essentially asked: “If your CCS is so good, why does your smoke study show turbulence over the open vials?”
The warning letter highlighted a disconnect I’ve called “The Map vs. The Territory.”
- The Map: The CCS document says the airflow is unidirectional and protects the product.
- The Territory: The smoke study video shows air eddying backward from the operator to the sterile core.
In an unfalsifiable system, we ignore the smoke study (or film it from a flattering angle) because it contradicts the CCS. We prioritize the documentation (the claim) over the observation (the evidence).
In a falsifiable system, the smoke study is the test. If the smoke shows turbulence, the CCS is falsified. We don’t defend the CCS; we rewrite it. We redesign the line.
The FDA’s critique of Rechon’s “dynamic airflow visualization” was devastating because it showed that Rechon was using the smoke study as a marketing video, not a diagnostic tool. They filmed “representative” operations that were carefully choreographed to look clean, rather than the messy reality of interventions.
LeMaitre Vascular: The Sin of “Aspirational Data”
If Rechon was about air, LeMaitre Vascular (analyzed in my August post “When Water Systems Fail“) was about water. And it contained an even more egregious sin against falsifiability.
The FDA observed that LeMaitre’s water sampling procedures required cleaning and purging the sample valves before taking the sample.
Let’s pause and consider the epistemology of this.
- The Goal: To measure the quality of the water used in manufacturing.
- The Reality: Manufacturing operators do not purge and sanitize the valve for 10 minutes before filling the tank. They open the valve and use the water.
- The Sample: By sanitizing the valve before sampling, LeMaitre was measuring the quality of the sampling process, not the quality of the water system.
I call this “Aspirational Data.” It is data that reflects the system as we wish it existed, not as it actually exists. It is the ultimate unfalsifiable metric. You can never find biofilm in a valve if you scrub the valve with alcohol before you open it.
The FDA’s warning letter was clear: “Sampling… must include any pathway that the water travels to reach the process.”
LeMaitre also performed an unauthorized “Sterilant Switcheroo,” changing their sanitization agent without change control or biocompatibility assessment. This is the hallmark of an unfalsifiable culture: making changes based on convenience, assuming they are safe, and never designing the study to check if that assumption is wrong.
The “Representative” Trap
Both warning letters pivot on the misuse of the word “representative.”
Firms love to claim their EM sampling locations are “representative.” But representative of what? Usually, they are representative of the average condition of the room—the clean, empty spaces where nothing happens.
But contamination is not an “average” event. It is a specific, localized failure. A falsifiable EM program places probes in the “worst-case” locations—near the door, near the operator’s hands, near the crimping station. It tries to find contamination. It tries to falsify the claim that the zone is sterile, asceptic or bioburden reducing.
When Rechon and LeMaitre failed to justify their sampling locations, they were guilty of designing an unfalsifiable experiment. They placed the “microscope” where they knew they wouldn’t find germs.
2025 taught us that regulators are no longer impressed by the thickness of the CCS binder. They are looking for the logic of control. They are testing your hypothesis. And if you haven’t tested it yourself, you will fail.
The Investigation as Evidence
(Reflecting on: The Golden Start to a Deviation Investigation, Causal Reasoning, Take-the-Best Heuristics, and The Catalent Case)
If Rechon, LeMaitre, and Sanofi teach us anything, it is that the quality system’s ability to discover failure is more important than its ability to prevent failure.
A perfect manufacturing process that no one is looking at is indistinguishable from a collapsing process disguised by poor surveillance. But a mediocre process that is rigorously investigated, understood, and continuously improved is a path toward genuine control.
The investigation itself—how we respond to a deviation, how we reason about causation, how we design corrective actions—is where falsifiable quality either succeeds or fails.
The Golden Day: When Theory Meets Work-as-Done
In April, I published “The Golden Start to a Deviation Investigation,” which made a deceptively simple argument: The first 24 hours after a deviation is discovered are where your quality system either commits to discovering truth or retreats into theater.
This argument sits at the heart of falsifiable quality.
When a deviation occurs, you have a narrow window—what I call the “Golden Day”—where evidence is fresh, memories are intact, and the actual conditions that produced the failure still exist. If you waste this window with vague problem statements and abstract discussions, you permanently lose the ability to test causal hypotheses later.
The post outlined a structured protocol:
First, crystallize the problem. Not “potency was low”—but “Lot X234, potency measured at 87% on January 15th at 14:32, three hours after completion of blending in Vessel C-2.” Precision matters because only specific, bounded statements can be falsified. A vague problem statement can always be “explained away.”
Second, go to the Gemba. This is the antidote to “work-as-imagined” investigation. The SOP says the temperature controller should maintain 37°C +/- 2°C. But the Gemba walk reveals that the probe is positioned six inches from the heating element, the data logger is in a recessed pocket where humidity accumulates, and the operator checks it every four hours despite a requirement to check hourly. These are the facts that predict whether the deviation will recur.
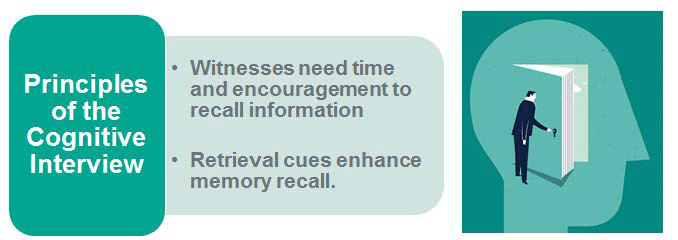
Third, interview with cognitive discipline. Most investigations fail not because investigators lack information, but because they extract information poorly. Cognitive interviewing—developed by the FBI and the National Transportation Safety Board—uses mental reinstatement, multiple perspectives, and sequential reordering to access accurate recall rather than confabulated narrative. The investigator asks the operator to walk through the event in different orders, from different viewpoints, each time triggering different memory pathways. This is not “soft” technique; it is a mechanism for generating falsifiable evidence.
The Golden Day post makes it clear: You do not investigate deviations to document compliance. You investigate deviations to gather evidence about whether your understanding of the process is correct.
Causal Reasoning: Moving Beyond “What Was Missing”
Most investigation tools fail not because they are flawed, but because they are applied with the wrong mindset. In my May post “Causal Reasoning: A Transformative Approach to Root Cause Analysis,” I argued that pharmaceutical investigations are often trapped in “negative reasoning.”
Negative reasoning asks: “What barrier was missing? What should have been done but wasn’t?” This mindset leads to unfalsifiable conclusions like “Procedure not followed” or “Training was inadequate.” These are dead ends because they describe the absence of an ideal, not the presence of a cause.
Causal reasoning flips the script. It asks: “What was present in the system that made the observed outcome inevitable?”
Instead of settling for “human error,” causal reasoning demands we ask: What environmental cues made the action sensible to the operator at that moment? Were the instructions ambiguous? Did competing priorities make compliance impossible? Was the process design fragile?
This shift transforms the investigation from a compliance exercise into a scientific inquiry.
Consider the LeMaitre example:
- Negative Reasoning: “Why didn’t they sample the true condition?” Answer: “Because they didn’t follow the intent of the sampling plan.”
- Causal Reasoning: “What made the pre-cleaning practice sensible to them?” Answer: “They believed it ensured sample validity by removing valve residue.”
By understanding the why, we identify a knowledge gap that can be tested and corrected, rather than a negligence gap that can only be punished.
In September, “Take-the-Best Heuristic for Causal Investigation” provided a practical framework for this. Instead of listing every conceivable cause—a process that often leads to paralysis—the “Take-the-Best” heuristic directs investigators to focus on the most information-rich discriminators. These are the factors that, if different, would have prevented the deviation. This approach focuses resources where they matter most, turning the investigation into a targeted search for truth.
CAPA: Predictions, Not Promises
The Sanofi warning letter—analyzed in January—showed the destination of unfalsifiable investigation: CAPAs that exist mainly as paperwork.
Sanofi had investigation reports. They had “corrective actions.” But the FDA noted that deviations recurred in similar patterns, suggesting that the investigation had identified symptoms, not mechanisms, and that the “corrective” action had not actually addressed causation.
This is the sin of treating CAPA as a promise rather than a hypothesis.
A falsifiable CAPA is structured as an explicit prediction: “If we implement X change, then Y undesirable outcome will not recur under conditions Z.”
This can be tested. If it fails the test, the CAPA itself becomes evidence—not of failure, but of incomplete causal understanding. Which is valuable.
In the Rechon analysis, this showed up concretely: The FDA’s real criticism was not just that contamination was found; it was that Rechon’s Contamination Control Strategy had no mechanism to falsify itself. If the CCS said “unidirectional airflow protects the product,” and smoke studies showed bidirectional eddies, the CCS had been falsified. But Rechon treated the falsification as an anomaly to be explained away, rather than evidence that the CCS hypothesis was wrong.
A falsifiable organization would say: “Our CCS predicted that Grade A in an isolator with this airflow pattern would remain sterile. The smoke study proves that prediction wrong. Therefore, the CCS is false. We redesign.”
Instead, they filmed from a different angle and said the aerodynamics were “acceptable.”
Knowledge Integration: When Deviations Become the Curriculum
The final piece of falsifiable investigation is what I call “knowledge integration.” A single deviation is a data point. But across the organization, deviations should form a curriculum about how systems actually fail.
Sanofi’s failure was not that they investigated each deviation badly (though they did). It was that they investigated them in isolation. Each deviation closed on its own. Each CAPA addressed its own batch. There was no organizational learning—no mechanism for a pattern of similar deviations to trigger a hypothesis that the control strategy itself was fundamentally flawed.
This is where the Catalent case study, analyzed in September’s “When 483s Reveal Zemblanity,” becomes instructive. Zemblanity is the opposite of serendipity: the seemingly random recurrence of the same failure through different paths. Catalent’s 483 observations were not isolated mistakes; they formed a pattern that revealed a systemic assumption (about equipment capability, about environmental control, about material consistency) that was false across multiple products and locations.
A falsifiable quality system catches zemblanity early by:
- Treating each deviation as a test of organizational hypotheses, not as an isolated incident.
- Trending deviation patterns to detect when the same causal mechanism is producing failures across different products, equipment, or operators.
- Revising control strategies when patterns falsify the original assumptions, rather than tightening parameters at the margins.
The Digital Hallucination (CSA, AI, and the Expertise Crisis)
(Reflecting on: CSA: The Emperor’s New Clothes, Annex 11, and The Expertise Crisis)
While we battled microbes in the cleanroom, a different battle was raging in the server room. 2025 was the year the industry tried to “modernize” validation through Computer Software Assurance (CSA) and AI, and in many ways, it was the year we tried to automate our way out of thinking.
CSA: The Emperor’s New Validation Clothes
In September, I published “Computer System Assurance: The Emperor’s New Validation Clothes,” a critique of the the contortions being made around the FDA’s guidance. The narrative sold by consultants for years was that traditional Computer System Validation (CSV) was “broken”—too much documentation, too much testing—and that CSA was a revolutionary new paradigm of “critical thinking.”
My analysis showed that this narrative is historically illiterate.
The principles of CSA—risk-based testing, leveraging vendor audits, focusing on intended use—are not new. They are the core principles of GAMP5 and have been applied for decades now.
The industry didn’t need a new guidance to tell us to use critical thinking; we had simply chosen not to use the critical thinking tools we already had. We had chosen to apply “one-size-fits-all” templates because they were safe (unfalsifiable).
The CSA guidance is effectively the FDA saying: “Please read the GAMP5 guide you claimed to be following for the last 15 years.”
The danger of the “CSA Revolution” narrative is that it encourages a swing to the opposite extreme: “Unscripted Testing” that becomes “No Testing.”
In a falsifiable system, “unscripted testing” is highly rigorous—it is an expert trying to break the software (“Ad Hoc testing”). But in an unfalsifiable system, “unscripted testing” becomes “I clicked around for 10 minutes and it looked fine.”
The Expertise Crisis: AI and the Death of the Apprentice
This leads directly to the Expertise Crisis. In September, I wrote “The Expertise Crisis: Why AI’s War on Entry-Level Jobs Threatens Quality’s Future.” This was perhaps the most personal topic I covered this year, because it touches on the very survival of our profession.
We are rushing to integrate Artificial Intelligence (AI) into quality systems. We have AI writing deviations, AI drafting SOPs, AI summarizing regulatory changes. The efficiency gains are undeniable. But the cost is hidden, and it is epistemological.
Falsifiability requires expertise.
To falsify a claim—to look at a draft investigation report and say, “No, that conclusion doesn’t follow from the data”—you need deep, intuitive knowledge of the process. You need to know what a “normal” pH curve looks like so you can spot the “abnormal” one that the AI smoothed over.
Where does that intuition come from? It comes from the “grunt work.” It comes from years of reviewing batch records, years of interviewing operators, years of struggling to write a root cause analysis statement.
The Expertise Crisis is this: If we give all the entry-level work to AI, where will the next generation of Quality Leaders come from?
- The Junior Associate doesn’t review the raw data; the AI summarizes it.
- The Junior Associate doesn’t write the deviation; the AI generates the text.
- Therefore, the Junior Associate never builds the mental models necessary to critique the AI.
The Loop of Unfalsifiable Hallucination
We are creating a closed loop of unfalsifiability.
- The AI generates a plausible-sounding investigation report.
- The human reviewer (who has been “de-skilled” by years of AI reliance) lacks the deep expertise to spot the subtle logical flaw or the missing data point.
- The report is approved.
- The “hallucination” becomes the official record.
In a falsifiable quality system, the human must remain the adversary of the algorithm. The human’s job is to try to break the AI’s logic, to check the citations, to verify the raw data.
But in 2025, we saw the beginnings of a “Compliance Autopilot”—a desire to let the machine handle the “boring stuff.”
My warning in September remains urgent: Efficiency without expertise is just accelerated incompetence. If we lose the ability to falsify our own tools, we are no longer quality professionals; we are just passengers in a car driven by a statistical model that doesn’t know what “truth” is.
My post “The Missing Middle in GMP Decision Making: How Annex 22 Redefines Human-Machine Collaboration in Pharmaceutical Quality Assurance” goes a lot deeper here.
Annex 11 and Data Governance
In August, I analyzed the draft Annex 11 (Computerised Systems) in the post “Data Governance Systems: A Fundamental Shift.”
The Europeans are ahead of the FDA here. While the FDA talks about “Assurance” (testing less), the EU is talking about “Governance” (controlling more). The new Annex 11 makes it clear: You cannot validate a system if you do not control the data lifecycle. Validation is not a test script; it is a state of control.
This aligns perfectly with USP <1225> and <1220>. Whether it’s a chromatograph or an ERP system, the requirement is the same: Prove that the data is trustworthy, not just that the software is installed.
The Process as a Hypothesis (CPV & Cleaning)
(Reflecting on: Continuous Process Verification and Hypothesis Formation)
The final frontier of validation we explored in 2025 was the manufacturing process itself.
CPV: Continuous Falsification
In March, I published “Continuous Process Verification (CPV) Methodology and Tool Selection.”
CPV is the ultimate expression of Falsifiable Quality in manufacturing.
- Traditional Validation (3 Batches): “We made 3 good batches, therefore the process is perfect forever.” (Unfalsifiable extrapolation).
- CPV: “We made 3 good batches, so we have a license to manufacture, but we will statistically monitor every subsequent batch to detect drift.” (Continuous hypothesis testing).
The challenge with CPV, as discussed in the post, is that it requires statistical literacy. You cannot implement CPV if your quality unit doesn’t understand the difference between Cpk and Ppk, or between control limits and specification limits.
This circles back to the Expertise Crisis. We are implementing complex statistical tools (CPV software) at the exact moment we are de-skilling the workforce. We risk creating a “CPV Dashboard” that turns red, but no one knows why or what to do about it.
Cleaning Validation: The Science of Residue
In August, I tried to apply falsifiability to one of the most stubborn areas of dogma: Cleaning Validation.
In “Building Decision-Making with Structured Hypothesis Formation,“ I argued that cleaning validation should not be about “proving it’s clean.” It should be about “understanding why it gets dirty.”
- Traditional Approach: Swab 10 spots. If they pass, we are good.
- Hypothesis Approach: “We hypothesize that the gasket on the bottom valve is the hardest to clean. We predict that if we reduce rinse time by 1 minute, that gasket will fail.”
By testing the boundaries—by trying to make the cleaning fail—we understand the Design Space of the cleaning process.
We discussed the “Visual Inspection” paradox in cleaning: If you can see the residue, it failed. But if you can’t see it, does it pass?
Only if you have scientifically determined the Visible Residue Limit (VRL). Using “visually clean” without a validated VRL is—you guessed it—unfalsifiable.
To: Jeremiah Genest
From: Perplexity Research
Subject: Draft Content – Single-Use Systems & E&L Section
Here is a section on Single-Use Systems (SUS) and Extractables & Leachables (E&L).
I have positioned this piece to bridge the gap between “Part III: The Reality Check” (Contamination/Water) and “Part V: The Process as a Hypothesis” (Cleaning Validation).
The argument here is that by switching from Stainless Steel to Single-Use, we traded a visible risk (cleaning residue) for an invisible one (chemical migration), and that our current approach to E&L is often just “Paper Safety”—relying on vendor data that doesn’t reflect the “Work-as-Done” reality of our specific process conditions.
The Plastic Paradox (Single-Use Systems and the E&L Mirage)
If the Rechon and LeMaitre warning letters were about the failure to control biological contaminants we can find, the industry’s struggle with Single-Use Systems (SUS) in 2025 was about the chemical contaminants we choose not to find.
We have spent the last decade aggressively swapping stainless steel for plastic. The value proposition was irresistible: Eliminate cleaning validation, eliminate cross-contamination, increase flexibility. We traded the “devil we know” (cleaning residue) for the “devil we don’t” (Extractables and Leachables).
But in 2025, with the enforcement reality of USP <665> (Plastic Components and Systems) settling in, we had to confront the uncomfortable truth: Most E&L risk assessments are unfalsifiable.
The Vendor Data Trap
The standard industry approach to E&L is the ultimate form of “Compliance Theater.”
- We buy a single-use bag.
- We request the vendor’s regulatory support package (the “Map”).
- We see that the vendor extracted the film with aggressive solvents (ethanol, hexane) for 7 days.
- We conclude: “Our process uses water for 24 hours; therefore, we are safe.”
This logic is epistemologically bankrupt. It assumes that the Vendor’s Model (aggressive solvents/short time) maps perfectly to the User’s Reality (complex buffers/long duration/specific surfactants).
It ignores the fact that plastics are dynamic systems. Polymers age. Gamma irradiation initiates free radical cascades that evolve over months. A bag manufactured in January might have a different leachable profile than a bag manufactured in June, especially if the resin supplier made a “minor” change that didn’t trigger a notification.
By relying solely on the vendor’s static validation package, we are choosing not to falsify our safety hypothesis. We are effectively saying, “If the vendor says it’s clean, we will not look for dirt.”
USP <665>: A Baseline, Not a Ceiling
The full adoption of USP <665> was supposed to bring standardization. And it has—it provides a standard set of extraction conditions. But standards can become ceilings.
In 2025, I observed a troubling trend of “Compliance by Citation.” Firms are citing USP <665> compliance as proof of absence of risk, stopping the inquiry there.
A Falsifiable E&L Strategy goes further. It asks:
- “What if the vendor data is irrelevant to my specific surfactant?”
- “What if the gamma irradiation dose varied?”
- “What if the interaction between the tubing and the connector creates a new species?”
The Invisible Process Aid
We must stop viewing Single-Use Systems as inert piping. They are active process components. They are chemically reactive vessels that participate in our reaction kinetics.
When we treat them as inert, we are engaging in the same “Aspirational Thinking” that LeMaitre used on their water valves. We are modeling the system we want (pure, inert plastic), not the system we have (a complex soup of antioxidants, slip agents, and degradants).
The lesson of 2025 is that Material Qualification cannot be a paper exercise. If you haven’t done targeted simulation studies that mimic your actual “Work-as-Done” conditions, you haven’t validated the system. You’ve just filed the receipt.
The Mandate for 2026
As we look toward 2026, the path is clear. We cannot go back to the comfortable fiction of the pre-2025 era.
The regulatory environment (Annex 1, ICH Q14, USP <1225>, Annex 11) is explicitly demanding evidence of control, not just evidence of compliance. The technological environment (AI) is demanding that we sharpen our human expertise to avoid becoming obsolete. The physical environment (contamination, supply chain complexity) is demanding systems that are robust, not just rigid.
The mandate for the coming year is to build Falsifiable Quality Systems.
What does that look like practically?
- In the Lab: Implement USP <1225> logic now. Don’t wait for the official date. Validate your reportable results. Add “challenge tests” to your routine monitoring.
- In the Plant: Redesign your Environmental Monitoring to hunt for contamination, not to avoid it. If you have a “perfect” record in a Grade C area, move the plates until you find the dirt.
- In the Office: Treat every investigation as a chance to falsify the control strategy. If a deviation occurs that the control strategy said was impossible, update the control strategy.
- In the Culture: Reward the messenger. The person who finds the crack in the system is not a troublemaker; they are the most valuable asset you have. They just falsified a false sense of security.
- In Design: Embrace the “Elegant Quality System“ (discussed in May). Complexity is the enemy of falsifiability. Complex systems hide failures; simple, elegant systems reveal them.
2025 was the year we stopped pretending. 2026 must be the year we start building. We must build systems that are honest enough to fail, so that we can build processes that are robust enough to endure.
Thank you for reading, challenging, and thinking with me this year. The investigation continues.