The integration of hypothesis-driven validation with traditional worst-case testing requirements represents a fundamental evolution in how we approach pharmaceutical process validation. Rather than replacing worst-case concepts, the hypothesis-driven approach provides scientific rigor and enhanced understanding while fully satisfying regulatory expectations for challenging process conditions under extreme scenarios.
The Evolution of Worst-Case Concepts in Modern Validation
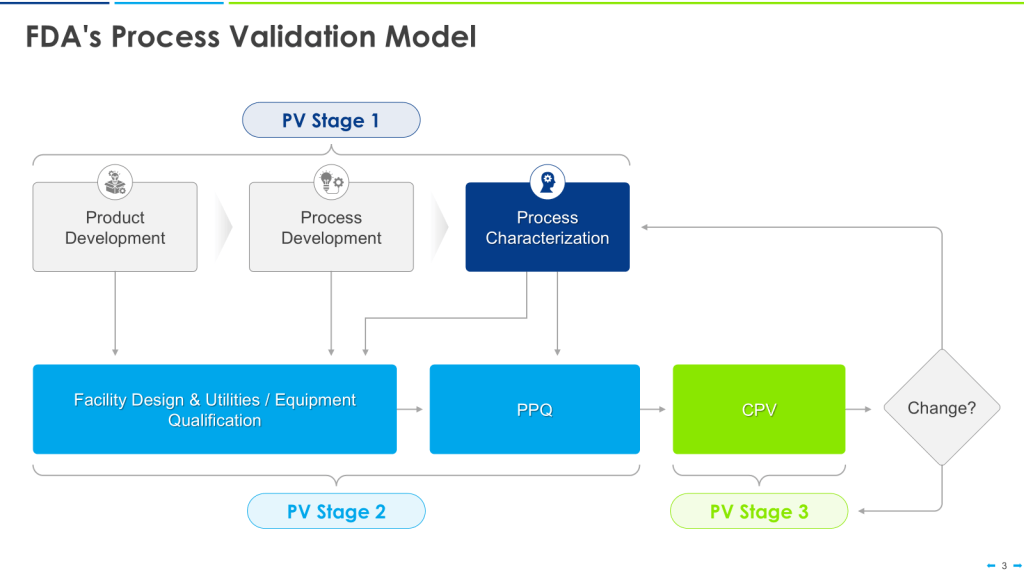
The concept of “worst-case” testing has undergone significant refinement since the original 1987 FDA guidance, which defined worst-case as “a set of conditions encompassing upper and lower limits and circumstances, including those within standard operating procedures, which pose the greatest chance of process or product failure when compared to ideal conditions”. The FDA’s 2011 Process Validation guidance shifted emphasis from conducting validation runs under worst-case conditions to incorporating worst-case considerations throughout the process design and qualification phases.
This evolution aligns perfectly with hypothesis-driven validation principles. Rather than conducting three validation batches under artificially extreme conditions that may not represent actual manufacturing scenarios, the modern lifecycle approach integrates worst-case testing throughout process development, qualification, and continued verification stages. Hypothesis-driven validation enhances this approach by making the scientific rationale for worst-case selection explicit and testable.
| Guidance/Regulation | Agency | Year Published | Page | Requirement |
|---|---|---|---|---|
| EU Annex 15 Qualification and Validation | EMA | 2015 | 5 | PPQ should include tests under normal operating conditions with worst case batch sizes |
| EU Annex 15 Qualification and Validation | EMA | 2015 | 16 | Definition: Worst Case – A condition or set of conditions encompassing upper and lower processing limits and circumstances, within standard operating procedures, which pose the greatest chance of product or process failure |
| EMA Process Validation for Biotechnology-Derived Active Substances | EMA | 2016 | 5 | Evaluation of selected step(s) operating in worst case and/or non-standard conditions (e.g. impurity spiking challenge) can be performed to support process robustness |
| EMA Process Validation for Biotechnology-Derived Active Substances | EMA | 2016 | 10 | Evaluation of purification steps operating in worst case and/or non-standard conditions (e.g. process hold times, spiking challenge) to document process robustness |
| EMA Process Validation for Biotechnology-Derived Active Substances | EMA | 2016 | 11 | Studies conducted under worst case conditions and/or non-standard conditions (e.g. higher temperature, longer time) to support suitability of claimed conditions |
| WHO GMP Validation Guidelines (Annex 3) | WHO | 2015 | 125 | Where necessary, worst-case situations or specific challenge tests should be considered for inclusion in the qualification and validation |
| PIC/S Validation Master Plan Guide (PI 006-3) | PIC/S | 2007 | 13 | Challenge element to determine robustness of the process, generally referred to as a “worst case” exercise using starting materials on the extremes of specification |
| FDA Process Validation General Principles and Practices | FDA | 2011 | Not specified | While not explicitly requiring worst case testing for PPQ, emphasizes understanding and controlling variability and process robustness |
Scientific Framework for Worst-Case Integration
Hypothesis-Based Worst-Case Definition
Traditional worst-case selection often relies on subjective expert judgment or generic industry practices. The hypothesis-driven approach transforms this into a scientifically rigorous process by developing specific, testable hypotheses about which conditions truly represent the most challenging scenarios for process performance.
For the mAb cell culture example, instead of generically testing “upper and lower limits” of all parameters, we develop specific hypotheses about worst-case interactions:
Hypothesis-Based Worst-Case Selection: The combination of minimum pH (6.95), maximum temperature (37.5°C), and minimum dissolved oxygen (35%) during high cell density phase (days 8-12) represents the worst-case scenario for maintaining both titer and product quality, as this combination will result in >25% reduction in viable cell density and >15% increase in acidic charge variants compared to center-point conditions.
This hypothesis is falsifiable and provides clear scientific justification for why these specific conditions constitute “worst-case” rather than other possible extreme combinations.
Process Design Stage Integration
ICH Q7 and modern validation approaches emphasize that worst-case considerations should be integrated during process design rather than only during validation execution. The hypothesis-driven approach strengthens this integration by ensuring worst-case scenarios are based on mechanistic understanding rather than arbitrary parameter combinations.
Design Space Boundary Testing
During process development, systematic testing of design space boundaries provides scientific evidence for worst-case identification. For example, if our hypothesis predicts that pH-temperature interactions are critical, we systematically test these boundaries to identify the specific combinations that represent genuine worst-case conditions rather than simply testing all possible parameter extremes.
Regulatory Compliance Through Enhanced Scientific Rigor
EMA Biotechnology Guidance Alignment
The EMA guidance on biotechnology-derived active substances specifically requires that “Studies conducted under worst case conditions should be performed to document the robustness of the process”. The hypothesis-driven approach exceeds these requirements by:
- Scientific Justification: Providing mechanistic understanding of why specific conditions represent worst-case scenarios
- Predictive Capability: Enabling prediction of process behavior under conditions not directly tested
- Risk-Based Assessment: Linking worst-case selection to patient safety through quality attribute impact assessment
ICH Q7 Process Validation Requirements
ICH Q7 requires that process validation demonstrate “that the process operates within established parameters and yields product meeting its predetermined specifications and quality characteristics”. The hypothesis-driven approach satisfies these requirements while providing additional value
Traditional ICH Q7 Compliance:
- Demonstrates process operates within established parameters
- Shows consistent product quality
- Provides documented evidence
Enhanced Hypothesis-Driven Compliance:
- Demonstrates process operates within established parameters
- Shows consistent product quality
- Provides documented evidence
- Explains why parameters are set at specific levels
- Predicts process behavior under untested conditions
- Provides scientific basis for parameter range justification
Practical Implementation of Worst-Case Hypothesis Testing
Cell Culture Bioreactor Example
For a CHO cell culture process, worst-case testing integration follows this structured approach:
Phase 1: Worst-Case Hypothesis Development
Instead of testing arbitrary parameter combinations, develop specific hypotheses about failure mechanisms:
Metabolic Stress Hypothesis: The worst-case metabolic stress condition occurs when glucose depletion coincides with high lactate accumulation (>4 g/L) and elevated CO₂ (>10%) simultaneously, leading to >50% reduction in specific productivity within 24 hours.
Product Quality Degradation Hypothesis: The worst-case condition for charge variant formation is the combination of extended culture duration (>14 days) with pH drift above 7.2 for >12 hours, resulting in >10% increase in acidic variants.
Phase 2: Systematic Worst-Case Testing Design
Rather than three worst-case validation batches, integrate systematic testing throughout process qualification:
| Study Phase | Traditional Approach | Hypothesis-Driven Integration |
|---|---|---|
| Process Development | Limited worst-case exploration | Systematic boundary testing to validate worst-case hypotheses |
| Process Qualification | 3 batches under arbitrary worst-case | Multiple studies testing specific worst-case mechanisms |
| Commercial Monitoring | Reactive deviation investigation | Proactive monitoring for predicted worst-case indicators |
Phase 3: Worst-Case Challenge Studies
Design specific studies to test worst-case hypotheses under controlled conditions:
Controlled pH Deviation Study:
- Deliberately induce pH drift to 7.3 for 18 hours during production phase
- Testable Prediction: Acidic variants will increase by 8-12%
- Falsification Criteria: If variant increase is <5% or >15%, hypothesis requires revision
- Regulatory Value: Demonstrates process robustness under worst-case pH conditions
Metabolic Stress Challenge:
- Create controlled glucose limitation combined with high CO₂ environment
- Testable Prediction: Cell viability will drop to <80% within 36 hours
- Falsification Criteria: If viability remains >90%, worst-case assumptions are incorrect
- Regulatory Value: Provides quantitative data on process failure mechanisms
Meeting Matrix and Bracketing Requirements
Traditional validation often uses matrix and bracketing approaches to reduce validation burden while ensuring worst-case coverage. The hypothesis-driven approach enhances these strategies by providing scientific justification for grouping and worst-case selection decisions.
Enhanced Matrix Approach
Instead of grouping based on similar equipment size or configuration, group based on mechanistic similarity as defined by validated hypotheses:
Traditional Matrix Grouping: All 1000L bioreactors with similar impeller configuration are grouped together.
Hypothesis-Driven Matrix Grouping: All bioreactors where oxygen mass transfer coefficient (kLa) falls within 15% and mixing time is <30 seconds are grouped together, as validated hypotheses demonstrate these parameters control product quality variability.
Scientific Bracketing Strategy
The hypothesis-driven approach transforms bracketing from arbitrary extreme testing to mechanistically justified boundary evaluation:
Bracketing Hypothesis: If the process performs adequately under maximum metabolic demand conditions (highest cell density with minimum nutrient feeding rate) and minimum metabolic demand conditions (lowest cell density with maximum feeding rate), then all intermediate conditions will perform within acceptable ranges because metabolic stress is the primary driver of process failure.
This hypothesis can be tested and potentially falsified, providing genuine scientific basis for bracketing strategies rather than regulatory convenience.
Enhanced Validation Reports
Hypothesis-driven validation reports provide regulators with significantly more insight than traditional approaches:
Traditional Worst-Case Documentation: Three validation batches were executed under worst-case conditions (maximum and minimum parameter ranges). All batches met specifications, demonstrating process robustness.
Hypothesis-Driven Documentation: Process robustness was demonstrated through systematic testing of six specific hypotheses about failure mechanisms. Worst-case conditions were scientifically selected based on mechanistic understanding of metabolic stress, pH sensitivity, and product degradation pathways. Results confirm process operates reliably even under conditions that challenge the primary failure mechanisms.
Regulatory Submission Enhancement
The hypothesis-driven approach strengthens regulatory submissions by providing:
- Scientific Rationale: Clear explanation of worst-case selection criteria
- Predictive Capability: Evidence that process behavior can be predicted under untested conditions
- Risk Assessment: Quantitative understanding of failure probability under different scenarios
- Continuous Improvement: Framework for ongoing process optimization based on mechanistic understanding
Integration with Quality by Design (QbD) Principles
The hypothesis-driven approach to worst-case testing aligns perfectly with ICH Q8-Q11 Quality by Design principles while satisfying traditional validation requirements:
Design Space Verification
Instead of arbitrary worst-case testing, systematically verify design space boundaries through hypothesis testing:
Design Space Hypothesis: Operation anywhere within the defined design space (pH 6.95-7.10, Temperature 36-37°C, DO 35-50%) will result in product meeting CQA specifications with >95% confidence.
Worst-Case Verification: Test this hypothesis by deliberately operating at design space boundaries and measuring CQA response, providing scientific evidence for design space validity rather than compliance demonstration.
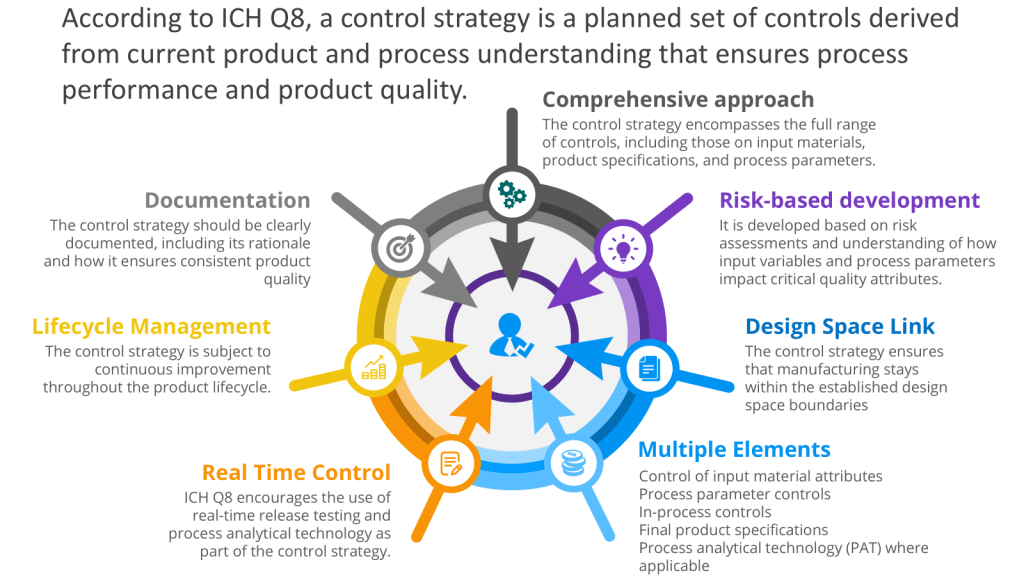
Control Strategy Justification
Hypothesis-driven worst-case testing provides scientific justification for control strategy elements:
Traditional Control Strategy: pH must be controlled between 6.95-7.10 based on validation data.
Enhanced Control Strategy: pH must be controlled between 6.95-7.10 because validated hypotheses demonstrate that pH excursions above 7.15 for >8 hours increase acidic variants beyond specification limits, while pH below 6.90 reduces cell viability by >20% within 12 hours.
Scientific Rigor Enhances Regulatory Compliance
The hypothesis-driven approach to validation doesn’t circumvent worst-case testing requirements—it elevates them from compliance exercises to genuine scientific inquiry. By developing specific, testable hypotheses about what constitutes worst-case conditions and why, we satisfy regulatory expectations while building genuine process understanding that supports continuous improvement and regulatory flexibility.
This approach provides regulators with the scientific evidence they need to have confidence in process robustness while giving manufacturers the process understanding necessary for lifecycle management, change control, and optimization. The result is validation that serves both compliance and business objectives through enhanced scientific rigor rather than additional bureaucracy.
The integration of worst-case testing with hypothesis-driven validation represents the evolution of pharmaceutical process validation from documentation exercises toward genuine scientific methodology. An evolution that strengthens rather than weakens regulatory compliance while providing the process understanding necessary for 21st-century pharmaceutical manufacturing.