This draft guidance lays out a solid approach by using a risk-based credibility assessment framework to establish and evaluate the credibility of AI models. This involves:
Determining if the model is adequate for the intended use
Defining the question of interest the AI model will address
Defining the context of use for the AI model
Assessing the AI model risk based on model influence and decision consequence
Developing a plan to establish model credibility commensurate with the risk
Executing the plan and documenting results
I think may of us are in the midst of figuring out how to provide sufficient transparency around AI model development, evaluation, and outputs to support regulatory decision-making and what will be found to be acceptable. This sort of guidance is a good way for the agency to further that discussion and I definitely plan on commenting on this one.
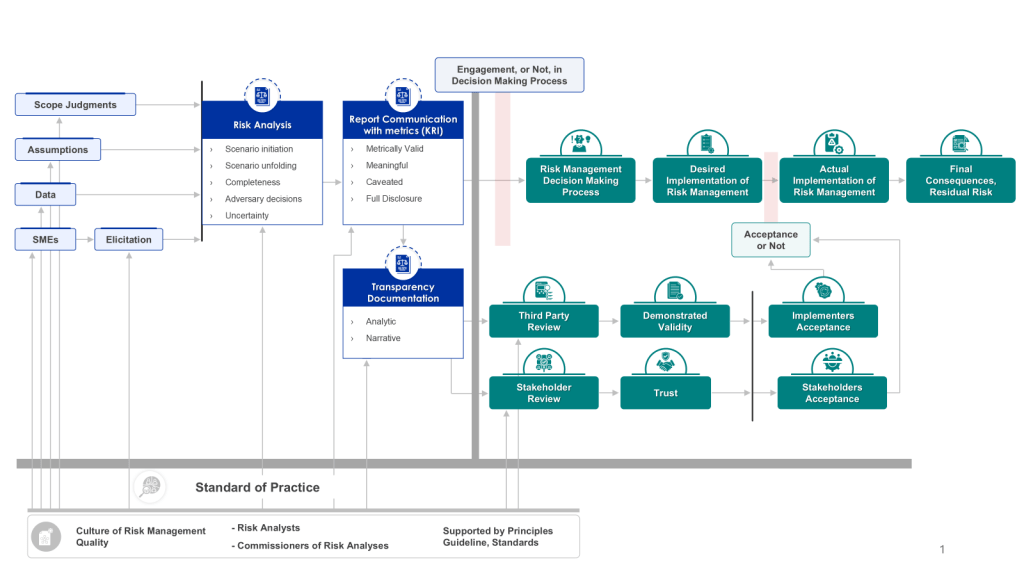
Effective risk analysis is crucial for informed decision-making and robust risk management. Simply conducting a risk analysis is not enough; its effectiveness in engaging the risk management decision-making process is paramount. This effectiveness is largely driven by the transparency and documentation of the analysis, which supports both stakeholder and third-party reviews. Let’s explore how we can measure this effectiveness and why it matters.
The Importance of Transparency and Documentation
Transparency and documentation form the backbone of an effective risk analysis process. They ensure that the methodology, assumptions, and results of the analysis are clear and accessible to all relevant parties. This clarity is essential for:
To improve the effectiveness of risk analysis through better transparency and documentation:
Standardize Risk Reporting
Develop standardized templates and formats for risk reports to ensure consistency and completeness. This standardization facilitates easier comparison and analysis across different time periods or business units.
Implement a Risk Taxonomy
Create a common language for risk across the organization. A well-defined risk taxonomy ensures that all stakeholders understand and interpret risk information consistently.
Leverage Visualization Tools
Utilize data visualization techniques to present risk information in an easily digestible format. Visual representations can make complex risk data more accessible to a broader audience, enhancing engagement in the decision-making process.
Maintain a Comprehensive Audit Trail
Document all steps of the risk analysis process, including data sources, methodologies, assumptions, and decision rationales. This audit trail is crucial for both internal reviews and external audits.
Foster a Culture of Transparency
Encourage open communication about risks throughout the organization. This cultural shift can lead to more honest and accurate risk reporting, ultimately improving the quality of risk analysis.
Conclusion
Measuring the effectiveness of risk analysis in engaging the risk management decision-making process is crucial for organizations seeking to optimize their risk management strategies. By focusing on transparency and documentation, and implementing key metrics to track performance, organizations can ensure that their risk analysis efforts truly drive informed decision-making and robust risk management.
Remember, the goal is not just to conduct risk analysis, but to make it an integral part of the organization’s decision-making fabric. By continuously measuring and improving the effectiveness of risk analysis, organizations can build resilience, enhance stakeholder trust, and navigate uncertainties with greater confidence.
ICH Q9(R1) emphasizes that knowledge is fundamental to effective risk management. The guideline states that “QRM is part of building knowledge and understanding risk scenarios, so that appropriate risk control can be decided upon for use during the commercial manufacturing phase.”
We need to recognize the inverse relationship between knowledge and uncertainty in risk assessment. ICH Q9(R1) notes that uncertainty may be reduced “via effective knowledge management, which enables accumulated and new information (both internal and external) to be used to support risk-based decisions throughout the product lifecycle”
In order to gauge the confidence in risk assessment we need to gauge our knowledge strength.
The Spectrum of Knowledge Strength
Knowledge strength can be categorized into three levels: weak, medium, and strong. Each level is determined by specific criteria that assess the reliability, consensus, and depth of understanding surrounding a particular subject.
Indicators of Weak Knowledge
Knowledge is considered weak if it exhibits one or more of the following characteristics:
Oversimplified Assumptions: The foundations of the knowledge rely on strong simplifications that may not accurately represent reality.
Lack of Reliable Data: There is little to no data available, or the existing information is highly unreliable or irrelevant.
Expert Disagreement: There is significant disagreement among experts in the field.
Poor Understanding of Phenomena: The underlying phenomena are poorly understood, and available models are either non-existent or known to provide inaccurate predictions.
Unexamined Knowledge: The knowledge has not been thoroughly scrutinized, potentially overlooking critical “unknown knowns.”
Hallmarks of Strong Knowledge
On the other hand, knowledge is deemed strong when it meets all of the following criteria (where relevant):
Reasonable Assumptions: The assumptions made are considered very reasonable and well-grounded.
Abundant Reliable Data: Large amounts of reliable and relevant data or information are available.
Expert Consensus: There is broad agreement among experts in the field.
Well-Understood Phenomena: The phenomena involved are well understood, and the models used provide predictions with the required accuracy.
Thoroughly Examined: The knowledge has been rigorously examined and tested.
The Middle Ground: Medium Strength Knowledge
Cases that fall between weak and strong are classified as medium strength knowledge. This category can be flexible, allowing for a broader range of scenarios to be considered strong. For example, knowledge could be classified as strong if at least one (or more) of the strong criteria are met while none of the weak criteria are present.
Strong vs Weak Knowledge
A Simplified Approach
For practical applications, a simplified version of this framework can be used:
Strong: All criteria for strong knowledge are met.
Medium: One or two criteria for strong knowledge are not met.
Weak: Three or more criteria for strong knowledge are not met.
Implications for Decision-Making
Understanding the strength of our knowledge is crucial for effective decision-making. Strong knowledge provides a solid foundation for confident choices, while weak knowledge signals the need for caution and further investigation.
When faced with weak knowledge:
Seek additional information or expert opinions
Consider multiple scenarios and potential outcomes
Implement risk mitigation strategies
When working with strong knowledge:
Make decisions with greater confidence
Focus on implementation and optimization
Monitor outcomes to validate and refine understanding
Strong knowledge typically corresponds to lower levels of uncertainty:
Level 1 Uncertainty: This aligns closely with strong knowledge, where outcomes can be estimated with reasonable accuracy within a single system model. Strong knowledge is characterized by reasonable assumptions, abundant reliable data, and well-understood phenomena, which enable accurate predictions.
Level 2 Uncertainty: While displaying alternative futures, this level still operates within a single system where probability estimates can be applied confidently. Strong knowledge often allows for this level of certainty, as it involves broad expert agreement and thoroughly examined information.
Medium Knowledge and Moderate Uncertainty (Level 3)
Medium strength knowledge often corresponds to Level 3 uncertainty:
Level 3 Uncertainty: This level involves “a multiplicity of plausible futures” with multiple interacting systems, but still within a known range of outcomes. Medium knowledge strength might involve some gaps or disagreements but still provides a foundation for identifying potential outcomes.
Weak Knowledge and Deep Uncertainty (Level 4)
Weak knowledge aligns most closely with the deepest level of uncertainty:
Level 4 Uncertainty: This level leads to an “unknown future” where we don’t understand the system and are aware of crucial unknowns. Weak knowledge, characterized by oversimplified assumptions, lack of reliable data, and poor understanding of phenomena, often results in this level of deep uncertainty.
Implications for Decision-Making
When knowledge is strong and uncertainty is low (Levels 1-2), decision-makers can rely more confidently on predictions and probability estimates.
As knowledge strength decreases and uncertainty increases (Levels 3-4), decision-makers must adopt more flexible and adaptive approaches to account for a wider range of possible futures.
The principle that “uncertainty should always be considered at the deepest proposed level” unless proven otherwise aligns with the cautious approach of assessing knowledge strength. This ensures that potential weaknesses in knowledge are not overlooked.
Conclusion
By systematically evaluating the strength of our knowledge using this framework, we can make more informed decisions, identify areas that require further investigation, and better understand the limitations of our current understanding. Remember, the goal is not always to achieve perfect knowledge but to recognize the level of certainty we have and act accordingly.
Twenty years on, risk management in the pharmaceutical world continues to be challenging. Ensure that risk assessments are systematic, structured, and based on scientific knowledge. A large part of the ICH Q9(R1) revision was written to address continued struggles with subjectivity, formality, and decision-making. And quite frankly, it’s clear to me that we, as an industry, are still working to absorb those messages these last two years.
A big challenge is that we struggle to measure the effectiveness of our risk assessments. Quite frankly, this is a great place for a rubric.
Luckily, we have a good tool out there to adopt: the Risk Analysis Quality Test (RAQT1.0), developed by the Society for Risk Analysis (SRA). This comprehensive framework is designed to evaluate and improve the quality of risk assessments. We can apply this tool to meet the requirements of the International Conference on Harmonisation (ICH) Q9, which outlines quality risk management principles for the pharmaceutical industry. From that, we can drive continued improvement in our risk management activities.
Components of RAQT1.0
The Risk Analysis Quality Test consists of 76 questions organized into 15 categories:
Framing the Analysis and Its Interface with Decision Making
Capturing the Risk Generating Process (RGP)
Communication
Stakeholder Involvement
Assumptions and Scope Boundary Issues
Proactive Creation of Alternative Courses of Action
Basis of Knowledge
Data Limitations
Analysis Limitations
Uncertainty
Consideration of Alternative Analysis Approaches
Robustness and Resilience of Action Strategies
Model and Analysis Validation and Documentation
Reporting
Budget and Schedule Adequacy
Application to ICH Q9 Requirements
ICH Q9 emphasizes the importance of a systematic and structured risk assessment process. The RAQT can be used to ensure that risk assessments are thorough and meet quality standards. For example, Category G (Basis of Knowledge) and Category H (Data Limitations) help in evaluating the scientific basis and data quality of the risk assessment, aligning with ICH Q9’s requirement for using available knowledge and data.
The RAQT’s Category B (Capturing the Risk Generating Process) and Category C (Communication) can help in identifying and communicating risks effectively. This aligns with ICH Q9’s requirement to identify potential risks based on scientific knowledge and understanding of the process.
Categories such as Category I (Analysis Limitations) and Category J (Uncertainty) in the RAQT help in analyzing the risks and addressing uncertainties, which is a key aspect of ICH Q9. These categories ensure that the analysis is robust and considers all relevant factors.
The RAQT’s Category A (Framing the Analysis and Its Interface with Decision Making) and Category F (Proactive Creation of Alternative Courses of Action) are crucial for evaluating risks and developing mitigation strategies. This aligns with ICH Q9’s requirement to evaluate risks and determine the need for risk reduction.
Categories like Category L (Robustness and Resilience of Action Strategies) and Category M (Model and Analysis Validation and Documentation) in the RAQT help in ensuring that the risk control measures are robust and well-documented. This is consistent with ICH Q9’s emphasis on implementing and reviewing controls.
Category D (Stakeholder Involvement) of the RAQT ensures that stakeholders are engaged in the risk management process, which is a requirement under ICH Q9 for effective communication and collaboration.
The RAQT can be applied both retrospectively and prospectively, allowing for the evaluation of past risk assessments and the planning of future ones. This aligns with ICH Q9’s requirement for periodic review and continuous improvement of the risk management process.
Creating a Rubric
To make this actionable we need a tool, a rubric, to allow folks to evaluate what goods look like. I would insert this tool into the quality oversite of risk management.
Category A: Framing the Analysis and Its Interface With Decision Making
Criteria
Excellent (4)
Good (3)
Fair (2)
Poor (1)
Problem Definition
Clearly and comprehensively defines the problem, including all relevant aspects and stakeholders
Adequately defines the problem with most relevant aspects considered
Partially defines the problem with some key aspects missing
Poorly defines the problem or misses critical aspects
Analytical Approach
Selects and justifies an optimal analytical approach, demonstrating deep understanding of methodologies
Chooses an appropriate analytical approach with reasonable justification
Selects a somewhat relevant approach with limited justification
Chooses an inappropriate approach or provides no justification
Data Collection and Management
Thoroughly identifies all necessary data sources and outlines a comprehensive data management plan
Identifies most relevant data sources and provides a adequate data management plan
Identifies some relevant data sources and offers a basic data management plan
Fails to identify key data sources or lacks a coherent data management plan
Stakeholder Identification
Comprehensively identifies all relevant stakeholders and their interests
Identifies most key stakeholders and their primary interests
Identifies some stakeholders but misses important ones or their interests
Fails to identify major stakeholders or their interests
Decision-Making Context
Provides a thorough analysis of the decision-making context, including constraints and opportunities
Adequately describes the decision-making context with most key factors considered
Partially describes the decision-making context, missing some important factors
Poorly describes or misunderstands the decision-making context
Alignment with Organizational Goals
Demonstrates perfect alignment between the analysis and broader organizational objectives
Shows good alignment with organizational goals, with minor gaps
Partially aligns with organizational goals, with significant gaps
Fails to align with or contradicts organizational goals
Communication Strategy
Develops a comprehensive strategy for communicating results to all relevant decision-makers
Outlines a good communication strategy covering most key decision-makers
Provides a basic communication plan with some gaps
Lacks a clear strategy for communicating results to decision-makers
This rubric provides a framework for assessing the quality of work in framing an analysis and its interface with decision-making. It covers key aspects such as problem definition, analytical approach, data management, stakeholder consideration, decision-making context, alignment with organizational goals, and communication strategy. Each criterion is evaluated on a scale from 1 (Poor) to 4 (Excellent), allowing for nuanced assessment of performance in each area.
To use this rubric effectively:
Adjust the criteria and descriptions as needed to fit your specific context or requirements.
Ensure that the expectations for each level (Excellent, Good, Fair, Poor) are clear and distinguishable.
My next steps will be to add specific examples or indicators for each level to provide more guidance to both assessors and those being assessed.
I also may, depending on internal needs, want to assign different weights to each criterion based on their relative importance in your specific context. In this case I think each ends up being pretty similar.
I would then go and add the other sections. For example, here is category B with some possible weighting.
Category B: Capturing the Risk Generating Process (RGP)
Component
Weight Factor
Excellent
Satisfactory
Needs Improvement
Poor
B1. Comprehensiveness
4
The analysis includes: i) A structured taxonomy of hazards/events demonstrating comprehensiveness ii) Each scenario spelled out with causes and types of change iii) Explicit addressing of potential “Black Swan” events iv) Clear description of implications of such events for risk management
The analysis includes 3 out of 4 elements from the Excellent criteria, with minor gaps that do not significantly impact understanding
The analysis includes only 2 out of 4 elements from the Excellent criteria, or has significant gaps in comprehensiveness
The analysis includes 1 or fewer elements from the Excellent criteria, severely lacking in comprehensiveness
B2. Basic Structure of RGP
2
Clearly identifies and accounts for the basic structure of the RGP (e.g. linear, chaotic, complex adaptive) AND Uses appropriate mathematical structures (e.g. linear, quadratic, exponential) that match the RGP structure
Identifies the basic structure of the RGP BUT does not fully align mathematical structures with the RGP
Attempts to identify the RGP structure but does so incorrectly or incompletely OR Uses mathematical structures that do not align with the RGP
Does not identify or account for the basic structure of the RGP
B3. Complexity of RGP
3
Lists all important causal and associative links in the RGP AND Demonstrates how each link is accounted for in the analysis
Lists most important causal and associative links in the RGP AND Demonstrates how most links are accounted for in the analysis
Lists some causal and associative links but misses key elements OR Does not adequately demonstrate how links are accounted for in the analysis
Does not list causal and associative links or account for them in the analysis
B4. Early Warning Detection
3
Includes a clear process for detecting early warnings of potential surprising risk aspects, beyond just concrete events
Includes a process for detecting early warnings, but it may be limited in scope or not fully developed
Mentions the need for early warning detection but does not provide a clear process
Does not address early warning detection
B5. System Changes
2
Fully considers the possibility of system changes AND Establishes adequate mechanisms to detect those changes
Considers the possibility of system changes BUT mechanisms to detect changes are not fully developed
Mentions the possibility of system changes but does not adequately consider or establish detection mechanisms
Does not consider or address the possibility of system changes
I definitely need to go back and add more around structure requirements. The SRA RAQT tool needs some more interpretation here.
Category C: Risk Communication
Component
Weight Factor
Excellent
Satisfactory
Needs Improvement
Poor
C1. Integration of Communication into Risk Analysis
3
Communication is fully integrated into the risk analysis following established norms). All aspects of the methodology are clearly addressed including context establishment, risk assessment (identification, analysis, evaluation), and risk treatment. There is clear evidence of pre-assessment, management, appraisal, characterization and evaluation. Knowledge about the risk is thoroughly categorized.
Communication is integrated into the risk analysis following most aspects of established norms. Most key elements of methodologies like ISO 31000 or IRGC are addressed, but some minor aspects may be missing or unclear. Knowledge about the risk is categorized, but may lack some detail.
Communication is partially integrated into the risk analysis, but significant aspects of established norms are missing. Only some elements of methodologies like ISO 31000 or IRGC are addressed. Knowledge categorization about the risk is incomplete or unclear.
There is little to no evidence of communication being integrated into the risk analysis following established norms. Methodologies like ISO 31000 or IRGC are not followed. Knowledge about the risk is not categorized.
C2. Adequacy of Risk Communication
3
All considerations for effective risk communication have been applied to ensure adequacy between analysts and decision makers, analysts and other stakeholders, and decision makers and stakeholders. There is clear evidence that all parties agree the communication is adequate.
Most considerations for effective risk communication have been applied. Communication appears adequate between most parties, but there may be minor gaps or areas where agreement on adequacy is not explicitly stated.
Some considerations for effective risk communication have been applied, but there are significant gaps. Communication adequacy is questionable between one or more sets of parties. There is limited evidence of agreement on communication adequacy.
Few to no considerations for effective risk communication have been applied. There is no evidence of adequate communication between analysts, decision makers, and stakeholders. There is no indication of agreement on communication adequacy.
Category D: Stakeholder Involvement
Criteria
Weight
Excellent (4)
Satisfactory (3)
Needs Improvement (2)
Poor (1)
Stakeholder Identification
4
All relevant stakeholders are systematically and comprehensively identified
Most relevant stakeholders are identified, with minor omissions
Some relevant stakeholders are identified, but significant groups are missed
Few or no relevant stakeholders are identified
Stakeholder Consultation
3
All identified stakeholders are thoroughly consulted, with their perceptions and concerns fully considered
Most identified stakeholders are consulted, with their main concerns considered
Some stakeholders are consulted, but consultation is limited in scope or depth
Few or no stakeholders are consulted
Stakeholder Engagement
3
Stakeholders are actively engaged throughout the entire risk management process, including problem framing, decision-making, and implementation
Stakeholders are engaged in most key stages of the risk management process
Stakeholders are engaged in some aspects of the risk management process, but engagement is inconsistent
Stakeholders are minimally engaged or not engaged at all in the risk management process
Effectiveness of Involvement
2
All stakeholders would agree that they were effectively consulted and engaged
Most stakeholders would agree that they were adequately consulted and engaged
Some stakeholders may feel their involvement was insufficient or ineffective
Most stakeholders would likely feel their involvement was inadequate or ineffective
Category E: Assumptions and Scope Boundary Issues
Criterion
Weight
Excellent (4)
Satisfactory (3)
Needs Improvement (2)
Poor (1)
E1. Important assumptions and implications listed
4
All important assumptions and their implications for risk management are systematically listed in clear language understandable to decision makers. Comprehensive and well-organized.
Most important assumptions and implications are listed in language generally clear to decision makers. Some minor omissions or lack of clarity.
Some important assumptions and implications are listed, but significant gaps exist. Language is not always clear to decision makers.
Few or no important assumptions and implications are listed. Language is unclear or incomprehensible to decision makers.
E2. Risks of assumption deviations evaluated
3
Risks of all significant assumptions deviating from the actual Risk Generating Process are thoroughly evaluated. Consequences and implications are clearly communicated to decision makers.
Most risks of significant assumption deviations are evaluated. Consequences and implications are generally communicated to decision makers, with minor gaps.
Some risks of assumption deviations are evaluated, but significant gaps exist. Communication to decision makers is incomplete or unclear.
Few or no risks of assumption deviations are evaluated. Little to no communication of consequences and implications to decision makers.
E3. Scope boundary issues and implications listed
3
All important scope boundary issues and their implications for risk management are systematically listed in clear language understandable to decision makers. Comprehensive and well-organized.
Most important scope boundary issues and implications are listed in language generally clear to decision makers. Some minor omissions or lack of clarity.
Some important scope boundary issues and implications are listed, but significant gaps exist. Language is not always clear to decision makers.
Few or no important scope boundary issues and implications are listed. Language is unclear or incomprehensible to decision makers.
Category F: Proactive Creation of Alternative Courses of Action
Criteria
Weight
Excellent (4)
Satisfactory (3)
Needs Improvement (2)
Poor (1)
Systematic generation of alternatives
4
A comprehensive and structured process is used to systematically generate a wide range of alternative courses of action, going well beyond initially considered options
A deliberate process is used to generate multiple alternative courses of action beyond those initially considered
Some effort is made to generate alternatives, but the process is not systematic or comprehensive
Little to no effort is made to generate alternatives beyond those initially considered
Goal-focused creation
3
All generated alternatives are clearly aligned with and directly address the stated goals of the analysis
Most generated alternatives align with the stated goals of the analysis
Some generated alternatives align with the goals, but others seem tangential or unrelated
Generated alternatives (if any) do not align with or address the stated goals
Consideration of robust/resilient options
3
Multiple robust and resilient alternatives are developed to address various uncertainty scenarios
At least one robust or resilient alternative is developed to address uncertainty
Robustness and resilience are considered, but not fully incorporated into alternatives
Robustness and resilience are not considered in alternative generation
Examination of unintended consequences
2
Thorough examination of potential unintended consequences for each alternative, including action-reaction spirals
Some examination of potential unintended consequences for most alternatives
Limited examination of unintended consequences for some alternatives
No consideration of potential unintended consequences
Documentation of alternative creation process
1
The process of alternative generation is fully documented, including rationale for each alternative
The process of alternative generation is mostly documented
The process of alternative generation is partially documented
The process of alternative generation is not documented
Category G: Basis of Knowledge
Criterion
Weight
Excellent (4)
Satisfactory (3)
Needs Improvement (2)
Poor (1)
G1. Characterization of knowledge basis
4
All inputs are clearly characterized (empirical, expert elicitation, testing, modeling, etc.). Distinctions between broadly accepted and novel analyses are explicitly stated.
Most inputs are characterized, with some minor omissions. Distinctions between accepted and novel analyses are mostly clear.
Some inputs are characterized, but significant gaps exist. Limited distinction between accepted and novel analyses.
Little to no characterization of knowledge basis. No distinction between accepted and novel analyses.
G2. Strength of knowledge adequacy
3
Strength of knowledge is thoroughly characterized in terms of its adequacy to support risk management decisions. Limitations are clearly articulated.
Strength of knowledge is mostly characterized, with some minor gaps in relating to decision support adequacy.
Limited characterization of knowledge strength. Unclear how it relates to decision support adequacy.
No characterization of knowledge strength or its adequacy for decision support.
G3. Communication of knowledge limitations
4
All knowledge limitations and their implications for risk management are clearly communicated to decision makers in understandable language.
Most knowledge limitations and implications are communicated, with minor clarity issues.
Some knowledge limitations are communicated, but significant gaps exist in clarity or completeness.
Knowledge limitations are not communicated or are presented in a way decision makers cannot understand.
G4. Consideration of surprises and unforeseen events
3
Thorough consideration of potential surprises and unforeseen events (Black Swans). Their importance is clearly articulated.
Consideration of surprises and unforeseen events is present, with some minor gaps in articulating their importance.
Limited consideration of surprises and unforeseen events. Their importance is not clearly articulated.
No consideration of surprises or unforeseen events.
G5. Conflicting expert opinions
2
All conflicting expert opinions are systematically considered and reported to decision makers as a source of uncertainty.
Most conflicting expert opinions are considered and reported, with minor omissions.
Some conflicting expert opinions are considered, but significant gaps exist in reporting or consideration.
Conflicting expert opinions are not considered or reported.
G6. Consideration of unconsidered knowledge
2
Explicit measures are implemented to check for knowledge outside the analysis group (e.g., independent review).
Some measures are in place to check for outside knowledge, but they may not be comprehensive.
Limited consideration of knowledge outside the analysis group. No formal measures in place.
No consideration of knowledge outside the analysis group.
G7. Consideration of disregarded low-probability events
1
Explicit measures are implemented to check for events disregarded due to low probabilities based on critical assumptions.
Some consideration of low-probability events, but measures may not be comprehensive.
Limited consideration of low-probability events. No formal measures in place.
No consideration of events disregarded due to low probabilities.
This rubric, once done, is a tool to guide assessment and provide feedback. It should be flexible enough to accommodate unique aspects of individual work while maintaining consistent standards across evaluations. I’d embed it in the quality approval step.
While rare, viral contamination events can have severe consequences, potentially impacting product quality, patient safety, and company reputation. And while a consent decree is a good way to grow your skills, I tend to prefer to avoid causing one to happen.
Luckily, regulatory bodies have provided comprehensive guidelines, with ICH Q5A(R2) being a cornerstone document. Let’s explore the best practices for viral risk management in biotech, drawing from ICH Q5A and other relevant guidances.
The Three Pillars of Viral Safety
ICH Q5A outlines three complementary approaches to control potential viral contamination:
Selection and testing of cell lines and raw materials
Assessment of viral clearance capacity in production processes
Testing of the product at appropriate stages for contaminating viruses
These pillars form the foundation of a robust viral safety strategy.
Cell Line and Raw Material Control
Thoroughly document the origin and history of cell lines
Implement comprehensive testing programs for cell banks, including master and working cell banks
Carefully assess and control animal-derived raw materials
Consider using chemically-defined or animal-free raw materials where possible
Implement stringent change control and quality agreements with raw material suppliers
Viral Clearance Capacity
Design manufacturing processes with multiple orthogonal viral clearance steps
Validate the effectiveness of viral clearance steps using model viruses
Aim for a cumulative viral reduction factor of at least 4 log10 per the USP guidelines
Consider both dedicated viral inactivation steps (e.g., low pH treatment) and removal steps (e.g., nanofiltration)
For continuous manufacturing, assess the impact of process dynamics on viral clearance
In-Process and Final Product Testing
Develop a comprehensive testing strategy for in-process materials and final product
Utilize state-of-the-art detection methods, including PCR and next-generation sequencing (NGS)
Consider replacing traditional in vivo assays with molecular methods where appropriate
Implement a testing program that covers a broad spectrum of potential viral contaminants
Risk-Based Approach
The revised ICH Q5A(R2) emphasizes a risk-based approach to viral safety. This involves:
Conducting thorough risk assessments of the entire manufacturing process
Identifying critical control points for viral contamination
Implementing appropriate mitigation strategies based on risk levels
Continuously monitoring and updating the risk assessment as new information becomes available
Prior knowledge, including “in-house” experience, plays a crucial role in viral risk assessment and management for biopharmaceutical manufacturing. Here’s how it can be effectively utilized:
Leveraging Historical Data
Review past viral contamination events or near-misses within the organization
Analyze trends in raw material quality and supplier performance
Evaluate the effectiveness of previous risk mitigation strategies
Process Design and Optimization
Apply lessons learned from previous manufacturing campaigns to improve process robustness
Use historical data to identify critical control points for viral contamination
Optimize viral clearance steps based on past validation studies
Cell Line Susceptibility
Use accumulated data on cell line susceptibility to various viruses to inform risk assessments
Apply knowledge of cell line behavior under different conditions to enhance contamination detection
Risk Assessment Approach
The risk assessment process should take a holistic approach, focusing on:
Raw material sourcing and testing
Identifying high-risk materials, especially animal-derived components
Assessing chemically-undefined components like hydrolysates and peptones
Evaluating materials produced or stored in non-controlled environments
Cell substrate selection and characterization
Documenting the derivation and source history of the cell line
Testing cell banks extensively for adventitious agents
Assessing the cell line’s susceptibility to various viruses
Process design for viral clearance
Designing manufacturing processes with multiple orthogonal viral clearance steps
Facility design and operations
Implementing robust cleaning and sanitization procedures
Ensuring proper facility layout and air handling systems to prevent contamination spread
Personnel training and practices
Training on proper gowning procedures and personal protective equipment (PPE) usage
Policies on illness reporting and exclusion of sick employees from critical areas
Preparedness and Response
While prevention is key, being prepared for a potential contamination event is crucial:
Develop a comprehensive viral contamination response plan[6]
Regularly practice and update the response plan through mock drills
Establish clear communication channels and decision-making processes
Prepare strategies for containment, decontamination, and facility restart
Continuous Improvement
Viral risk management is an ongoing process:
Stay updated on emerging technologies and regulatory guidance
Participate in industry forums and share best practices
Invest in employee training and awareness programs
Continuously evaluate and improve viral safety strategies
By implementing these best practices and adhering to regulatory guidances like ICH Q5A, we can strive to significantly mitigate the risk of viral contamination. While no approach can guarantee absolute safety, a comprehensive, risk-based strategy that leverages cutting-edge technologies and emphasizes preparedness will go a long way in protecting patients, products, and the industry as a whole.