The pharmaceutical industry has long operated under a fundamental epistemological fallacy that undermines our ability to truly understand the effectiveness of our quality systems. We celebrate zero deviations, zero recalls, zero adverse events, and zero regulatory observations as evidence that our systems are working. But a fundamental fact we tend to ignore is that we are confusing the absence of evidence with evidence of absence—a logical error that not only fails to prove effectiveness but actively impedes our ability to build more robust, science-based quality systems.
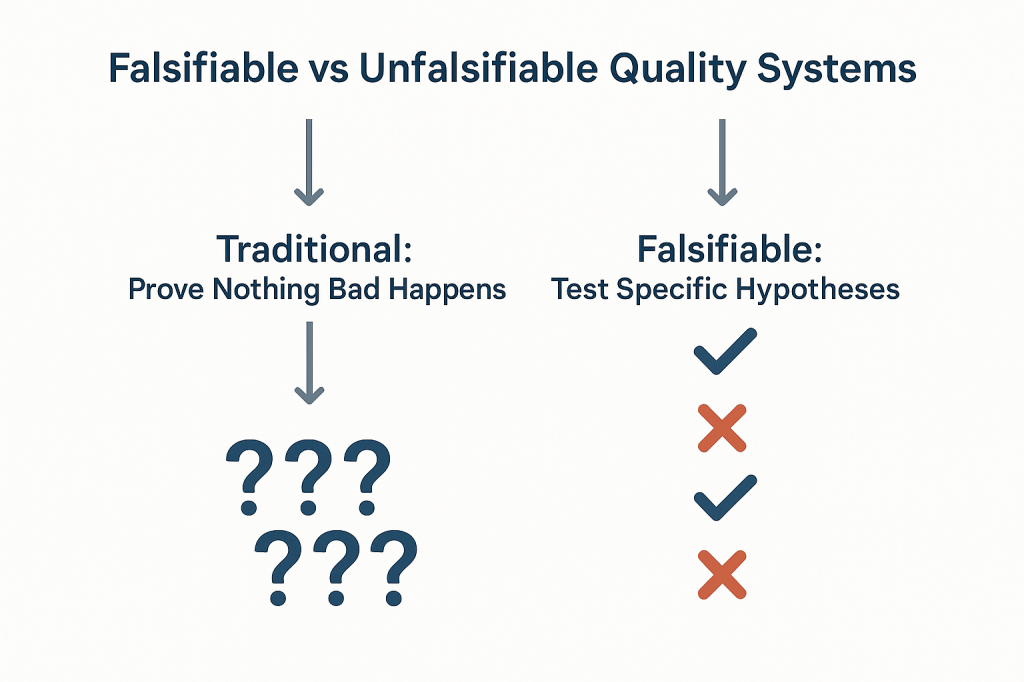
This challenge strikes at the heart of how we approach quality risk management. When our primary evidence of “success” is that nothing bad happened, we create unfalsifiable systems that can never truly be proven wrong.
The Philosophical Foundation: Falsifiability in Quality Risk Management
Karl Popper’s theory of falsification fundamentally challenges how we think about scientific validity. For Popper, the distinguishing characteristic of genuine scientific theories is not that they can be proven true, but that they can be proven false. A theory that cannot conceivably be refuted by any possible observation is not scientific—it’s metaphysical speculation.
Applied to quality risk management, this creates an uncomfortable truth: most of our current approaches to demonstrating system effectiveness are fundamentally unscientific. When we design quality systems around preventing negative outcomes and then use the absence of those outcomes as evidence of effectiveness, we create what Popper would call unfalsifiable propositions. No possible observation could ever prove our system ineffective as long as we frame effectiveness in terms of what didn’t happen.
Consider the typical pharmaceutical quality narrative: “Our manufacturing process is validated because we haven’t had any quality failures in twelve months.” This statement is unfalsifiable because it can always accommodate new information. If a failure occurs next month, we simply adjust our understanding of the system’s reliability without questioning the fundamental assumption that absence of failure equals validation. We might implement corrective actions, but we rarely question whether our original validation approach was capable of detecting the problems that eventually manifested.
Most of our current risk models are either highly predictive but untestable (making them useful for operational decisions but scientifically questionable) or neither predictive nor testable (making them primarily compliance exercises). The goal should be to move toward models are both scientifically rigorous and practically useful.
This philosophical foundation has practical implications for how we design and evaluate quality risk management systems. Instead of asking “How can we prevent bad things from happening?” we should be asking “How can we design systems that will fail in predictable ways when our underlying assumptions are wrong?” The first question leads to unfalsifiable defensive strategies; the second leads to falsifiable, scientifically valid approaches to quality assurance.
Why “Nothing Bad Happened” Isn’t Evidence of Effectiveness
The fundamental problem with using negative evidence to prove positive claims extends far beyond philosophical niceties, it creates systemic blindness that prevents us from understanding what actually drives quality outcomes. When we frame effectiveness in terms of absence, we lose the ability to distinguish between systems that work for the right reasons and systems that appear to work due to luck, external factors, or measurement limitations.
| Scenario | Null Hypothesis | What Rejection Proves | What Non-Rejection Proves | Popperian Assessment |
| Traditional Efficacy Testing | No difference between treatment and control | Treatment is effective | Cannot prove effectiveness | Falsifiable and useful |
| Traditional Safety Testing | No increased risk | Treatment increases risk | Cannot prove safety | Unfalsifiable for safety |
| Absence of Events (Current) | No safety signal detected | Cannot prove anything | Cannot prove safety | Unfalsifiable |
| Non-inferiority Approach | Excess risk > acceptable margin | Treatment is acceptably safe | Cannot prove safety | Partially falsifiable |
| Falsification-Based Safety | Safety controls are inadequate | Current safety measures fail | Safety controls are adequate | Falsifiable and actionable |
The table above demonstrates how traditional safety and effectiveness assessments fall into unfalsifiable categories. Traditional safety testing, for example, attempts to prove that something doesn’t increase risk, but this can never be definitively demonstrated—we can only fail to detect increased risk within the limitations of our study design. This creates a false confidence that may not be justified by the actual evidence.
The Sampling Illusion: When we observe zero deviations in a batch of 1000 units, we often conclude that our process is in control. But this conclusion conflates statistical power with actual system performance. With typical sampling strategies, we might have only 10% power to detect a 1% defect rate. The “zero observations” reflect our measurement limitations, not process capability.
The Survivorship Bias: Systems that appear effective may be surviving not because they’re well-designed, but because they haven’t yet encountered the conditions that would reveal their weaknesses. Our quality systems are often validated under ideal conditions and then extrapolated to real-world operations where different failure modes may dominate.
The Attribution Problem: When nothing bad happens, we attribute success to our quality systems without considering alternative explanations. Market forces, supplier improvements, regulatory changes, or simple random variation might be the actual drivers of observed outcomes.
| Observable Outcome | Traditional Interpretation | Popperian Critique | What We Actually Know | Testable Alternative |
| Zero adverse events in 1000 patients | “The drug is safe” | Absence of evidence does not equal Evidence of absence | No events detected in this sample | Test limits of safety margin |
| Zero manufacturing deviations in 12 months | “The process is in control” | No failures observed does not equal a Failure-proof system | No deviations detected with current methods | Challenge process with stress conditions |
| Zero regulatory observations | “The system is compliant” | No findings does not equal No problems exist | No issues found during inspection | Audit against specific failure modes |
| Zero product recalls | “Quality is assured” | No recalls does not equal No quality issues | No quality failures reached market | Test recall procedures and detection |
| Zero patient complaints | “Customer satisfaction achieved” | No complaints does not equal No problems | No complaints received through channels | Actively solicit feedback mechanisms |
This table illustrates how traditional interpretations of “positive” outcomes (nothing bad happened) fail to provide actionable knowledge. The Popperian critique reveals that these observations tell us far less than we typically assume, and the testable alternatives provide pathways toward more rigorous evaluation of system effectiveness.
The pharmaceutical industry’s reliance on these unfalsifiable approaches creates several downstream problems. First, it prevents genuine learning and improvement because we can’t distinguish effective interventions from ineffective ones. Second, it encourages defensive mindsets that prioritize risk avoidance over value creation. Third, it undermines our ability to make resource allocation decisions based on actual evidence of what works.
The Model Usefulness Problem: When Predictions Don’t Match Reality
George Box’s famous aphorism that “all models are wrong, but some are useful” provides a pragmatic framework for this challenge, but it doesn’t resolve the deeper question of how to determine when a model has crossed from “useful” to “misleading.” Popper’s falsifiability criterion offers one approach: useful models should make specific, testable predictions that could potentially be proven wrong by future observations.
The challenge in pharmaceutical quality management is that our models often serve multiple purposes that may be in tension with each other. Models used for regulatory submission need to demonstrate conservative estimates of risk to ensure patient safety. Models used for operational decision-making need to provide actionable insights for process optimization. Models used for resource allocation need to enable comparison of risks across different areas of the business.
When the same model serves all these purposes, it often fails to serve any of them well. Regulatory models become so conservative that they provide little guidance for actual operations. Operational models become so complex that they’re difficult to validate or falsify. Resource allocation models become so simplified that they obscure important differences in risk characteristics.
The solution isn’t to abandon modeling, but to be more explicit about the purpose each model serves and the criteria by which its usefulness should be judged. For regulatory purposes, conservative models that err on the side of safety may be appropriate even if they systematically overestimate risks. For operational decision-making, models should be judged primarily on their ability to correctly rank-order interventions by their impact on relevant outcomes. For scientific understanding, models should be designed to make falsifiable predictions that can be tested through controlled experiments or systematic observation.
Consider the example of cleaning validation, where we use models to predict the probability of cross-contamination between manufacturing campaigns. Traditional approaches focus on demonstrating that residual contamination levels are below acceptance criteria—essentially proving a negative. But this approach tells us nothing about the relative importance of different cleaning parameters, the margin of safety in our current procedures, or the conditions under which our cleaning might fail.
A more falsifiable approach would make specific predictions about how changes in cleaning parameters affect contamination levels. We might hypothesize that doubling the rinse time reduces contamination by 50%, or that certain product sequences create systematically higher contamination risks. These hypotheses can be tested and potentially falsified, providing genuine learning about the underlying system behavior.
From Defensive to Testable Risk Management
The evolution from defensive to testable risk management represents a fundamental shift in how we conceptualize quality systems. Traditional defensive approaches ask, “How can we prevent failures?” Testable approaches ask, “How can we design systems that fail predictably when our assumptions are wrong?” This shift moves us from unfalsifiable defensive strategies toward scientifically rigorous quality management.
This transition aligns with the broader evolution in risk thinking documented in ICH Q9(R1) and ISO 31000, which recognize risk as “the effect of uncertainty on objectives” where that effect can be positive, negative, or both. By expanding our definition of risk to include opportunities as well as threats, we create space for falsifiable hypotheses about system performance.
The integration of opportunity-based thinking with Popperian falsifiability creates powerful synergies. When we hypothesize that a particular quality intervention will not only reduce defects but also improve efficiency, we create multiple testable predictions. If the intervention reduces defects but doesn’t improve efficiency, we learn something important about the underlying system mechanics. If it improves efficiency but doesn’t reduce defects, we gain different insights. If it does neither, we discover that our fundamental understanding of the system may be flawed.
This approach requires a cultural shift from celebrating the absence of problems to celebrating the presence of learning. Organizations that embrace falsifiable quality management actively seek conditions that would reveal the limitations of their current systems. They design experiments to test the boundaries of their process capabilities. They view unexpected results not as failures to be explained away, but as opportunities to refine their understanding of system behavior.
The practical implementation of testable risk management involves several key elements:
Hypothesis-Driven Validation: Instead of demonstrating that processes meet specifications, validation activities should test specific hypotheses about process behavior. For example, rather than proving that a sterilization cycle achieves a 6-log reduction, we might test the hypothesis that cycle modifications affect sterility assurance in predictable ways. Instead of demonstrating that the CHO cell culture process consistently produces mAb drug substance meeting predetermined specifications, hypothesis-driven validation would test the specific prediction that maintaining pH at 7.0 ± 0.05 during the production phase will result in final titers that are 15% ± 5% higher than pH maintained at 6.9 ± 0.05, creating a falsifiable hypothesis that can be definitively proven wrong if the predicted titer improvement fails to materialize within the specified confidence intervals
Falsifiable Control Strategies: Control strategies should include specific predictions about how the system will behave under different conditions. These predictions should be testable and potentially falsifiable through routine monitoring or designed experiments.
Learning-Oriented Metrics: Key indicators should be designed to detect when our assumptions about system behavior are incorrect, not just when systems are performing within specification. Metrics that only measure compliance tell us nothing about the underlying system dynamics.
Proactive Stress Testing: Rather than waiting for problems to occur naturally, we should actively probe the boundaries of system performance through controlled stress conditions. This approach reveals failure modes before they impact patients while providing valuable data about system robustness.
Designing Falsifiable Quality Systems
The practical challenge of designing falsifiable quality systems requires a fundamental reconceptualization of how we approach quality assurance. Instead of building systems designed to prevent all possible failures, we need systems designed to fail in instructive ways when our underlying assumptions are incorrect.
This approach starts with making our assumptions explicit and testable. Traditional quality systems often embed numerous unstated assumptions about process behavior, material characteristics, environmental conditions, and human performance. These assumptions are rarely articulated clearly enough to be tested, making the systems inherently unfalsifiable. A falsifiable quality system makes these assumptions explicit and designs tests to evaluate their validity.
Consider the design of a typical pharmaceutical manufacturing process. Traditional approaches focus on demonstrating that the process consistently produces product meeting specifications under defined conditions. This demonstration typically involves process validation studies that show the process works under idealized conditions, followed by ongoing monitoring to detect deviations from expected performance.
A falsifiable approach would start by articulating specific hypotheses about what drives process performance. We might hypothesize that product quality is primarily determined by three critical process parameters, that these parameters interact in predictable ways, and that environmental variations within specified ranges don’t significantly impact these relationships. Each of these hypotheses can be tested and potentially falsified through designed experiments or systematic observation of process performance.
The key insight is that falsifiable quality systems are designed around testable theories of what makes quality systems effective, rather than around defensive strategies for preventing all possible problems. This shift enables genuine learning and continuous improvement because we can distinguish between interventions that work for the right reasons and those that appear to work for unknown or incorrect reasons.
Structured Hypothesis Formation: Quality requirements should be built around explicit hypotheses about cause-and-effect relationships in critical processes. These hypotheses should be specific enough to be tested and potentially falsified through systematic observation or experimentation.
Predictive Monitoring: Instead of monitoring for compliance with specifications, systems should monitor for deviations from predicted behavior. When predictions prove incorrect, this provides valuable information about the accuracy of our underlying process understanding.
Experimental Integration: Routine operations should be designed to provide ongoing tests of system hypotheses. Process changes, material variations, and environmental fluctuations should be treated as natural experiments that provide data about system behavior rather than disturbances to be minimized.
Failure Mode Anticipation: Quality systems should explicitly anticipate the ways failures might happen and design detection mechanisms for these failure modes. This proactive approach contrasts with reactive systems that only detect problems after they occur.
The Evolution of Risk Assessment: From Compliance to Science
The evolution of pharmaceutical risk assessment from compliance-focused activities to genuine scientific inquiry represents one of the most significant opportunities for improving quality outcomes. Traditional risk assessments often function primarily as documentation exercises designed to satisfy regulatory requirements rather than tools for genuine learning and improvement.
ICH Q9(R1) recognizes this limitation and calls for more scientifically rigorous approaches to quality risk management. The updated guidance emphasizes the need for risk assessments to be based on scientific knowledge and to provide actionable insights for quality improvement. This represents a shift away from checklist-based compliance activities toward hypothesis-driven scientific inquiry.
The integration of falsifiability principles with ICH Q9(R1) requirements creates opportunities for more rigorous and useful risk assessments. Instead of asking generic questions about what could go wrong, falsifiable risk assessments develop specific hypotheses about failure modes and design tests to evaluate these hypotheses. This approach provides more actionable insights while meeting regulatory expectations for systematic risk evaluation.
Consider the evolution of Failure Mode and Effects Analysis (FMEA) from a traditional compliance tool to a falsifiable risk assessment method. Traditional FMEA often devolves into generic lists of potential failures with subjective probability and impact assessments. The results provide limited insight because the assessments can’t be systematically tested or validated.
A falsifiable FMEA would start with specific hypotheses about failure mechanisms and their relationships to process parameters, material characteristics, or operational conditions. These hypotheses would be tested through historical data analysis, designed experiments, or systematic monitoring programs. The results would provide genuine insights into system behavior while creating a foundation for continuous improvement.
This evolution requires changes in how we approach several key risk assessment activities:
Hazard Identification: Instead of brainstorming all possible things that could go wrong, risk identification should focus on developing testable hypotheses about specific failure mechanisms and their triggers.
Risk Analysis: Probability and impact assessments should be based on testable models of system behavior rather than subjective expert judgment. When models prove inaccurate, this provides valuable information about the need to revise our understanding of system dynamics.
Risk Control: Control measures should be designed around testable theories of how interventions affect system behavior. The effectiveness of controls should be evaluated through systematic monitoring and periodic testing rather than assumed based on their implementation.
Risk Review: Risk review activities should focus on testing the accuracy of previous risk predictions and updating risk models based on new evidence. This creates a learning loop that continuously improves the quality of risk assessments over time.
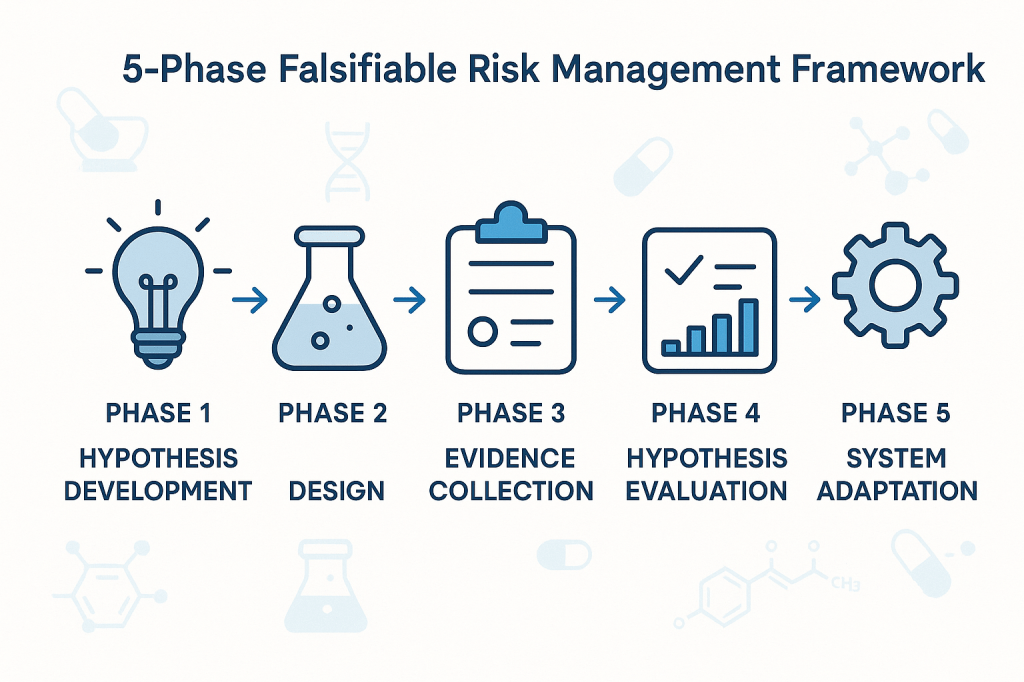
Practical Framework for Falsifiable Quality Risk Management
The implementation of falsifiable quality risk management requires a systematic framework that integrates Popperian principles with practical pharmaceutical quality requirements. This framework must be sophisticated enough to generate genuine scientific insights while remaining practical for routine quality management activities.
The foundation of this framework rests on the principle that effective quality systems are built around testable theories of what drives quality outcomes. These theories should make specific predictions that can be evaluated through systematic observation, controlled experimentation, or historical data analysis. When predictions prove incorrect, this provides valuable information about the need to revise our understanding of system behavior.
Phase 1: Hypothesis Development
The first phase involves developing specific, testable hypotheses about system behavior. These hypotheses should address fundamental questions about what drives quality outcomes in specific operational contexts. Rather than generic statements about quality risks, hypotheses should make specific predictions about relationships between process parameters, material characteristics, environmental conditions, and quality outcomes.
For example, instead of the generic hypothesis that “temperature variations affect product quality,” a falsifiable hypothesis might state that “temperature excursions above 25°C for more than 30 minutes during the mixing phase increase the probability of out-of-specification results by at least 20%.” This hypothesis is specific enough to be tested and potentially falsified through systematic data collection and analysis.
Phase 2: Experimental Design
The second phase involves designing systematic approaches to test the hypotheses developed in Phase 1. This might involve controlled experiments, systematic analysis of historical data, or structured monitoring programs designed to capture relevant data about hypothesis validity.
The key principle is that testing approaches should be capable of falsifying the hypotheses if they are incorrect. This requires careful attention to statistical power, measurement systems, and potential confounding factors that might obscure true relationships between variables.
Phase 3: Evidence Collection
The third phase focuses on systematic collection of evidence relevant to hypothesis testing. This evidence might come from designed experiments, routine monitoring data, or systematic analysis of historical performance. The critical requirement is that evidence collection should be structured around hypothesis testing rather than generic performance monitoring.
Evidence collection systems should be designed to detect when hypotheses are incorrect, not just when systems are performing within specifications. This requires more sophisticated approaches to data analysis and interpretation than traditional compliance-focused monitoring.
Phase 4: Hypothesis Evaluation
The fourth phase involves systematic evaluation of evidence against the hypotheses developed in Phase 1. This evaluation should follow rigorous statistical methods and should be designed to reach definitive conclusions about hypothesis validity whenever possible.
When hypotheses are falsified, this provides valuable information about the need to revise our understanding of system behavior. When hypotheses are supported by evidence, this provides confidence in our current understanding while suggesting areas for further testing and refinement.
Phase 5: System Adaptation
The final phase involves adapting quality systems based on the insights gained through hypothesis testing. This might involve modifying control strategies, updating risk assessments, or redesigning monitoring programs based on improved understanding of system behavior.
The critical principle is that system adaptations should be based on genuine learning about system behavior rather than reactive responses to compliance issues or external pressures. This creates a foundation for continuous improvement that builds cumulative knowledge about what drives quality outcomes.
Implementation Challenges
The transition to falsifiable quality risk management faces several practical challenges that must be addressed for successful implementation. These challenges range from technical issues related to experimental design and statistical analysis to cultural and organizational barriers that may resist more scientifically rigorous approaches to quality management.
Technical Challenges
The most immediate technical challenge involves designing falsifiable hypotheses that are relevant to pharmaceutical quality management. Many quality professionals have extensive experience with compliance-focused activities but limited experience with experimental design and hypothesis testing. This skills gap must be addressed through targeted training and development programs.
Statistical power represents another significant technical challenge. Many quality systems operate with very low baseline failure rates, making it difficult to design experiments with adequate power to detect meaningful differences in system performance. This requires sophisticated approaches to experimental design and may necessitate longer observation periods or larger sample sizes than traditionally used in quality management.
Measurement systems present additional challenges. Many pharmaceutical quality attributes are difficult to measure precisely, introducing uncertainty that can obscure true relationships between process parameters and quality outcomes. This requires careful attention to measurement system validation and uncertainty quantification.
Cultural and Organizational Challenges
Perhaps more challenging than technical issues are the cultural and organizational barriers to implementing more scientifically rigorous quality management approaches. Many pharmaceutical organizations have deeply embedded cultures that prioritize risk avoidance and compliance over learning and improvement.
The shift to falsifiable quality management requires cultural change that embraces controlled failure as a learning opportunity rather than something to be avoided at all costs. This represents a fundamental change in how many organizations think about quality management and may encounter significant resistance.
Regulatory relationships present additional organizational challenges. Many quality professionals worry that more rigorous scientific approaches to quality management might raise regulatory concerns or create compliance burdens. This requires careful communication with regulatory agencies to demonstrate that falsifiable approaches enhance rather than compromise patient safety.
Strategic Solutions
Successfully implementing falsifiable quality risk management requires strategic approaches that address both technical and cultural challenges. These solutions must be tailored to specific organizational contexts while maintaining scientific rigor and regulatory compliance.
Pilot Programs: Implementation should begin with carefully selected pilot programs in areas where falsifiable approaches can demonstrate clear value. These pilots should be designed to generate success stories that support broader organizational adoption while building internal capability and confidence.
Training and Development: Comprehensive training programs should be developed to build organizational capability in experimental design, statistical analysis, and hypothesis testing. These programs should be tailored to pharmaceutical quality contexts and should emphasize practical applications rather than theoretical concepts.
Regulatory Engagement: Proactive engagement with regulatory agencies should emphasize how falsifiable approaches enhance patient safety through improved understanding of system behavior. This communication should focus on the scientific rigor of the approach rather than on business benefits that might appear secondary to regulatory objectives.
Cultural Change Management: Systematic change management programs should address cultural barriers to embracing controlled failure as a learning opportunity. These programs should emphasize how falsifiable approaches support regulatory compliance and patient safety rather than replacing these priorities with business objectives.
Case Studies: Falsifiability in Practice
The practical application of falsifiable quality risk management can be illustrated through several case studies that demonstrate how Popperian principles can be integrated with routine pharmaceutical quality activities. These examples show how hypotheses can be developed, tested, and used to improve quality outcomes while maintaining regulatory compliance.
Case Study 1: Cleaning Validation Optimization
A biologics manufacturer was experiencing occasional cross-contamination events despite having validated cleaning procedures that consistently met acceptance criteria. Traditional approaches focused on demonstrating that cleaning procedures reduced contamination below specified limits, but provided no insight into the factors that occasionally caused this system to fail.
The falsifiable approach began with developing specific hypotheses about cleaning effectiveness. The team hypothesized that cleaning effectiveness was primarily determined by three factors: contact time with cleaning solution, mechanical action intensity, and rinse water temperature. They further hypothesized that these factors interacted in predictable ways and that current procedures provided a specific margin of safety above minimum requirements.
These hypotheses were tested through a designed experiment that systematically varied each cleaning parameter while measuring residual contamination levels. The results revealed that current procedures were adequate under ideal conditions but provided minimal margin of safety when multiple factors were simultaneously at their worst-case levels within specified ranges.
Based on these findings, the cleaning procedure was modified to provide greater margin of safety during worst-case conditions. More importantly, ongoing monitoring was redesigned to test the continued validity of the hypotheses about cleaning effectiveness rather than simply verifying compliance with acceptance criteria.
Case Study 2: Process Control Strategy Development
A pharmaceutical manufacturer was developing a control strategy for a new manufacturing process. Traditional approaches would have focused on identifying critical process parameters and establishing control limits based on process validation studies. Instead, the team used a falsifiable approach that started with explicit hypotheses about process behavior.
The team hypothesized that product quality was primarily controlled by the interaction between temperature and pH during the reaction phase, that these parameters had linear effects on product quality within the normal operating range, and that environmental factors had negligible impact on these relationships.
These hypotheses were tested through systematic experimentation during process development. The results confirmed the importance of the temperature-pH interaction but revealed nonlinear effects that weren’t captured in the original hypotheses. More importantly, environmental humidity was found to have significant effects on process behavior under certain conditions.
The control strategy was designed around the revised understanding of process behavior gained through hypothesis testing. Ongoing process monitoring was structured to continue testing key assumptions about process behavior rather than simply detecting deviations from target conditions.
Case Study 3: Supplier Quality Management
A biotechnology company was managing quality risks from a critical raw material supplier. Traditional approaches focused on incoming inspection and supplier auditing to verify compliance with specifications and quality system requirements. However, occasional quality issues suggested that these approaches weren’t capturing all relevant quality risks.
The falsifiable approach started with specific hypotheses about what drove supplier quality performance. The team hypothesized that supplier quality was primarily determined by their process control during critical manufacturing steps, that certain environmental conditions increased the probability of quality issues, and that supplier quality system maturity was predictive of long-term quality performance.
These hypotheses were tested through systematic analysis of supplier quality data, enhanced supplier auditing focused on specific process control elements, and structured data collection about environmental conditions during material manufacturing. The results revealed that traditional quality system assessments were poor predictors of actual quality performance, but that specific process control practices were strongly predictive of quality outcomes.
The supplier management program was redesigned around the insights gained through hypothesis testing. Instead of generic quality system requirements, the program focused on specific process control elements that were demonstrated to drive quality outcomes. Supplier performance monitoring was structured around testing continued validity of the relationships between process control and quality outcomes.
Measuring Success in Falsifiable Quality Systems
The evaluation of falsifiable quality systems requires fundamentally different approaches to performance measurement than traditional compliance-focused systems. Instead of measuring the absence of problems, we need to measure the presence of learning and the accuracy of our predictions about system behavior.
Traditional quality metrics focus on outcomes: defect rates, deviation frequencies, audit findings, and regulatory observations. While these metrics remain important for regulatory compliance and business performance, they provide limited insight into whether our quality systems are actually effective or merely lucky. Falsifiable quality systems require additional metrics that evaluate the scientific validity of our approach to quality management.
Predictive Accuracy Metrics
The most direct measure of a falsifiable quality system’s effectiveness is the accuracy of its predictions about system behavior. These metrics evaluate how well our hypotheses about quality system behavior match observed outcomes. High predictive accuracy suggests that we understand the underlying drivers of quality outcomes. Low predictive accuracy indicates that our understanding needs refinement.
Predictive accuracy metrics might include the percentage of process control predictions that prove correct, the accuracy of risk assessments in predicting actual quality issues, or the correlation between predicted and observed responses to process changes. These metrics provide direct feedback about the validity of our theoretical understanding of quality systems.
Learning Rate Metrics
Another important category of metrics evaluates how quickly our understanding of quality systems improves over time. These metrics measure the rate at which falsified hypotheses lead to improved system performance or more accurate predictions. High learning rates indicate that the organization is effectively using falsifiable approaches to improve quality outcomes.
Learning rate metrics might include the time required to identify and correct false assumptions about system behavior, the frequency of successful process improvements based on hypothesis testing, or the rate of improvement in predictive accuracy over time. These metrics evaluate the dynamic effectiveness of falsifiable quality management approaches.
Hypothesis Quality Metrics
The quality of hypotheses generated by quality risk management processes represents another important performance dimension. High-quality hypotheses are specific, testable, and relevant to important quality outcomes. Poor-quality hypotheses are vague, untestable, or focused on trivial aspects of system performance.
Hypothesis quality can be evaluated through structured peer review processes, assessment of testability and specificity, and evaluation of relevance to critical quality attributes. Organizations with high-quality hypothesis generation processes are more likely to gain meaningful insights from their quality risk management activities.
System Robustness Metrics
Falsifiable quality systems should become more robust over time as learning accumulates and system understanding improves. Robustness can be measured through the system’s ability to maintain performance despite variations in operating conditions, changes in materials or equipment, or other sources of uncertainty.
Robustness metrics might include the stability of process performance across different operating conditions, the effectiveness of control strategies under stress conditions, or the system’s ability to detect and respond to emerging quality risks. These metrics evaluate whether falsifiable approaches actually lead to more reliable quality systems.
Regulatory Implications and Opportunities
The integration of falsifiable principles with pharmaceutical quality risk management creates both challenges and opportunities in regulatory relationships. While some regulatory agencies may initially view scientific approaches to quality management with skepticism, the ultimate result should be enhanced regulatory confidence in quality systems that can demonstrate genuine understanding of what drives quality outcomes.
The key to successful regulatory engagement lies in emphasizing how falsifiable approaches enhance patient safety rather than replacing regulatory compliance with business optimization. Regulatory agencies are primarily concerned with patient safety and product quality. Falsifiable quality systems support these objectives by providing more rigorous and reliable approaches to ensuring quality outcomes.
Enhanced Regulatory Submissions
Regulatory submissions based on falsifiable quality systems can provide more compelling evidence of system effectiveness than traditional compliance-focused approaches. Instead of demonstrating that systems meet minimum requirements, falsifiable approaches can show genuine understanding of what drives quality outcomes and how systems will behave under different conditions.
This enhanced evidence can support regulatory flexibility in areas such as process validation, change control, and ongoing monitoring requirements. Regulatory agencies may be willing to accept risk-based approaches to these activities when they’re supported by rigorous scientific evidence rather than generic compliance activities.
Proactive Risk Communication
Falsifiable quality systems enable more proactive and meaningful communication with regulatory agencies about quality risks and mitigation strategies. Instead of reactive communication about compliance issues, organizations can engage in scientific discussions about system behavior and improvement strategies.
This proactive communication can build regulatory confidence in organizational quality management capabilities while providing opportunities for regulatory agencies to provide input on scientific approaches to quality improvement. The result should be more collaborative regulatory relationships based on shared commitment to scientific rigor and patient safety.
Regulatory Science Advancement
The pharmaceutical industry’s adoption of more scientifically rigorous approaches to quality management can contribute to the advancement of regulatory science more broadly. Regulatory agencies benefit from industry innovations in risk assessment, process understanding, and quality assurance methods.
Organizations that successfully implement falsifiable quality risk management can serve as case studies for regulatory guidance development and can provide evidence for the effectiveness of science-based approaches to quality assurance. This contribution to regulatory science advancement creates value that extends beyond individual organizational benefits.
Toward a More Scientific Quality Culture
The long-term vision for falsifiable quality risk management extends beyond individual organizational implementations to encompass fundamental changes in how the pharmaceutical industry approaches quality assurance. This vision includes more rigorous scientific approaches to quality management, enhanced collaboration between industry and regulatory agencies, and continuous advancement in our understanding of what drives quality outcomes.
Industry-Wide Learning Networks
One promising direction involves the development of industry-wide learning networks that share insights from falsifiable quality management implementations. These networks facilitate collaborative hypothesis testing, shared learning from experimental results, and development of common methodologies for scientific approaches to quality assurance.
Such networks accelerate the advancement of quality science while maintaining appropriate competitive boundaries. Organizations should share methodological insights and general findings while protecting proprietary information about specific processes or products. The result would be faster advancement in quality management science that benefits the entire industry.
Advanced Analytics Integration
The integration of advanced analytics and machine learning techniques with falsifiable quality management approaches represents another promising direction. These technologies can enhance our ability to develop testable hypotheses, design efficient experiments, and analyze complex datasets to evaluate hypothesis validity.
Machine learning approaches are particularly valuable for identifying patterns in complex quality datasets that might not be apparent through traditional analysis methods. However, these approaches must be integrated with falsifiable frameworks to ensure that insights can be validated and that predictive models can be systematically tested and improved.
Regulatory Harmonization
The global harmonization of regulatory approaches to science-based quality management represents a significant opportunity for advancing patient safety and regulatory efficiency. As individual regulatory agencies gain experience with falsifiable quality management approaches, there are opportunities to develop harmonized guidance that supports consistent global implementation.
ICH Q9(r1) was a great step. I would love to see continued work in this area.
Embracing the Discomfort of Scientific Rigor
The transition from compliance-focused to scientifically rigorous quality risk management represents more than a methodological change—it requires fundamentally rethinking how we approach quality assurance in pharmaceutical manufacturing. By embracing Popper’s challenge that genuine scientific theories must be falsifiable, we move beyond the comfortable but ultimately unhelpful world of proving negatives toward the more demanding but ultimately more rewarding world of testing positive claims about system behavior.
The effectiveness paradox that motivates this discussion—the problem of determining what works when our primary evidence is that “nothing bad happened”—cannot be resolved through better compliance strategies or more sophisticated documentation. It requires genuine scientific inquiry into the mechanisms that drive quality outcomes. This inquiry must be built around testable hypotheses that can be proven wrong, not around defensive strategies that can always accommodate any possible outcome.
The practical implementation of falsifiable quality risk management is not without challenges. It requires new skills, different cultural approaches, and more sophisticated methodologies than traditional compliance-focused activities. However, the potential benefits—genuine learning about system behavior, more reliable quality outcomes, and enhanced regulatory confidence—justify the investment required for successful implementation.
Perhaps most importantly, the shift to falsifiable quality management moves us toward a more honest assessment of what we actually know about quality systems versus what we merely assume or hope to be true. This honesty is uncomfortable but essential for building quality systems that genuinely serve patient safety rather than organizational comfort.
The question is not whether pharmaceutical quality management will eventually embrace more scientific approaches—the pressures of regulatory evolution, competitive dynamics, and patient safety demands make this inevitable. The question is whether individual organizations will lead this transition or be forced to follow. Those that embrace the discomfort of scientific rigor now will be better positioned to thrive in a future where quality management is evaluated based on genuine effectiveness rather than compliance theater.
As we continue to navigate an increasingly complex regulatory and competitive environment, the organizations that master the art of turning uncertainty into testable knowledge will be best positioned to deliver consistent quality outcomes while maintaining the flexibility needed for innovation and continuous improvement. The integration of Popperian falsifiability with modern quality risk management provides a roadmap for achieving this mastery while maintaining the rigorous standards our industry demands.
The path forward requires courage to question our current assumptions, discipline to design rigorous tests of our theories, and wisdom to learn from both our successes and our failures. But for those willing to embrace these challenges, the reward is quality systems that are not only compliant but genuinely effective. Systems that we can defend not because they’ve never been proven wrong, but because they’ve been proven right through systematic, scientific inquiry.