I get really confused on the differences between compounding pharmacies and outsourcing facilities. I’ve never worked at either, but see a lot of 483s and warning letters. So today I spent some snow day time doing some reading. I then wrote this up as a reminder to myself.
The Drug Quality and Security Act (DQSA) of 2013 introduced significant changes by distinguishing between compounding pharmacies under Section 503A and outsourcing facilities under Section 503B of the Federal Food, Drug, and Cosmetic Act (FDCA). This distinction is crucial for ensuring the safety and quality of compounded drugs.
Compounding Pharmacies (503A)
Definition and Purpose: Compounding pharmacies are licensed by state boards of pharmacy and primarily focus on creating customized medications for individual patients when commercially available drugs do not meet their needs. These pharmacies must adhere to standards set by the United States Pharmacopeia (USP), such as USP 797 for sterile compounding and USP 800 for hazardous drugs.
Regulatory Framework: Compounding pharmacies operate under the supervision of a licensed pharmacist and require a prescription for each compounded product. They are generally limited to small batches and are not allowed to engage in office-use compounding without a prescription.
Outsourcing Facilities (503B)
Definition and Purpose: Outsourcing facilities, on the other hand, are registered with the FDA and specialize in producing large batches of sterile drugs, often without the need for individual prescriptions. These facilities are designed to address drug shortages and provide complex or rarely compounded preparations to healthcare organizations.
Regulatory Framework: Unlike 503A pharmacies, 503B facilities must comply with FDA’s Current Good Manufacturing Practices (CGMP) to ensure the quality and safety of their products. They are subject to regular FDA inspections and must report on their compounded products.
Recent Regulatory Actions: The Case of ProRx, LLC
This research came about because I was reading a recent warning letter issued to ProRx, LLC, which basically stated they were failing to comply with CGMP regulations for 503B outsourcing facilities. The FDA identified serious deficiencies in sterile drug production practices, posing significant patient safety risks.
Implications for 503B Facilities
The warning letter to ProRx, LLC, serves as a reminder of the high regulatory bar set for 503B outsourcing facilities. Key implications include:
Enhanced Oversight: The FDA’s ability to inspect and enforce cGMP compliance means that 503B facilities must maintain meticulous quality control and production standards.
Patient Safety: The primary concern is ensuring that compounded drugs are safe for use. Facilities must address any deficiencies promptly to avoid recalls and protect patient health.
Partnerships and Supply Chain: The ability of 503B facilities to supply compounded drugs to healthcare organizations and pharmacies relies on their compliance with FDA regulations. Non-compliance can disrupt supply chains and impact patient access to necessary medications.
What I take away from my research is that 503B outsourcing facilities are GMP facilities, and are held to the same standard. Good to know as I evaluate their regulatory actions in the future. I think I’ve tended to dismiss them as not being in the same class of regulatory expectations.
Also, this is the second time this month where I really wonder what regulatory agencies fascination with pharmacists are in GMP facilities. Seems pretty clear to me that being a pharmacist is no indication of any capability around GMP activities.
Chang said she’s not surprised by the influence numbers have on behavioral decision-making, but what stands out to her is the robustness of the effect, which was replicated across 21 experiments involving 23,000 randomly selected participants. Despite the significant sample size, the predilection for numbers never wavered, except when numbers were presented in ways that were harder to process. Chang and her co-authors describe the mechanism underlying quantification fixation as “comparison fluency,” or the ease of judging numerical values compared with non-numbers, such as words and pictures.
Katherine Milkman, one of the coauthors, is a scholar I follow pretty closely, and this article seems pretty insightful and I’ll be reading the research this week. Our field has some difficulty here, none no more so in the mixed legacy of Deming on the subject, mostly misinterpretations if you ask me. Mark Graban wrote a great post on that last year.
In complex industries such as aviation and biotechnology, effective communication is crucial for ensuring safety, quality, and efficiency. However, the presence of communication loops and silos can significantly hinder these efforts. The concept of the “Tower of Babel” problem, as explored in the aviation sector by Follet, Lasa, and Mieusset in HS36, highlights how different professional groups develop their own languages and operate within isolated loops, leading to misunderstandings and disconnections. This article has really got me thinking about similar issues in my own industry.
The Tower of Babel Problem: A Thought-Provoking Perspective
The HS36 article provides a thought-provoking perspective on the “Tower of Babel” problem, where each aviation professional feels in control of their work but operates within their own loop. This phenomenon is reminiscent of the biblical story where a common language becomes fragmented, causing confusion and separation among people. In modern industries, this translates into different groups using their own jargon and working in isolation, making it difficult for them to understand each other’s perspectives and challenges.
For instance, in aviation, air traffic controllers (ATCOs), pilots, and managers each have their own “loop,” believing they are in control of their work. However, when these loops are disconnected, it can lead to miscommunication, especially when each group uses different terminology and operates under different assumptions about how work should be done (work-as-prescribed vs. work-as-done). This issue is equally pertinent in the biotech industry, where scientists, quality assurance teams, and regulatory affairs specialists often work in silos, which can impede the development and approval of new products.
Tower of Babel by Joos de Momper, Old Masters Museum
Impact on Decision Making
Decision making in biotech is heavily influenced by Good Practice (GxP) guidelines, which emphasize quality, safety, and compliance – and I often find that the aviation industry, as a fellow highly regulated industry, is a great place to draw perspective.
When communication loops are disconnected, decisions may not fully consider all relevant perspectives. For example, in GMP (Good Manufacturing Practice) environments, quality control teams might focus on compliance with regulatory standards, while research and development teams prioritize innovation and efficiency. If these groups do not effectively communicate, decisions might overlook critical aspects, such as the practicality of implementing new manufacturing processes or the impact on product quality.
Furthermore, ICH Q9(R1) guideline emphasizes the importance of reducing subjectivity in Quality Risk Management (QRM) processes. Subjectivity can arise from personal opinions, biases, or inconsistent interpretations of risks by stakeholders, impacting every stage of QRM. To combat this, organizations must adopt structured approaches that prioritize scientific knowledge and data-driven decision-making. Effective knowledge management is crucial in this context, as it involves systematically capturing, organizing, and applying internal and external knowledge to inform QRM activities.
Academic Research on Communication Loops
Research in organizational behavior and communication highlights the importance of bridging these silos. Studies have shown that informal interactions and social events can significantly improve relationships and understanding among different professional groups (Katz & Fodor, 1963). In the biotech industry, fostering a culture of open communication can help ensure that GxP decisions are well-rounded and effective.
Moreover, the concept of “work-as-done” versus “work-as-prescribed” is relevant in biotech as well. Operators may adapt procedures to fit practical realities, which can lead to discrepancies between intended and actual practices. This gap can be bridged by encouraging feedback and continuous improvement processes, ensuring that decisions reflect both regulatory compliance and operational feasibility.
Case Studies and Examples
Aviation Example: The HS36 article provides a compelling example of how disconnected loops can hinder effective decision making in aviation. For instance, when a standardized phraseology was introduced, frontline operators felt that this change did not account for their operational needs, leading to resistance and potential safety issues. This illustrates how disconnected loops can hinder effective decision making.
Product Development: In the development of a new biopharmaceutical, different teams might have varying priorities. If the quality assurance team focuses solely on regulatory compliance without fully understanding the manufacturing challenges faced by production teams, this could lead to delays or quality issues. By fostering cross-functional communication, these teams can align their efforts to ensure both compliance and operational efficiency.
ICH Q9(R1) Example: The revised ICH Q9(R1) guideline emphasizes the need to manage and minimize subjectivity in QRM. For instance, in assessing the risk of a new manufacturing process, a structured approach using historical data and scientific evidence can help reduce subjective biases. This ensures that decisions are based on comprehensive data rather than personal opinions.
Technology Deployment: . A recent FDA Warning Letter to Sanofi highlighted the importance of timely technological upgrades to equipment and facility infrastructure. This emphasizes that staying current with technological advancements is essential for maintaining regulatory compliance and ensuring product quality. However the individual loops of decision making amongst the development teams, operations and quality can lead to major mis-steps.
To overcome the challenges posed by communication loops and silos, organizations can implement several strategies:
Promote Cross-Functional Training: Encourage professionals to explore other roles and challenges within their organization. This can help build empathy and understanding across different departments.
Foster Informal Interactions: Organize social events and informal meetings where professionals from different backgrounds can share experiences and perspectives. This can help bridge gaps between silos and improve overall communication.
Define Core Knowledge: Establish a minimum level of core knowledge that all stakeholders should possess. This can help ensure that everyone has a basic understanding of each other’s roles and challenges.
Implement Feedback Loops: Encourage continuous feedback and improvement processes. This allows organizations to adapt procedures to better reflect both regulatory requirements and operational realities.
Leverage Knowledge Management: Implement robust knowledge management systems to reduce subjectivity in decision-making processes. This involves capturing, organizing, and applying internal and external knowledge to inform QRM activities.
Combating Subjectivity in Decision Making
In addition to bridging communication loops, reducing subjectivity in decision making is crucial for ensuring quality and safety. The revised ICH Q9(R1) guideline provides several strategies for this:
Structured Approaches: Use structured risk assessment tools and methodologies to minimize personal biases and ensure that decisions are based on scientific evidence.
Data-Driven Decision Making: Prioritize data-driven decision making by leveraging historical data and real-time information to assess risks and opportunities.
Cognitive Bias Awareness: Train stakeholders to recognize and mitigate cognitive biases that can influence risk assessments and decision-making processes.
Conclusion
In complex industries effective communication is essential for ensuring safety, quality, and efficiency. The presence of communication loops and silos can lead to misunderstandings and poor decision making. By promoting cross-functional understanding, fostering informal interactions, and implementing feedback mechanisms, organizations can bridge these gaps and improve overall performance. Additionally, reducing subjectivity in decision making through structured approaches and data-driven decision making is critical for ensuring compliance with GxP guidelines and maintaining product quality. As industries continue to evolve, addressing these communication challenges will be crucial for achieving success in an increasingly interconnected world.
Katz, D., & Fodor, J. (1963). The Structure of a Semantic Theory. Language, 39(2), 170–210.
Dekker, S. W. A. (2014). The Field Guide to Understanding Human Error. Ashgate Publishing.
Shorrock, S. (2023). Editorial. Who are we to judge? From work-as-done to work-as-judged. HindSight, 35, Just Culture…Revisited. Brussels: EUROCONTROL.
Great thought piece on the use of “reputation” in purpose statement, which should include quality policies.
Writing a quality policy is a crucial step in establishing a quality management system within an organization. Here are some best practices to consider when crafting an effective quality policy:
Key Components of a Quality Policy
Management’s Quality Commitment
The Quality Policy reflects top management’s dedication to quality standards. It includes clear quality objectives, resource allocation, regular policy reviews, active participation in quality initiatives, and support for quality-focused training. The quality policy is a lynchpin artifact to quality culture.
Customer-Centric Approach
Identify customer requirements.
Meet customer expectations.
Handle customer feedback.
Improve customer satisfaction.
Track customer experience metrics
Drive for Continuous Improvement
Regularly evaluate process effectiveness, product quality metrics, service delivery standards, employee performance, and quality management systems. Document specific improvement methods and set measurable targets.
Steps to Write a Quality Policy
Define the Quality Vision
Develop a concise and inspiring statement that describes what quality means to your organization and how it supports your mission and values.
Identify Quality Objectives
Align these objectives with your strategic goals and customer needs.
Develop the Quality Policy
Focus on clear, actionable statements that reflect your organization’s quality commitments. Include specific quality objectives, measurement criteria, and implementation strategies.
Communicate the Quality Policy
Ensure all employees understand the policy and their roles in implementing it. Use various channels such as publishing on the company website or displaying in premises.
Implement and Review:
Create a structured implementation timeline with clear milestones. Establish communication channels for ongoing feedback and questions. Make sure employees at all levels are involved. Regularly review and refine the policy to ensure it remains relevant and effective.
Additional Best Practices
Keep it Simple and Relevant: Ensure the policy is easy to understand and aligns with your organization’s strategic direction.
Top Management Involvement: Top management should actively participate in creating and endorsing the policy to demonstrate leadership commitment.
ISO Compliance: If applicable, ensure the policy meets ISO standards such as ISO 9001:2015, which requires the policy to be documented, communicated, and enforced by top management.
By following these guidelines, you can create a quality policy that effectively guides your organization towards achieving its quality goals and maintaining a culture of excellence.
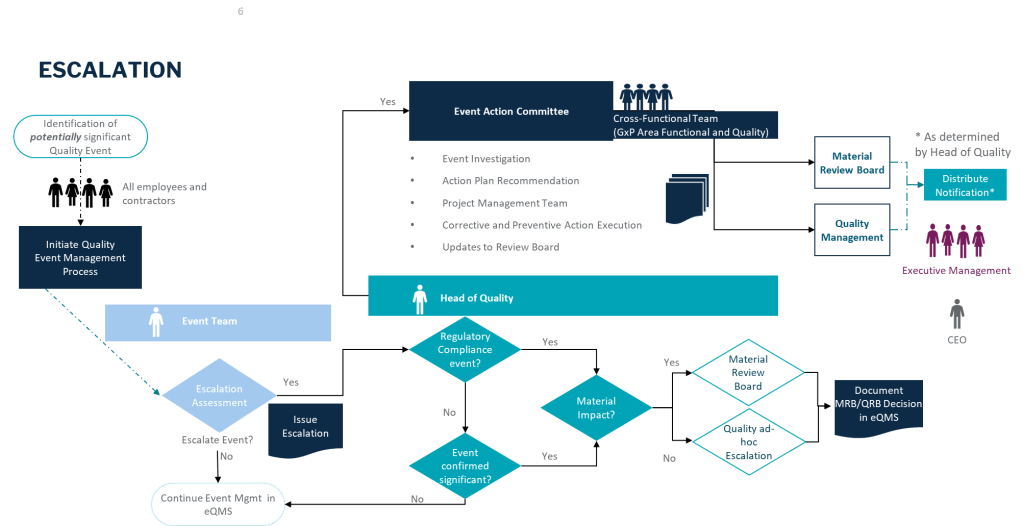
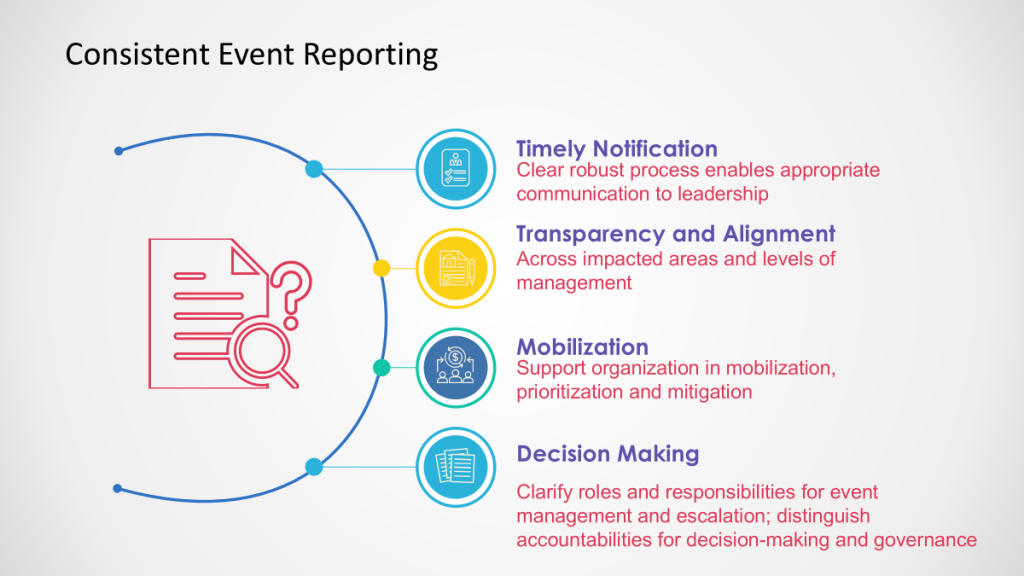
Quality escalation is a critical process in maintaining the integrity of products, particularly in industries governed by Good Practices (GxP) such as pharmaceuticals and biotechnology. Effective escalation ensures that issues are addressed promptly, preventing potential risks to product quality and patient safety. This blog post will explore best practices for quality escalation, focusing on GxP compliance and the implications for regulatory notifications.
Understanding Quality Escalation
Quality escalation involves raising unresolved issues to higher management levels for timely resolution. This process is essential in environments where compliance with GxP regulations is mandatory. The primary goal is to ensure that products are manufactured, tested, and distributed in a manner that maintains their quality and safety.
This is a requirement across all the regulations, including clinical. ICH E6(r3) emphasizes the importance of effective monitoring and oversight to ensure that clinical trials are conducted in compliance with GCP and regulatory requirements. This includes identifying and addressing issues promptly.
Key Triggers for Escalation
Identifying triggers for escalation is crucial. Common triggers include:
Regulatory Compliance Issues: Non-compliance with regulatory requirements can lead to product quality issues and necessitate escalation.
Quality Control Failures: Failures in quality control processes, such as testing or inspection, can impact product safety and quality.
Data Integrity: Significant concerns and failures in quality of data.
Supply Chain Disruptions: Disruptions in the supply chain can affect the availability of critical components or materials, potentially impacting product quality.
Patient Safety Concerns: Any issues related to patient safety, such as adverse events or potential safety risks, should be escalated immediately.
Escalation Criteria
Examples of Quality Events for Escalation
Potential to adversely affect quality, safety, efficacy, performance or compliance of product (commercial or clinical)
•Contamination (product, raw material, equipment, micro; environmental) •Product defect/deviation from process parameters or specification (on file with agencies, e.g. CQAs and CPPs) •Significant GMP deviations •Incorrect/deficient labeling •Product complaints (significant PC, trends in PCs) •OOS/OOT (e.g.; stability)
Product counterfeiting, tampering, theft
•Product counterfeiting, tampering, theft reportable to Health Authority (HA) •Lost/stolen IMP •Fraud or misconduct associated with counterfeiting, tampering, theft •Potential to impact product supply (e.g.; removal, correction, recall)
Product shortage likely to disrupt patient care and/or reportable to HA
•Disruption of product supply due to product quality events, natural disasters (business continuity disruption), OOS impact, capacity constraints
Potential to cause patient harm associated with a product quality event
•Urgent Safety Measure, Serious Breach, Significant Product Compliant, Safety Signal that are determined associated with a product quality event
Significant GMP non-compliance/event
•Non-compliance or non-conformance event with potential to impact product performance meeting specification, safety efficacy or regulatory requirements
Regulatory Compliance Event
•Significant (critical, repeat) regulatory inspection findings; lack of commitment adherence •Notification of directed/for cause inspection •Notification of Health Authority correspondence indicating potential regulatory action
Best Practices for Quality Escalation
Proactive Identification: Encourage a culture where team members proactively identify potential issues. Early detection can prevent minor problems from escalating into major crises.
Clear Communication Channels: Establish clear communication channels and protocols for escalating issues. This ensures that the right people are informed promptly and can take appropriate action.
Documentation and Tracking: Use a central repository to document and track issues. This helps in identifying trends, implementing corrective actions, and ensuring compliance with regulatory requirements.
Collaborative Resolution: Foster collaboration between different departments and stakeholders to resolve issues efficiently. This includes involving quality assurance, quality control, and regulatory affairs teams as necessary.
Regulatory Awareness: Be aware of regulatory requirements and ensure that all escalations are handled in a manner that complies with these regulations. This includes maintaining confidentiality when necessary and ensuring transparency with regulatory bodies.
GxP Impact and Regulatory Notifications
In industries governed by GxP, any significant quality issues may require notification to regulatory bodies. This includes situations where product quality or patient safety is compromised. Best practices for handling such scenarios include:
Prompt Notification: Notify regulatory bodies promptly if there is a risk to public health or if regulatory requirements are not met.
Comprehensive Reporting: Ensure that all reports to regulatory bodies are comprehensive, including details of the issue, actions taken, and corrective measures implemented.
Continuous Improvement: Use escalations as opportunities to improve processes and prevent future occurrences. This includes conducting root cause analyses and implementing preventive actions.
Fit with Quality Management Review
This fits within the Quality Management Review band, being an ad hoc triggered review of significant issues, ensuring appropriate leadership attention, and allowing key decisions to be made in a timely manner.
Conclusion
Quality escalation is a vital component of maintaining product quality and ensuring patient safety in GxP environments. By implementing best practices such as proactive issue identification, clear communication, and collaborative resolution, organizations can effectively manage risks and comply with regulatory requirements. Understanding when and how to escalate issues is crucial for preventing potential crises and ensuring that products meet the highest standards of quality and safety.