On January 19, 2026, the EMA GMP/GDP Inspectors Working Group and PIC/S published a concept paper proposing a targeted revision of EU GMP Annex 15—Qualification and Validation. The public consultation opened on February 9 and runs through April 9, 2026. If you work in active substance manufacturing, or if your drug product quality depends on active substance quality—which is to say, if you work in this industry at all—this document deserves your attention.
The headline is straightforward: Annex 15 will become mandatory for active substance manufacturers. But what makes this revision significant isn’t just the shift from optional to mandatory. It’s what the shift reveals about where the regulatory landscape is heading, and how many of the themes I’ve been writing about on this blog—living risk management, control strategy as connective tissue, the validation lifecycle as a knowledge system—are now being codified into explicit regulatory expectations for a sector that has, frankly, lagged behind.
The Nitrosamine Wake-Up Call
The revision traces its origin directly to the N-nitrosamine crisis in sartan medicines. The EMA’s June 2020 lessons-learnt report was unsparing: one root cause of nitrosamine contamination was “the lack of sufficient process and product knowledge during the development stage and GMP deficiencies by active substance manufacturers, including inadequate investigation of quality issues and insufficient contamination control measures”. This wasn’t a novel finding at the time, but the sartans case gave regulators the political and scientific impetus to act.
Paragraph 4.2.2 of that lessons-learnt report specifically recommended making Annex 15 mandatory for active substance manufacturers to address the shortcomings identified during inspections. It took several years of deliberation—the GMP/GDP IWG formally agreed to proceed at its 115th meeting in September 2024—but the wheels are now turning.
The lesson here is one I’ve returned to repeatedly: knowledge gaps don’t stay dormant. They surface as deviations, contamination events, and regulatory actions. The sartans crisis was, at its core, a failure of process understanding and control strategy—areas where Annex 15 is now being strengthened precisely because too many active substance manufacturers treated validation as peripheral rather than foundational.
What the Concept Paper Actually Proposes
Let me walk through the key elements of the proposed revision, because the specifics matter more than the headline.
Scope Extension
The revised Annex 15 will apply to manufacturers of both chemical and biological active substances. EU and PIC/S inspectorates will enforce compliance during regulatory inspections. This is a paradigm shift for API manufacturers who have historically operated under Part II of the EU GMP Guide with Annex 15 as optional supplementary guidance. The concept paper is clear: “Although annex 15 is not currently mandatory for AS manufacturers, the applicability of its principles in this sector is generally recognised”. In other words, the expectation already existed—now it will have enforcement teeth.
Validation Master File, Policy, and Change Control
The concept paper proposes extending the Validation Master File, the Qualification and Validation Policy, and formal change control requirements to active substance manufacturers. These aren’t new concepts for drug product manufacturers, but their extension to AS manufacturers signals a regulatory expectation of structured, documented validation programs rather than ad hoc approaches.
Change control, in particular, is described as “an important part of knowledge management”. This language is deliberate and echoes what I’ve been writing about in the context of control strategies and the feedback-feedforward controls hub: change control isn’t bureaucratic overhead—it’s the mechanism through which accumulated process knowledge is preserved, evaluated, and applied.
Validation Discrepancies
The revision will extend the requirement to investigate results that fail to meet pre-defined acceptance criteria during validation activities. This extension, the concept paper notes, “will promote AS manufacturers to have a more in-depth knowledge of their processes.” This is one of the most quietly important provisions. In my experience, the gap between drug product and active substance manufacturers is often widest in investigation rigor. Robust investigation of validation failures isn’t just about compliance—it’s about generating the process knowledge that underpins meaningful control strategies.
Qualification Stages: URS, FAT/SAT, DQ/IQ/OQ/PQ
The concept paper extends the formal qualification lifecycle—User Requirements Specifications, Factory Acceptance Testing, Site Acceptance Testing, and the traditional DQ/IQ/OQ/PQ sequence—to active substance manufacturing. For those of us who have worked in the ASTM E2500 and ISPE commissioning and qualification frameworks, this is a natural evolution. As I discussed in my posts on CQV and engineering runs, these qualification stages aren’t separate activities—they form a continuum where each stage builds on the knowledge generated in the previous one. Extending this structured approach to API manufacturing strengthens the design-validation continuum that is essential for robust control strategies.
Process Validation: Development, Concurrent Validation, CPV, and Recovery
Several process validation enhancements are proposed:
Emphasis on robust process development: Clarifying that validation begins with development, not with the first PPQ batch.
Clarification of concurrent validation: Tightening expectations on when and how concurrent validation may be used.
Continuous process verification and hybrid approaches: Extending Stage 3/CPV thinking to active substance manufacturing.
Recovery of materials and solvents: Extending validation requirements to solvent and material recovery processes.
Supplier qualification: Emphasizing the role of supplier qualification in the validation ecosystem.
Periodic review: Reinforcing the expectation that validation is a lifecycle activity, not a one-time event.
This aligns directly with what I wrote about in Continuous Process Verification (CPV) Methodology and Tool Selection: CPV is “not an isolated activity but a continuation of the knowledge gained in earlier stages”. The lifecycle approach—Process Design (Stage 1), Process Qualification (Stage 2), Continued Process Verification (Stage 3)—is being explicitly extended to a sector that has too often treated validation as a discrete project rather than an ongoing program.
Transport Verification
The revision extends expectations for transport verification, linking GMP with Good Distribution Practices (GDP) for active substances. This addresses a gap that has been hiding in plain sight: product knowledge must include understanding of how transportation affects quality. For biologically-derived active substances in particular, this provision acknowledges that the supply chain is part of the process, not external to it.
ICH Q9 (R1) Integration
The concept paper mandates incorporation of ICH Q9 (R1) quality risk management principles throughout validation and qualification activities. Specifically:
QRM in the design and validation/qualification of monitoring systems
Risk review activities to support ongoing validation and qualification
Emphasis on QRM in the context of traditional processes
This integration is overdue. As I discussed in Living Risk in the Validation Lifecycle and Risk Management is a Living Process, effective risk management isn’t a one-time exercise performed during design—it’s a living system that evolves throughout the product lifecycle. ICH Q9 (R1) itself emphasizes that “the level of effort, formality and documentation of the quality risk management process should be commensurate with the level of risk.” It introduces the importance-complexity-uncertainty framework for calibrating risk assessment rigor. The Annex 15 revision will make these principles explicitly applicable to qualification and validation decisions in active substance manufacturing.
Why This Matters: The Industry-Wide Implications
Closing the Knowledge Gap
The fundamental driver of this revision is a knowledge deficit. The nitrosamine crisis exposed what many of us already suspected: a significant number of active substance manufacturers lacked the process understanding necessary to predict, prevent, and detect quality problems. Making Annex 15 mandatory doesn’t automatically create knowledge, but it creates the structural requirements—validation master plans, formal qualification stages, investigation requirements, CPV programs—that force organizations to build and maintain it.
As I explored in Control Strategies, control strategies represent “the central mechanism through which pharmaceutical companies ensure quality, manage risk, and leverage knowledge”. Without the foundational process knowledge that structured validation generates, control strategies are hollow documents. The Annex 15 revision, by mandating the validation activities that generate this knowledge for active substance manufacturers, strengthens the entire control strategy ecosystem from the ground up.
From Compliance Burden to Audit Readiness
In my analysis of the 2025 State of Validation data, I noted a striking reversal: audit readiness has overtaken compliance burden as the industry’s primary validation challenge. This shift reflects a maturation of validation programs—organizations are moving from the scramble to implement validation to the discipline of sustaining it. The Annex 15 revision will push active substance manufacturers through a similar maturation arc. The initial impact will feel like compliance burden. But the long-term trajectory, if organizations approach it with the right mindset, is toward sustained audit readiness grounded in genuine process knowledge.
Risk Management as the Connective Thread
The integration of ICH Q9 (R1) throughout the revised Annex 15 reinforces a theme I’ve been tracking across multiple regulatory developments: risk management is no longer a supporting tool—it’s the connective thread that runs through every quality decision. The parallel revision of EudraLex Chapter 1, the new Annex 11 requirements for computerized systems, and the forthcoming Annex 22 for artificial intelligence all place quality risk management at their center. The Annex 15 revision ensures that qualification and validation are no exception.
This convergence means that organizations need integrated risk management capabilities—not siloed risk assessments performed by different teams for different purposes, but a coherent QRM framework that connects design risk, process risk, facility risk, and supply chain risk into a unified picture. As I wrote in my piece on risk management and change management: “Risk management leads to change management. Change management contains risk management”. The revised Annex 15 makes this cycle explicit for active substance manufacturers.
The Control Strategy Connection
Perhaps the most significant implication is how this revision strengthens the link between validation and control strategy. In Control Strategies, I described how control strategies occupy “that critical program-level space between overarching quality policies and detailed operational procedures” and serve as “the blueprint for how quality will be achieved, maintained, and improved throughout a product’s lifecycle”.
The Annex 15 revision reinforces every dimension of this blueprint for active substance manufacturing:
Validation Master File → documents the overall validation approach and connects it to the control strategy
Formal qualification stages → ensure that facility and equipment design supports the intended control strategy
Process validation with CPV → generates the ongoing data that validates and refines the control strategy
Investigation of failures → feeds new knowledge back into the control strategy through the feedback loop
Change control as knowledge management → ensures that the control strategy evolves based on accumulated understanding
Transport verification → extends the control strategy to encompass the supply chain
This is the feedback-feedforward controls hub in action. Each element of the revised Annex 15 either generates knowledge that feeds into the control strategy or applies knowledge from the control strategy to operational decisions.
The PLCM Document and Established Conditions
Looking forward, this revision also has implications for how active substance manufacturers engage with ICH Q12 concepts. As I discussed in my recent post on the Product Lifecycle Management (PLCM) document, the distinction between comprehensive control strategy elements and Established Conditions is critical for enabling continuous improvement. Active substance manufacturers who build robust validation and knowledge management programs now—in response to the Annex 15 revision—will be better positioned to participate in lifecycle management frameworks that reward process understanding with regulatory flexibility.
The concept paper’s emphasis on “change control as an important part of knowledge management” directly supports this trajectory. Organizations that treat change control as a bureaucratic hurdle will miss the point. Those that treat it as a knowledge capture mechanism will find themselves building the foundation for more sophisticated lifecycle management.
The Timeline and What to Do Now
The proposed timetable is aggressive:
Milestone
Date
Concept paper public consultation
February – April 2026
Draft guideline consultation
April – June 2026
EMA GMP/GDP IWG endorsement
July 2026
Publication by European Commission
December 2026
PIC/S adoption
December 2026
The concept paper includes four stakeholder questions that are worth engaging with seriously:
What is the current level of use of Annex 15 principles in active substance manufacturing?
What would be the impact of making Annex 15 mandatory?
What is the current understanding and use of ICH Q9 (R1) in active substance manufacturing?
What would be the impact of incorporating Q9 (R1)?
If you manufacture active substances—or if you’re a drug product manufacturer who depends on active substance suppliers—now is the time to:
Perform a gap assessment against the current Annex 15 requirements, assuming mandatory application
Evaluate your Validation Master Plan or equivalent program documentation for active substance operations
Review your qualification lifecycle to ensure URS, FAT/SAT, and formal qualification stages are documented and traceable
Assess your CPV program for active substance processes—does it exist? Is it generating actionable knowledge?
Examine your investigation process for validation failures against pre-defined acceptance criteria
Review your QRM integration into qualification and validation activities against ICH Q9 (R1) expectations
Engage with the public consultation by the April 9, 2026 deadline
The Bigger Picture
The concept paper notes that the GMP/GDP IWG also agreed that “a comprehensive review of Annex 15 should be initiated in the future, once the current targeted revision is finished”. This targeted revision is just the beginning. A full-scope revision will likely address the broader evolution of validation thinking—digital systems, advanced analytics, platform approaches—that I’ve been tracking in posts on the evolving validation landscape.
The world of validation is no longer controlled by periodic updates or leisurely transitions. Change is the new baseline. The Annex 15 revision is another data point in a pattern that includes the Annex 1 overhaul, the Annex 11 modernization, the introduction of Annex 22, the ICH Q9 (R1) revision, and the convergence of global regulators around lifecycle, risk-based, and knowledge-driven approaches to quality.
For active substance manufacturers, the message is clear: the era of treating validation as optional supplementary guidance is over. For the rest of us, the message is equally important: the quality of our medicines depends on the quality of knowledge throughout the supply chain, and regulators are now ensuring that the structural requirements to generate and maintain that knowledge extend to every link in the chain.
The October 2025 Warning Letter to Apotex Inc. is fascinating not because it reveals anything novel about FDA expectations, but because it exposes the chasm between what we know we should do and what we actually allow to happen on our watch. Evaluate it together with what we are seeing for Complete Response Letter (CRL) data, we can see that companies continue to struggle with the concept of equipment lifecycle management.
This isn’t about a few leaking gloves or deteriorated gaskets. This is about systemic failure in how we conceptualize, resource, and execute equipment management across the entire GMP ecosystem. Let me walk you through what the Apotex letter really tells us, where the FDA is heading next, and why your current equipment qualification program is probably insufficient.
The Apotex Warning Letter: A Case Study in Lifecycle Management Failure
The FDA’s Warning Letter to Apotex (WL: 320-26-12, October 31, 2025) reads like a checklist of every equipment lifecycle management failure I’ve witnessed in two decades of quality oversight. The agency cited 21 CFR 211.67(a) equipment maintenance failures, 21 CFR 211.192 inadequate investigations, and 21 CFR 211.113(b) aseptic processing deficiencies. But these citations barely scratch the surface of what actually went wrong.
The Core Failures: A Pattern of Deferral and Neglect
Between September 2023 and April 2025—18 months—Apotex experienced at least eight critical equipment failures during leak testing. Their personnel responded by retesting until they achieved passing results rather than investigating root causes. Think about that timeline. Eight failures over 18 months means a failure every 2-3 months, each one representing a signal that their equipment was degrading. When investigators finally examined the system, they found over 30 leaking areas. This wasn’t a single failure; this was systemic equipment deterioration that the organization chose to work around rather than address.
The letter documents white particle buildup on manufacturing equipment surfaces, particles along conveyor systems, deteriorated gasket seals, and discolored gloves. Investigators observed a six-millimeter glove breach that was temporarily closed with a cable tie before production continued. They found tape applied to “false covers” as a workaround. These aren’t just housekeeping issues—they’re evidence that Apotex had crossed from proactive maintenance into reactive firefighting, and then into dangerous normalization of deviation.
Most damning: Apotex had purchased upgraded equipment nearly a year before the FDA inspection but continued using the deteriorating equipment that was actively generating particles contaminating their nasal spray products. They had the solution in their possession. They chose not to implement it.
The Investigation Gap: Equipment Failures as Quality System Failures
The FDA hammered Apotex on their failure to investigate, but here’s what’s really happening: equipment failures are quality system failures until proven otherwise. When a leak happens , you don’t just replace whatever component leaked. You ask:
Why did this component fail when others didn’t?
Is this a batch-specific issue or a systemic supplier problem?
How many products did this breach potentially affect?
What does our environmental monitoring data tell us about the timeline of contamination?
Are our maintenance intervals appropriate?
Apotex’s investigators didn’t ask these questions. Their personnel retested until they got passing results—a classic example of “testing into compliance” that I’ve seen destroy quality cultures. The quality unit failed to exercise oversight, and management failed to resource proper root cause analysis. This is what happens when quality becomes a checkbox exercise rather than an operational philosophy.
BLA CRL Trends: The Facility Equipment Crisis Is Accelerating
The Apotex warning letter doesn’t exist in isolation. It’s part of a concerning trend in FDA enforcement that’s becoming impossible to ignore. Facility inspection concerns dominate CRL justifications. Manufacturing and CMC deficiencies account for approximately 44% of all CRLs. For biologics specifically, facility-related issues are even more pronounced.
The Biologics-Specific Challenge
Biologics license applications face unique equipment lifecycle scrutiny. The 2024-2025 CRL data shows multiple biosimilars rejected due to third-party manufacturing facility issues despite clean clinical data. Tab-cel (tabelecleucel) received a CRL citing problems at a contract manufacturing organization—the FDA rejected an otherwise viable therapy because the facility couldn’t demonstrate equipment control.
This should terrify every biotech quality leader. The FDA is telling us: your clinical data is worthless if your equipment lifecycle management is suspect. They’re not wrong. Biologics manufacturing depends on consistent equipment performance in ways small molecule chemistry doesn’t. A 0.2°C deviation in a bioreactor temperature profile, caused by a poorly maintained chiller, can alter glycosylation patterns and change the entire safety profile of your product. The agency knows this, and they’re acting accordingly.
The Top 10 Facility Equipment Deficiencies Driving CRLs
Fire Protection and Hazardous Material Handling Deficiencies (equipment safety systems)
Critical Utility System Failures (WFI loops with dead legs, inadequate sanitization)
Environmental Monitoring System Gaps (manual data recording, lack of 21 CFR Part 11 compliance)
Container Closure and Packaging Validation Issues (missing extractables/leachables data, CCI testing gaps)
Inadequate Cleanroom Classification and Control (ISO 14644 and EU Annex 1 compliance failures)
Lack of Preventive Maintenance and Asset Management (missing calibration records, unclear maintenance responsibilities)
Inadequate Documentation and Change Control (HVAC setpoint changes without impact assessment)
Sustainability and Environmental Controls Overlooked (temperature/humidity excursions affecting product stability)
Notice what’s not on this list? Equipment selection errors. The FDA isn’t seeing companies buy the wrong equipment. They’re seeing companies buy the right equipment and then fail to manage it across its lifecycle. This is a crucial distinction. The problem isn’t capital allocation—it’s operational execution.
FDA’s Shift to “Equipment Lifecycle State of Control”
The FDA has introduced a significant conceptual shift in how they discuss equipment management. The Apotex Warning Letter is part of the agency’s new emphasis on “equipment lifecycle state of control” . This isn’t just semantic gamesmanship. It represents a fundamental understanding that discrete qualification events are not enough and that continuous lifecycle management is long overdue.
Continuous monitoring of equipment performance parameters, not just periodic checks
Predictive maintenance based on performance data, not just manufacturer-recommended intervals
Real-time assessment of equipment degradation signals (particle generation, seal wear, vibration changes)
Integrated change management that treats equipment modifications as potential quality events
Traceable decision-making about when to repair, refurbish, or retire equipment
The FDA is essentially saying: qualification is a snapshot; state of control is a movie. And they want to see the entire film, not just the trailer.
This aligns perfectly with the agency’s broader push toward Quality Management Maturity. As I’ve previously written about QMM, the FDA is moving away from checking compliance boxes and toward evaluating whether organizations have the infrastructure, culture, and competence to manage quality dynamically. Equipment lifecycle management is the perfect test case for this shift because equipment degradation is inevitable, predictable, and measurable. If you can’t manage equipment lifecycle, you can’t manage quality.
Global Regulatory Convergence: WHO, EMA, and PIC/S Perspectives
The FDA isn’t operating in a vacuum. Global regulators are converging on equipment lifecycle management as a critical inspection focus, though their approaches differ in emphasis.
EMA: The Annex 15 Lifecycle Approach
EMA’s process validation guidance explicitly requires IQ, OQ, and PQ for equipment and facilities as part of the validation lifecycle. Unlike FDA’s three-stage process validation model, EMA frames qualification as ongoing throughout the product lifecycle. Their 2023 revision of Annex 15 emphasizes:
Validation Master Plans that include equipment lifecycle considerations
Ongoing Process Verification that incorporates equipment performance data
Risk-based requalification triggered by changes, deviations, or trends
Integration with Product Quality Reviews (PQRs) to assess equipment impact on product quality
The EMA expects you to prove your equipment remains qualified through annual PQRs and continuous data review having been more explicit about a lifecycle approach for years.
PIC/S: The Change Management Imperative
PIC/S PI 054-1 on change management provides crucial guidance on equipment lifecycle triggers. The document explicitly identifies equipment upgrades as changes that require formal assessment, planning, and implementation controls. Critically, PIC/S emphasizes:
Interim controls when equipment issues are identified but not yet remediated
Post-implementation monitoring to ensure changes achieve intended risk reduction
Documentation of rejected changes, especially those related to quality/safety hazard mitigation
The Apotex case is a PIC/S textbook violation: they identified equipment deterioration (hazard), purchased upgraded equipment (change proposal), but failed to implement it with appropriate interim controls or timeline management. The result was continued production with deteriorating equipment—exactly what PIC/S guidance is designed to prevent.
WHO: The Resource-Limited Perspective
WHO’s equipment lifecycle guidance, while focused on medical equipment in low-resource settings, offers surprisingly relevant insights for GMP facilities. Their framework emphasizes:
Planning based on lifecycle cost, not just purchase price
Skill development and training as core lifecycle components
Decommissioning protocols that ensure data integrity and product segregation
The WHO model is refreshingly honest about resource constraints, which applies to many GMP facilities facing budget pressure. Their key insight: proper lifecycle management actually reduces total cost of ownership by 3-10x compared to run-to-failure approaches. This is the business case that quality leaders need to make to CFOs who view maintenance as a cost center.
The Six-System Inspection Model: Where Equipment Lifecycle Fits
FDA’s Six-System Inspection Model—particularly the Facilities and Equipment System—provides the structural framework for understanding equipment lifecycle requirements. As I’ve previously written, this system “ensures that facilities and equipment are suitable for their intended use and maintained properly” with focus on “design, maintenance, cleaning, and calibration.”
The Interconnectedness Problem
Here’s where many organizations fail: they treat the six systems as silos. Equipment lifecycle management bleeds across all of them:
Production System: Equipment performance directly impacts process capability
Laboratory Controls: Analytical equipment lifecycle affects data integrity
Materials System: Equipment changes can affect raw material compatibility
Packaging and Labeling: Equipment modifications require revalidation
Quality System: Equipment deviations trigger CAPA and change control
The Apotex warning letter demonstrates this interconnectedness perfectly. Their equipment failures (Facilities & Equipment) led to container-closure integrity issues (Packaging), which they failed to investigate properly (Quality), resulting in distributed product that was potentially adulterated (Production). The FDA’s response required independent assessments of investigations, CAPA, and change management—three separate systems all impacted by equipment lifecycle failures.
The “State of Control” Assessment Questions
If FDA inspectors show up tomorrow, here’s what they’ll ask about your equipment lifecycle management:
Design Qualification: Do your User Requirements Specifications include lifecycle maintenance requirements? Are you specifying equipment with modular upgrade paths, or are you buying disposable assets?
Change Management: When you purchase upgraded equipment, what triggers its implementation? Is there a formal risk assessment linking equipment deterioration to product quality? Or do you wait for failures?
Preventive Maintenance: Are your PM intervals based on manufacturer recommendations, or on actual performance data? Do you have predictive maintenance programs using vibration analysis, thermal imaging, or particle counting?
Decommissioning: When equipment reaches end-of-life, do you have formal retirement protocols that assess data integrity impact? Or does old equipment sit in corners of the cleanroom “just in case”?
Training: Do your operators understand equipment lifecycle concepts? Can they recognize early degradation signals? Or do they just call maintenance when something breaks?
These aren’t theoretical questions. They’re directly from recent 483 observations and CRL deficiencies.
The Business Case: Why Equipment Lifecycle Management Is Economic Imperative
Let’s be blunt: the pharmaceutical industry has treated equipment as a capital expense to be minimized, not an asset to be optimized. This is catastrophically wrong. The Apotex warning letter shows the true cost of this mindset:
Product recalls: Multiple ophthalmic and oral solutions recalled
Production suspension: Sterile manufacturing halted
Independent assessments: Required third-party evaluation of entire quality system
Reputational damage: Public warning letter, potential import alert
Opportunity cost: Products stuck in regulatory limbo while competitors gain market share
Contrast this with the investment required for proper lifecycle management:
Predictive maintenance systems: $50,000-200,000 for sensors and software
Enhanced training programs: $10,000-30,000 annually
Total: Less than the cost of a single batch recall
The ROI is undeniable. Equipment lifecycle management isn’t a cost center—it’s risk mitigation with quantifiable financial returns.
The CFO Conversation
I’ve had this conversation with CFOs more times than I can count. Here’s what works:
Don’t say: “We need more maintenance budget.”
Say: “Our current equipment lifecycle risk exposure is $X million based on recent CRL trends and warning letters. Investing $Y in lifecycle management reduces that risk by Z% and extends asset utilization by 2-3 years, deferring $W million in capital expenditures.”
Bring data. Show them the Apotex letter. Show them the Tab-cel CRL. Show them the 51 CRLs driven by facility concerns. CFOs understand risk-adjusted returns. Frame equipment lifecycle management as portfolio risk management, not engineering overhead.
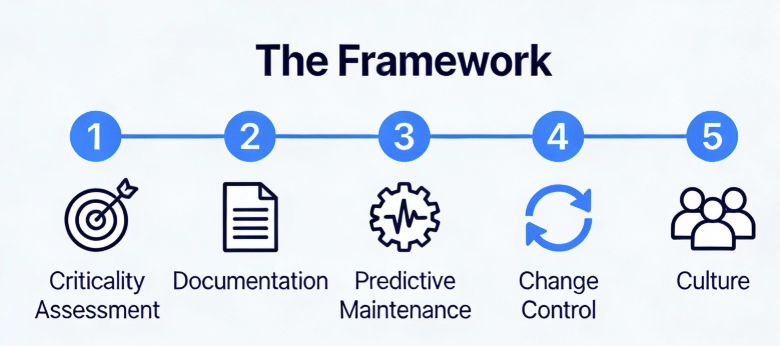
Practical Framework: Building an Equipment Lifecycle Management Program
Enough theory. Here’s the practical framework I’ve implemented across multiple DS facilities, refined through inspections, and validated against regulatory expectations.
Phase 1: Asset Criticality Assessment
Not all equipment deserves equal lifecycle attention. Use a risk-based approach:
Criticality Class A (Direct Impact): Equipment whose failure directly impacts product quality, safety, or efficacy. Bioreactors, purification skids, sterile filling lines, environmental monitoring systems. These require full lifecycle management including continuous monitoring, predictive maintenance, and formal retirement protocols.
Criticality Class B (Indirect Impact): Equipment whose failure impacts GMP environment but not direct product attributes. HVAC units, WFI systems, clean steam generators. These require enhanced lifecycle management with robust PM programs and performance trending.
Criticality Class C (No Impact): Non-GMP equipment. Standard maintenance practices apply.
Phase 2: Lifecycle Documentation Architecture
Create a master equipment lifecycle file for each Class A and B asset containing:
User Requirements Specification with lifecycle maintenance requirements
Design Qualification including maintainability and upgrade path assessment
Commissioning Protocol (IQ/OQ/PQ) with acceptance criteria that remain valid throughout lifecycle
Maintenance Master Plan defining PM intervals, spare parts strategy, and predictive monitoring
Performance Trending Protocol specifying parameters to monitor, alert limits, and review frequency
Change Management History documenting all modifications with impact assessment
Retirement Protocol defining end-of-life triggers and data migration requirements
As I’ve written about in my posts on GMP-critical systems, documentation must be living documents that evolve with the asset, not static files that gather dust after qualification.
Phase 3: Predictive Maintenance Implementation
Move beyond manufacturer-recommended intervals to condition-based maintenance:
Vibration analysis for rotating equipment (pumps, agitators)
Thermal imaging for electrical systems and heat transfer equipment
Particle counting for cleanroom equipment and filtration systems
Pressure decay testing for sterile barrier systems
Oil analysis for hydraulic and lubrication systems
The goal is to detect degradation 6-12 months before failure, allowing planned intervention during scheduled shutdowns.
Phase 4: Integrated Change Control
Equipment changes must flow through formal change control with:
Technical assessment by engineering and quality
Risk evaluation using FMEA or similar tools
Regulatory assessment for potential prior approval requirements
Implementation planning with interim controls if needed
Post-implementation review to verify effectiveness
The Apotex case shows what happens when you skip the interim controls. They identified the need for upgraded equipment (change) but failed to implement the necessary bridge measures to ensure product quality while waiting for that equipment to come online. They allowed the “future state” (new equipment) to become an excuse for neglecting the “current state” (deteriorating equipment).
This is a failure of Change Management Logic. In a robust quality system, the moment you identify that equipment requires replacement due to performance degradation, you have acknowledged a risk. If you cannot replace it immediately—due to capital cycles, lead times, or qualification timelines—you must implement interim controls to mitigate that risk.
For Apotex, those interim controls should have been:
Reduced run durations to minimize stress on failing seals.
Shortened maintenance intervals (replacing gaskets every batch instead of every campaign).
Enhanced environmental monitoring focused specifically on the degrade zones.
Instead, they did nothing. They continued business as usual, likely comforting themselves with the purchase order for the new machine. The FDA’s response was unambiguous: A purchase order is not a CAPA. Until the new equipment is qualified and operational, your legacy equipment must remain in a state of control, or production must stop. There is no regulatory “grace period” for deteriorating assets.
Phase 5: The Cultural Shift—From “Repair” to “Reliability”
The final and most difficult phase of this framework is cultural. You cannot write a SOP for this; you have to lead it.
Most organizations operate on a “Break-Fix” mentality:
Equipment runs until it alarms or fails.
Maintenance fixes it.
Quality investigates (or papers over) the failure.
Production resumes.
The FDA’s “Lifecycle State of Control” demands a “Predict-Prevent” mentality:
Equipment is monitored for degradation signals (vibration, heat, particle counts).
Maintenance intervenes before failure limits are reached.
Quality reviews trends to confirm the intervention was effective.
Production continues uninterrupted.
To achieve this, you need to change how you incentivize your teams. Stop rewarding “heroic” fixes at 2 AM. Start rewarding the boring, invisible work of preventing the failure in the first place. As I’ve written before regarding Quality Management Maturity (QMM), mature quality systems are quiet systems. Chaos is not a sign of hard work; it’s a sign of lost control.
Conclusion: The Choice Before Us
The warning letter to Apotex Inc. and the rising tide of facility-related CRLs are not random compliance noise. They are signal flares. The regulatory expectations for equipment management have fundamentally shifted from static qualification (Is it validated?) to dynamic lifecycle management (Is it in a state of control right now?).
The FDA, EMA, and PIC/S have converged on a single truth: You cannot assure product quality if you cannot guarantee equipment performance.
We are at an inflection point. The industry’s aging infrastructure, combined with the increasing complexity of biologic processes and the unforgiving nature of residue control, has created a perfect storm. We can no longer treat equipment maintenance as a lower-tier support function. It is a core GMP activity, equal in criticality to batch record review or sterility testing.
As Quality Leaders, we have two choices:
The Apotex Path: Treat equipment upgrades as capital headaches to be deferred. Ignore the “minor” leaks and “insignificant” residues. Let the maintenance team bandage the wounds while we focus on “strategic” initiatives. This path leads to 483s, warning letters, CRLs, and the excruciating public failure of seeing your facility’s name in an FDA press release.
The Lifecycle Path: Embrace the complexity. Resource the predictive maintenance programs. Validate the residue removal. Treat every equipment change as a potential risk to patient safety. Build a system where equipment reliability is the foundation of your quality strategy, not an afterthought.
The second path is expensive. It is technically demanding. It requires fighting for budget dollars that don’t have immediate ROI. But it allows you to sleep at night, knowing that when—not if—the FDA investigator asks to see your equipment maintenance history, you won’t have to explain why you used a cable tie to fix a glove port.
You’ll simply show them the data that proves you’re in control.
The current state of periodic reviews in most pharmaceutical organizations is, to put it charitably, underwhelming. Annual checkbox exercises where teams dutifully document that “the system continues to operate as intended” while avoiding any meaningful analysis of actual system performance, emerging risks, or validation gaps. I’ve seen periodic reviews that consist of little more than confirming the system is still running and updating a few SOPs. This approach might have survived regulatory scrutiny in simpler times, but Section 14 of the draft Annex 11 obliterates this compliance theater and replaces it with rigorous, systematic, and genuinely valuable system intelligence.
The new requirements in the draft Annex 11 Section 14: Periodic Review don’t just raise the bar—they relocate it to a different universe entirely. Where the 2011 version suggested that systems “should be periodically evaluated,” the draft mandates comprehensive, structured, and consequential reviews that must demonstrate continued fitness for purpose and validated state. Organizations that have treated periodic reviews as administrative burdens are about to discover they’re actually the foundation of sustainable digital compliance.
The Philosophical Revolution: From Static Assessment to Dynamic Intelligence
The fundamental transformation in Section 14 reflects a shift from viewing computerized systems as static assets that require occasional maintenance to understanding them as dynamic, evolving components of complex pharmaceutical operations that require continuous intelligence and adaptive management. This philosophical change acknowledges several uncomfortable realities that the industry has long ignored.
First, modern computerized systems never truly remain static. Cloud platforms undergo continuous updates. SaaS providers deploy new features regularly. Integration points evolve. User behaviors change. Regulatory requirements shift. Security threats emerge. Business processes adapt. The fiction that a system can be validated once and then monitored through cursory annual reviews has become untenable in environments where change is the only constant.
Second, the interconnected nature of modern pharmaceutical operations means that changes in one system ripple through entire operational ecosystems in ways that traditional periodic reviews rarely capture. A seemingly minor update to a laboratory information management system might affect data flows to quality management systems, which in turn impact batch release processes, which ultimately influence regulatory reporting. Section 14 acknowledges this complexity by requiring assessment of combined effects across multiple systems and changes.
Third, the rise of data integrity as a central regulatory concern means that periodic reviews must evolve beyond functional assessment to include sophisticated analysis of data handling, protection, and preservation throughout increasingly complex digital environments. This requires capabilities that most current periodic review processes simply don’t possess.
Section 14.1 establishes the foundational requirement that “computerised systems should be subject to periodic review to verify that they remain fit for intended use and in a validated state.” This language moves beyond the permissive “should be evaluated” of the current regulation to establish periodic review as a mandatory demonstration of continued compliance rather than optional best practice.
The requirement that reviews verify systems remain “fit for intended use” introduces a performance-based standard that goes beyond technical functionality to encompass business effectiveness, regulatory adequacy, and operational sustainability. Systems might continue to function technically while becoming inadequate for their intended purposes due to changing regulatory requirements, evolving business processes, or emerging security threats.
Similarly, the requirement to verify systems remain “in a validated state” acknowledges that validation is not a permanent condition but a dynamic state that can be compromised by changes, incidents, or evolving understanding of system risks and requirements. This creates an ongoing burden of proof that validation status is actively maintained rather than passively assumed.
The Twelve Pillars of Comprehensive System Intelligence
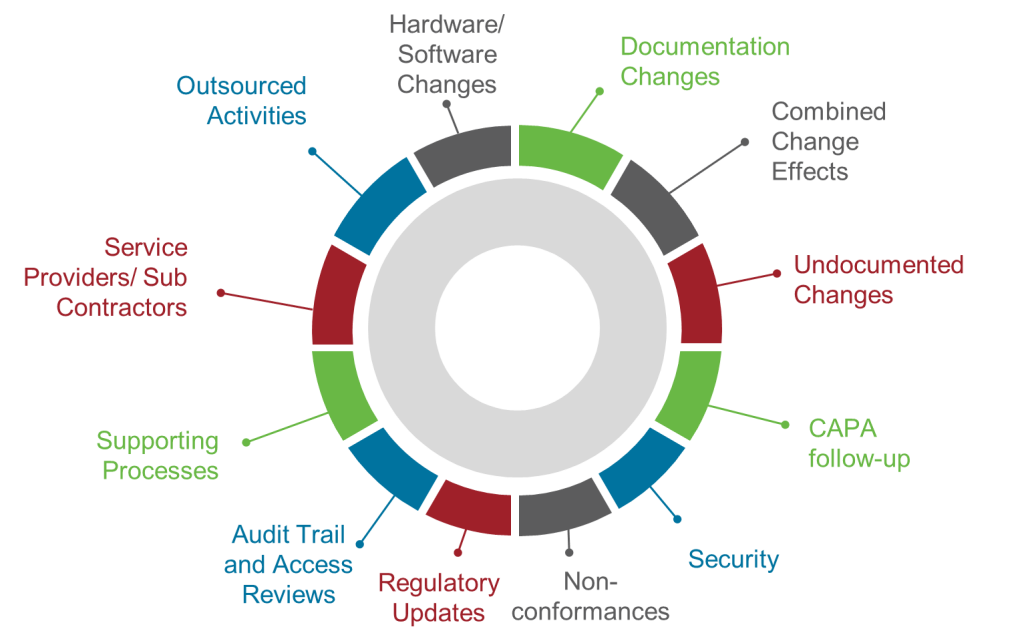
Section 14.2 represents perhaps the most significant transformation in the entire draft regulation by establishing twelve specific areas that must be addressed in every periodic review. This prescriptive approach eliminates the ambiguity that has allowed organizations to conduct superficial reviews while claiming regulatory compliance.
The requirement to assess “changes to hardware and software since the last review” acknowledges that modern systems undergo continuous modification through patches, updates, configuration changes, and infrastructure modifications. Organizations must maintain comprehensive change logs and assess the cumulative impact of all modifications on system validation status, not just changes that trigger formal change control processes.
“Changes to documentation since the last review” recognizes that documentation drift—where procedures, specifications, and validation documents become disconnected from actual system operation—represents a significant compliance risk. Reviews must identify and remediate documentation gaps that could compromise operational consistency or regulatory defensibility.
The requirement to evaluate “combined effect of multiple changes” addresses one of the most significant blind spots in traditional change management approaches. Individual changes might be assessed and approved through formal change control processes, but their collective impact on system performance, validation status, and operational risk often goes unanalyzed. Section 14 requires systematic assessment of how multiple changes interact and whether their combined effect necessitates revalidation activities.
“Undocumented or not properly controlled changes” targets one of the most persistent compliance failures in pharmaceutical operations. Despite robust change control procedures, systems inevitably undergo modifications that bypass formal processes. These might include emergency fixes, vendor-initiated updates, configuration drift, or unauthorized user modifications. Periodic reviews must actively hunt for these changes and assess their impact on validation status.
The focus on “follow-up on CAPAs” integrates corrective and preventive actions into systematic review processes, ensuring that identified issues receive appropriate attention and that corrective measures prove effective over time. This creates accountability for CAPA effectiveness that extends beyond initial implementation to long-term performance.
Requirements to assess “security incidents and other incidents” acknowledge that system security and reliability directly impact validation status and regulatory compliance. Organizations must evaluate whether incidents indicate systematic vulnerabilities that require design changes, process improvements, or enhanced controls.
“Non-conformities” assessment requires systematic analysis of deviations, exceptions, and other performance failures to identify patterns that might indicate underlying system inadequacies or operational deficiencies requiring corrective action.
The mandate to review “applicable regulatory updates” ensures that systems remain compliant with evolving regulatory requirements rather than becoming progressively non-compliant as guidance documents are revised, new regulations are promulgated, or inspection practices evolve.
“Audit trail reviews and access reviews” elevates these critical data integrity activities from routine operational tasks to strategic compliance assessments that must be evaluated for effectiveness, completeness, and adequacy as part of systematic periodic review.
Requirements for “supporting processes” assessment acknowledge that computerized systems operate within broader procedural and organizational contexts that directly impact their effectiveness and compliance. Changes to training programs, quality systems, or operational procedures might affect system validation status even when the systems themselves remain unchanged.
The focus on “service providers and subcontractors” reflects the reality that modern pharmaceutical operations depend heavily on external providers whose performance directly impacts system compliance and effectiveness. As I discussed in my analysis of supplier management requirements, organizations cannot outsource accountability for system compliance even when they outsource system operation.
Finally, the requirement to assess “outsourced activities” ensures that organizations maintain oversight of all system-related functions regardless of where they are performed or by whom, acknowledging that regulatory accountability cannot be transferred to external providers.
Review Area
Primary Objective
Key Focus Areas
Hardware/Software Changes
Track and assess all system modifications
Change logs, patch management, infrastructure updates, version control
Documentation Changes
Ensure documentation accuracy and currency
Document version control, procedure updates, specification accuracy, training materials
Combined Change Effects
Evaluate cumulative change impact
Cumulative change impact, system interactions, validation status implications
Undocumented Changes
Identify and control unmanaged changes
Change detection, impact assessment, process gap identification, control improvements
CAPA Follow-up
Verify corrective action effectiveness
CAPA effectiveness, root cause resolution, preventive measure adequacy, trend analysis
Section 14.3 establishes a risk-based approach to periodic review frequency that moves beyond arbitrary annual schedules to systematic assessment of when reviews are needed based on “the system’s potential impact on product quality, patient safety and data integrity.” This approach aligns with broader pharmaceutical industry trends toward risk-based regulatory strategies while acknowledging that different systems require different levels of ongoing attention.
The risk-based approach requires organizations to develop sophisticated risk assessment capabilities that can evaluate system criticality across multiple dimensions simultaneously. A laboratory information management system might have high impact on product quality and data integrity but lower direct impact on patient safety, suggesting different review priorities and frequencies compared to a clinical trial management system or manufacturing execution system.
Organizations must document their risk-based frequency decisions and be prepared to defend them during regulatory inspections. This creates pressure for systematic, scientifically defensible risk assessment methodologies rather than intuitive or political decision-making about resource allocation.
The risk-based approach also requires dynamic adjustment as system characteristics, operational contexts, or regulatory environments change. A system that initially warranted annual reviews might require more frequent attention if it experiences reliability problems, undergoes significant changes, or becomes subject to enhanced regulatory scrutiny.
FREQUENCY: Semi-annually DEPTH: Focused+ (critical areas with simplified analysis) RESOURCES: Quality lead + SME support EXAMPLES: Critical Parameter Monitoring, Sterility Testing Systems, Release Testing Platforms FOCUS: Performance validation, data integrity verification, regulatory compliance
Medium Criticality Systems
High Complexity
Medium Complexity
Low Complexity
FREQUENCY: Semi-annually DEPTH: Standard (structured assessment) RESOURCES: Cross-functional team EXAMPLES: Enterprise Resource Planning, Advanced Analytics Platforms, Multi-system Integrations FOCUS: System integration assessment, change impact analysis, performance optimization
FREQUENCY: Annually DEPTH: Standard (balanced assessment) RESOURCES: Small team EXAMPLES: Training Management Systems, Calibration Management, Standard Laboratory Instruments FOCUS: Operational effectiveness, compliance maintenance, trend monitoring
FREQUENCY: Annually DEPTH: Focused (key areas only) RESOURCES: Individual reviewer + occasional SME EXAMPLES: Simple Data Loggers, Basic Trending Tools, Standard Office Applications FOCUS: Basic functionality verification, minimal compliance checking
Documentation and Analysis: From Checklists to Intelligence Reports
Section 14.4 transforms documentation requirements from simple record-keeping to sophisticated analytical reporting that must “document the review, analyze the findings and identify consequences, and be implemented to prevent any reoccurrence.” This language establishes periodic reviews as analytical exercises that generate actionable intelligence rather than administrative exercises that produce compliance artifacts.
The requirement to “analyze the findings” means that reviews must move beyond simple observation to systematic evaluation of what findings mean for system performance, validation status, and operational risk. This analysis must be documented in ways that demonstrate analytical rigor and support decision-making about system improvements, validation activities, or operational changes.
“Identify consequences” requires forward-looking assessment of how identified issues might affect future system performance, compliance status, or operational effectiveness. This prospective analysis helps organizations prioritize corrective actions and allocate resources effectively while demonstrating proactive risk management.
The mandate to implement measures “to prevent any reoccurrence” establishes accountability for corrective action effectiveness that extends beyond traditional CAPA processes to encompass systematic prevention of issue recurrence through design changes, process improvements, or enhanced controls.
These documentation requirements create significant implications for periodic review team composition, analytical capabilities, and reporting systems. Organizations need teams with sufficient technical and regulatory expertise to conduct meaningful analysis and systems capable of supporting sophisticated analytical reporting.
Integration with Quality Management Systems: The Nervous System Approach
Perhaps the most transformative aspect of Section 14 is its integration with broader quality management system activities. Rather than treating periodic reviews as isolated compliance exercises, the new requirements position them as central intelligence-gathering activities that inform broader organizational decision-making about system management, validation strategies, and operational improvements.
This integration means that periodic review findings must flow systematically into change control processes, CAPA systems, validation planning, supplier management activities, and regulatory reporting. Organizations can no longer conduct periodic reviews in isolation from other quality management activities—they must demonstrate that review findings drive appropriate organizational responses across all relevant functional areas.
The integration also means that periodic review schedules must align with other quality management activities including management reviews, internal audits, supplier assessments, and regulatory inspections. Organizations need coordinated calendars that ensure periodic review findings are available to inform these other activities while avoiding duplicative or conflicting assessment activities.
Technology Requirements: Beyond Spreadsheets and SharePoint
The analytical and documentation requirements of Section 14 push most current periodic review approaches beyond their technological limits. Organizations relying on spreadsheets, email coordination, and SharePoint collaboration will find these tools inadequate for systematic multi-system analysis, trend identification, and integrated reporting required by the new regulation.
Effective implementation requires investment in systems capable of aggregating data from multiple sources, supporting collaborative analysis, maintaining traceability throughout review processes, and generating reports suitable for regulatory presentation. These might include dedicated GRC (Governance, Risk, and Compliance) platforms, advanced quality management systems, or integrated validation lifecycle management tools.
The technology requirements extend to underlying system monitoring and data collection capabilities. Organizations need systems that can automatically collect performance data, track changes, monitor security events, and maintain audit trails suitable for periodic review analysis. Manual data collection approaches become impractical when reviews must assess twelve specific areas across multiple systems on risk-based schedules.
Resource and Competency Implications: Building Analytical Capabilities
Section 14’s requirements create significant implications for organizational capabilities and resource allocation. Traditional periodic review approaches that rely on part-time involvement from operational personnel become inadequate for systematic multi-system analysis requiring technical, regulatory, and analytical expertise.
Organizations need dedicated periodic review capabilities that might include full-time coordinators, subject matter expert networks, analytical tool specialists, and management reporting coordinators. These teams need training in analytical methodologies, regulatory requirements, technical system assessment, and organizational change management.
The competency requirements extend beyond technical skills to include systems thinking capabilities that can assess interactions between systems, processes, and organizational functions. Team members need understanding of how changes in one area might affect other areas and how to design analytical approaches that capture these complex relationships.
Comparison with Current Practices: The Gap Analysis
The transformation from current periodic review practices to Section 14 requirements represents one of the largest compliance gaps in the entire draft Annex 11. Most organizations conduct periodic reviews that bear little resemblance to the comprehensive analytical exercises envisioned by the new regulation.
Current practices typically focus on confirming that systems continue to operate and that documentation remains current. Section 14 requires systematic analysis of system performance, validation status, risk evolution, and operational effectiveness across twelve specific areas with documented analytical findings and corrective action implementation.
Current practices often treat periodic reviews as isolated compliance exercises with minimal integration into broader quality management activities. Section 14 requires tight integration with change management, CAPA processes, supplier management, and regulatory reporting.
Current practices frequently rely on annual schedules regardless of system characteristics or operational context. Section 14 requires risk-based frequency determination with documented justification and dynamic adjustment based on changing circumstances.
Current practices typically produce simple summary reports with minimal analytical content. Section 14 requires sophisticated analytical reporting that identifies trends, assesses consequences, and drives organizational decision-making.
GAMP 5 Alignment and Evolution
GAMP 5’s approach to periodic review provides a foundation for implementing Section 14 requirements but requires significant enhancement to meet the new regulatory standards. GAMP 5 recommends periodic review as best practice for maintaining validation throughout system lifecycles and provides guidance on risk-based approaches to frequency determination and scope definition.
However, GAMP 5’s recommendations lack the prescriptive detail and mandatory requirements of Section 14. While GAMP 5 suggests comprehensive system review including technical, procedural, and performance aspects, it doesn’t mandate the twelve specific areas required by Section 14. GAMP 5 recommends formal documentation and analytical reporting but doesn’t establish the specific analytical and consequence identification requirements of the new regulation.
The GAMP 5 emphasis on integration with overall quality management systems aligns well with Section 14 requirements, but organizations implementing GAMP 5 guidance will need to enhance their approaches to meet the more stringent requirements of the draft regulation.
Organizations that have successfully implemented GAMP 5 periodic review recommendations will have significant advantages in transitioning to Section 14 compliance, but they should not assume their current approaches are adequate without careful gap analysis and enhancement planning.
Implementation Strategy: From Current State to Section 14 Compliance
Organizations planning Section 14 implementation must begin with comprehensive assessment of current periodic review practices against the new requirements. This gap analysis should address all twelve mandatory review areas, analytical capabilities, documentation standards, integration requirements, and resource needs.
The implementation strategy should prioritize development of analytical capabilities and supporting technology infrastructure. Organizations need systems capable of collecting, analyzing, and reporting the complex multi-system data required for Section 14 compliance. This typically requires investment in new technology platforms and development of new analytical competencies.
Change management becomes critical for successful implementation because Section 14 requirements represent fundamental changes in how organizations approach system oversight. Stakeholders accustomed to routine annual reviews must be prepared for analytical exercises that might identify significant system issues requiring substantial corrective actions.
Training and competency development programs must address the enhanced analytical and technical requirements of Section 14 while ensuring that review teams understand their integration responsibilities within broader quality management systems.
Organizations should plan phased implementation approaches that begin with pilot programs on selected systems before expanding to full organizational implementation. This allows refinement of procedures, technology, and competencies before deploying across entire system portfolios.
The Final Review Requirement: Planning for System Retirement
Section 14.5 introduces a completely new concept: “A final review should be performed when a computerised system is taken out of use.” This requirement acknowledges that system retirement represents a critical compliance activity that requires systematic assessment and documentation.
The final review requirement addresses several compliance risks that traditional system retirement approaches often ignore. Organizations must ensure that all data preservation requirements are met, that dependent systems continue to operate appropriately, that security risks are properly addressed, and that regulatory reporting obligations are fulfilled.
Final reviews must assess the impact of system retirement on overall operational capabilities and validation status of remaining systems. This requires understanding of system interdependencies that many organizations lack and systematic assessment of how retirement might affect continuing operations.
The final review requirement also creates documentation obligations that extend system compliance responsibilities through the retirement process. Organizations must maintain evidence that system retirement was properly planned, executed, and documented according to regulatory requirements.
Regulatory Implications and Inspection Readiness
Section 14 requirements fundamentally change regulatory inspection dynamics by establishing periodic reviews as primary evidence of continued system compliance and organizational commitment to maintaining validation throughout system lifecycles. Inspectors will expect to see comprehensive analytical reports with documented findings, systematic corrective actions, and clear integration with broader quality management activities.
The twelve mandatory review areas provide inspectors with specific criteria for evaluating periodic review adequacy. Organizations that cannot demonstrate systematic assessment of all required areas will face immediate compliance challenges regardless of overall system performance.
The analytical and documentation requirements create expectations for sophisticated compliance artifacts that demonstrate organizational competency in system oversight and continuous improvement. Superficial reviews with minimal analytical content will be viewed as inadequate regardless of compliance with technical system requirements.
The integration requirements mean that inspectors will evaluate periodic reviews within the context of broader quality management system effectiveness. Disconnected or isolated periodic reviews will be viewed as evidence of inadequate quality system integration and organizational commitment to continuous improvement.
Strategic Implications: Periodic Review as Competitive Advantage
Organizations that successfully implement Section 14 requirements will gain significant competitive advantages through enhanced system intelligence, proactive risk management, and superior operational effectiveness. Comprehensive periodic reviews provide organizational insights that enable better system selection, more effective resource allocation, and proactive identification of improvement opportunities.
The analytical capabilities required for Section 14 compliance support broader organizational decision-making about technology investments, process improvements, and operational strategies. Organizations that develop these capabilities for periodic review purposes can leverage them for strategic planning, performance management, and continuous improvement initiatives.
The integration requirements create opportunities for enhanced organizational learning and knowledge management. Systematic analysis of system performance, validation status, and operational effectiveness generates insights that can improve future system selection, implementation, and management decisions.
Organizations that excel at Section 14 implementation will build reputations for regulatory sophistication and operational excellence that provide advantages in regulatory relationships, business partnerships, and talent acquisition.
The Future of Pharmaceutical System Intelligence
Section 14 represents the evolution of pharmaceutical compliance toward sophisticated organizational intelligence systems that provide real-time insight into system performance, validation status, and operational effectiveness. This evolution acknowledges that modern pharmaceutical operations require continuous monitoring and adaptive management rather than periodic assessment and reactive correction.
The transformation from compliance theater to genuine system intelligence creates opportunities for pharmaceutical organizations to leverage their compliance investments for strategic advantage while ensuring robust regulatory compliance. Organizations that embrace this transformation will build sustainable competitive advantages through superior system management and operational effectiveness.
However, the transformation also creates significant implementation challenges that will test organizational commitment to compliance excellence. Organizations that attempt to meet Section 14 requirements through incremental enhancement of current practices will likely fail to achieve adequate compliance or realize strategic benefits.
Success requires fundamental reimagining of periodic review as organizational intelligence activity that provides strategic value while ensuring regulatory compliance. This requires investment in technology, competencies, and processes that extend well beyond traditional compliance requirements but provide returns through enhanced operational effectiveness and strategic insight.
Summary Comparison: The New Landscape of Periodic Review
Aspect
Draft Annex 11 Section 14 (2025)
Current Annex 11 (2011)
GAMP 5 Recommendations
Regulatory Mandate
Mandatory periodic reviews to verify system remains “fit for intended use” and “in validated state”
Systems “should be periodically evaluated” – less prescriptive mandate
Strongly recommended as best practice for maintaining validation throughout lifecycle
Scope of Review
12 specific areas mandated including changes, supporting processes, regulatory updates, security incidents
General areas listed: functionality, deviation records, incidents, problems, upgrade history, performance, reliability, security
Comprehensive system review including technical, procedural, and performance aspects
Risk-Based Approach
Frequency based on risk assessment of system impact on product quality, patient safety, data integrity
Risk-based approach implied but not explicitly required
Core principle – review depth and frequency based on system criticality and risk
Documentation Requirements
Reviews must be documented, findings analyzed, consequences identified, prevention measures implemented
Implicit documentation requirement but not explicitly detailed
Formal documentation recommended with structured reporting
Integration with Quality System
Integrated with audits, inspections, CAPA, incident management, security assessments
Limited integration requirements specified
Integrated with overall quality management system and change control
Follow-up Actions
Findings must be analyzed to identify consequences and prevent recurrence
No specific follow-up action requirements
Action plans for identified issues with tracking to closure
Final System Review
Final review mandated when system taken out of use
No final review requirement specified
Retirement planning and data preservation activities
The transformation represented by Section 14 marks the end of periodic review as administrative burden and its emergence as strategic organizational capability. Organizations that recognize and embrace this transformation will build sustainable competitive advantages while ensuring robust regulatory compliance. Those that resist will find themselves increasingly disadvantaged in regulatory relationships and operational effectiveness as the pharmaceutical industry evolves toward more sophisticated digital compliance approaches.
Annex 11 Section 14 Integration: Computerized System Intelligence as the Foundation of CPV Excellence
The sophisticated framework for Continuous Process Verification (CPV) methodology and tool selection outlined in this post intersects directly with the revolutionary requirements of Draft Annex 11 Section 14 on periodic review. While CPV focuses on maintaining process validation through statistical monitoring and adaptive control, Section 14 ensures that the computerized systems underlying CPV programs remain in validated states and continue to generate trustworthy data throughout their operational lifecycles.
This intersection represents a critical compliance nexus where process validation meets system validation, creating dependencies that pharmaceutical organizations must understand and manage systematically. The failure to maintain computerized systems in validated states directly undermines CPV program integrity, while inadequate CPV data collection and analysis capabilities compromise the analytical rigor that Section 14 demands.
The Interdependence of System Validation and Process Validation
Modern CPV programs depend entirely on computerized systems for data collection, statistical analysis, trend detection, and regulatory reporting. Manufacturing Execution Systems (MES) capture Critical Process Parameters (CPPs) in real-time. Laboratory Information Management Systems (LIMS) manage Critical Quality Attribute (CQA) testing data. Statistical process control platforms perform the normality testing, capability analysis, and control chart generation that drive CPV decision-making. Enterprise quality management systems integrate CPV findings with broader quality management activities including CAPA, change control, and regulatory reporting.
Section 14’s requirement that computerized systems remain “fit for intended use and in a validated state” directly impacts CPV program effectiveness and regulatory defensibility. A manufacturing execution system that undergoes undocumented configuration changes might continue to collect process data while compromising data integrity in ways that invalidate statistical analysis. A LIMS system with inadequate change control might introduce calculation errors that render capability analyses meaningless. Statistical software with unvalidated updates might generate control charts based on flawed algorithms.
The twelve pillars of Section 14 periodic review map directly onto CPV program dependencies. Hardware and software changes affect data collection accuracy and statistical calculation reliability. Documentation changes impact procedural consistency and analytical methodology validity. Combined effects of multiple changes create cumulative risks to data integrity that traditional CPV monitoring might not detect. Undocumented changes represent blind spots where system degradation occurs without CPV program awareness.
Risk-Based Integration: Aligning System Criticality with Process Impact
The risk-based approach fundamental to both CPV methodology and Section 14 periodic review creates opportunities for integrated assessment that optimizes resource allocation while ensuring comprehensive coverage. Systems supporting high-impact CPV parameters require more frequent and rigorous periodic review than those managing low-risk process monitoring.
Consider an example of a high-capability parameter with data clustered near LOQ requiring threshold-based alerts rather than traditional control charts. The computerized systems supporting this simplified monitoring approach—perhaps basic trending software with binary alarm capabilities—represent lower validation risk than sophisticated statistical process control platforms. Section 14’s risk-based frequency determination should reflect this reduced complexity, potentially extending review cycles while maintaining adequate oversight.
Conversely, systems supporting critical CPV parameters with complex statistical requirements—such as multivariate analysis platforms monitoring bioprocess parameters—warrant intensive periodic review given their direct impact on patient safety and product quality. These systems require comprehensive assessment of all twelve pillars with particular attention to change management, analytical method validation, and performance monitoring.
The integration extends to tool selection methodologies outlined in the CPV framework. Just as process parameters require different statistical tools based on data characteristics and risk profiles, the computerized systems supporting these tools require different validation and periodic review approaches. A system supporting simple attribute-based monitoring requires different periodic review depth than one performing sophisticated multivariate statistical analysis.
Data Integrity Convergence: CPV Analytics and System Audit Trails
Section 14’s emphasis on audit trail reviews and access reviews creates direct synergies with CPV data integrity requirements. The sophisticated statistical analyses required for effective CPV—including normality testing, capability analysis, and trend detection—depend on complete, accurate, and unaltered data throughout collection, storage, and analysis processes.
The framework’s discussion of decoupling analytical variability from process signals requires systems capable of maintaining separate data streams with independent validation and audit trail management. Section 14’s requirement to assess audit trail review effectiveness directly supports this CPV capability by ensuring that system-generated data remains traceable and trustworthy throughout complex analytical workflows.
Consider the example where threshold-based alerts replaced control charts for parameters near LOQ. This transition requires system modifications to implement binary logic, configure alert thresholds, and generate appropriate notifications. Section 14’s focus on combined effects of multiple changes ensures that such CPV-driven system modifications receive appropriate validation attention while the audit trail requirements ensure that the transition maintains data integrity throughout implementation.
The integration becomes particularly important for organizations implementing AI-enhanced CPV tools or advanced analytics platforms. These systems require sophisticated audit trail capabilities to maintain transparency in algorithmic decision-making while Section 14’s periodic review requirements ensure that AI model updates, training data changes, and algorithmic modifications receive appropriate validation oversight.
Living Risk Assessments: Dynamic Integration of System and Process Intelligence
The framework’s emphasis on living risk assessments that integrate ongoing data with periodic review cycles aligns perfectly with Section 14’s lifecycle approach to system validation. CPV programs generate continuous intelligence about process performance, parameter behavior, and statistical tool effectiveness that directly informs system validation decisions.
Process capability changes detected through CPV monitoring might indicate system performance degradation requiring investigation through Section 14 periodic review. Statistical tool effectiveness assessments conducted as part of CPV methodology might reveal system limitations requiring configuration changes or software updates. Risk profile evolution identified through living risk assessments might necessitate changes to Section 14 periodic review frequency or scope.
This dynamic integration creates feedback loops where CPV findings drive system validation decisions while system validation ensures CPV data integrity. Organizations must establish governance structures that facilitate information flow between CPV teams and system validation functions while maintaining appropriate independence in decision-making processes.
Implementation Framework: Integrating Section 14 with CPV Excellence
Organizations implementing both sophisticated CPV programs and Section 14 compliance should develop integrated governance frameworks that leverage synergies while avoiding duplication or conflicts. This requires coordinated planning that aligns system validation cycles with process validation activities while ensuring both programs receive adequate resources and management attention.
The implementation should begin with comprehensive mapping of system dependencies across CPV programs, identifying which computerized systems support which CPV parameters and analytical methods. This mapping drives risk-based prioritization of Section 14 periodic review activities while ensuring that high-impact CPV systems receive appropriate validation attention.
System validation planning should incorporate CPV methodology requirements including statistical software validation, data integrity controls, and analytical method computerization. CPV tool selection decisions should consider system validation implications including ongoing maintenance requirements, change control complexity, and periodic review resource needs.
Training programs should address the intersection of system validation and process validation requirements, ensuring that personnel understand both CPV statistical methodologies and computerized system compliance obligations. Cross-functional teams should include both process validation experts and system validation specialists to ensure decisions consider both perspectives.
Strategic Advantage Through Integration
Organizations that successfully integrate Section 14 system intelligence with CPV process intelligence will gain significant competitive advantages through enhanced decision-making capabilities, reduced compliance costs, and superior operational effectiveness. The combination creates comprehensive understanding of both process and system performance that enables proactive identification of risks and opportunities.
Integrated programs reduce resource requirements through coordinated planning and shared analytical capabilities while improving decision quality through comprehensive risk assessment and performance monitoring. Organizations can leverage system validation investments to enhance CPV capabilities while using CPV insights to optimize system validation resource allocation.
The integration also creates opportunities for enhanced regulatory relationships through demonstration of sophisticated compliance capabilities and proactive risk management. Regulatory agencies increasingly expect pharmaceutical organizations to leverage digital technologies for enhanced quality management, and the integration of Section 14 with CPV methodology demonstrates commitment to digital excellence and continuous improvement.
This integration represents the future of pharmaceutical quality management where system validation and process validation converge to create comprehensive intelligence systems that ensure product quality, patient safety, and regulatory compliance through sophisticated, risk-based, and continuously adaptive approaches. Organizations that master this integration will define industry best practices while building sustainable competitive advantages through operational excellence and regulatory sophistication.
Hopefully, you’ve been following my journey through the ever-changing world of validation. In that case, you’ll recognize that our field is undergoing transformation under the dual drivers of digital transformation and shifting regulatory expectations. Halfway through 2025, we have another annual report from Kneat, and it is clear that while some of those core challenges remain, companies are reporting that new priorities are emerging—driven by the rapid pace of digital adoption and evolving compliance landscapes.
Audit Readiness Overtakes Compliance Burden as Top Challenge
The 2025 validation landscape reveals a striking reversal: audit readiness has dethroned compliance burden as the industry’s primary concern , marking a fundamental shift in how organizations prioritize regulatory preparedness. While compliance burden dominated in 2024—a reflection of teams grappling with evolving standards during active projects—this year’s data signals a maturation of validation programs. As organizations transition from project execution to operational stewardship, the scramble to pass audits has given way to the imperative to sustain readiness.
Why the Shift Matters
The surge in audit readiness aligns with broader quality challenges outlined in The Challenges Ahead for Quality (2023) , where data integrity and operational resilience emerged as systemic priorities.
Table: Top Validation Challenges (2022–2025)
Rank
2022
2023
2024
2025
1
Human resources
Human resources
Compliance burden
Audit readiness
2
Efficiency
Efficiency
Audit readiness
Compliance burden
3
Technological gaps
Technological gaps
Data integrity
Data integrity
This reversal mirrors a lifecycle progression. During active validation projects, teams focus on navigating procedural requirements (compliance burden). Once operational, the emphasis shifts to sustaining inspection-ready systems—a transition fraught with gaps in metadata governance and decentralized workflows. As noted in Health of the Validation Program, organizations often discover latent weaknesses in change control or data traceability only during audits, underscoring the need for proactive systems.
Next year it could flop back, to be honest these are just two sides of the same coin.
Operational Realities Driving the Change
The 2025 report highlights two critical pain points:
Documentation traceability : 69% of teams using digital validation tools cite automated audit trails as their top benefit, yet only 13% integrate these systems with project management platform . This siloing creates last-minute scrambles to reconcile disparate records.
Experience gaps : With 42% of professionals having 6–15 years of experience, mid-career teams lack the institutional knowledge to prevent audit pitfalls—a vulnerability exacerbated by retiring senior experts .
Organizations that treated compliance as a checkbox exercise now face operational reckoning, as fragmented systems struggle to meet the FDA’s expectations for real-time data access and holistic process understanding.
Similarly, teams that relied on 1 or 2 full-time employees, and leveraged contractors, also struggle with building and retaining expertise.
Strategic Implications
To bridge this gap, forward-thinking teams continue to adopt risk-adaptive validation models that align with ICH Q10’s lifecycle approach. By embedding audit readiness into daily work organizations can transform validation from a cost center to a strategic asset. As argued in Principles-Based Compliance, this shift requires rethinking quality culture: audit preparedness is not a periodic sprint but a byproduct of robust, self-correcting systems.
In essence, audit readiness reflects validation’s evolution from a tactical compliance activity to a cornerstone of enterprise quality—a theme that will continue to dominate the profession’s agenda and reflects the need to drive for maturity.
Digital Validation Adoption Reaches Tipping Point
Digital validation systems have seen a 28% adoption increase since 2024, with 58% of organizations now using these tools . By 2025, 93% of firms either use or plan to adopt digital validation, signaling and sector-wide transformation. Early adopters report significant returns: 63% meet or exceed ROI expectations, achieving 50% faster cycle times and reduced deviations. However, integration gaps persist, as only 13% connect digital validation with project management tools, highlighting siloed workflows.
None of this should be a surprise, especially since Kneat, a provider of an electronic validation management system, sponsored the report.
Table 2: Digital Validation Adoption Metrics (2025)
Metric
Value
Organizations using digital systems
58%
ROI expectations met/exceeded
63%
Integration with project tools
13%
For me, the real challenge here, as I explored in my post “Beyond Documents: Embracing Data-Centric Thinking“, is not just settling for paper-on-glass but to start thinking of your validation data as a larger lifecycle.
Leveraging Data-Centric Thinking for Digital Validation Transformation
The shift from document-centric to data-centric validation represents a paradigm shift in how regulated industries approach compliance, as outlined in Beyond Documents: Embracing Data-Centric Thinking. This transition aligns with the 2025 State of Validation Report’s findings on digital adoption trends and addresses persistent challenges like audit readiness and workforce pressures.
The Paper-on-Glass Trap in Validation
Many organizations remain stuck in “paper-on-glass” validation models, where digital systems replicate paper-based workflows without leveraging data’s full potential. This approach perpetuates inefficiencies such as:
Manual data extraction requiring hours to reconcile disparate records
Inflated validation cycles due to rigid document structures that limit adaptive testing
Increased error rates from static protocols that cannot dynamically respond to process deviations
Principles of Data-Centric Validation
True digital transformation requires reimagining validation through four core data-centric principles:
Unified Data Layer Architecture: The adoption of unified data layer architectures marks a paradigm shift in validation practices, as highlighted in the 2025 State of Validation Report. By replacing fragmented document-centric models with centralized repositories, organizations can achieve real-time traceability and automated compliance with ALCOA++ principles. The transition to structured data objects over static PDFs directly addresses the audit readiness challenges discussed above, ensuring metadata remains enduring and available across decentralized teams.
Dynamic Protocol Generation: AI-driven dynamic protocol generation may reshape validation efficiency. By leveraging natural language processing and machine learning, the hope is to have systems analyze historical protocols and regulatory guidelines to auto-generate context-aware test scripts. However, regulatory acceptance remains a barrier—only 10% of firms integrate validation systems with AI analytics, highlighting the need for controlled pilots in low-risk scenarios before broader deployment.
Continuous Process Verification: Continuous Process Verification (CPV) has emerged as a cornerstone of the industry as IoT sensors and real-time analytics enabling proactive quality management. Unlike traditional batch-focused validation, CPV systems feed live data from manufacturing equipment into validation platforms, triggering automated discrepancy investigations when parameters exceed thresholds. By aligning with ICH Q10’s lifecycle approach, CPV transforms validation from a compliance exercise into a strategic asset.
Validation as Code: The validation-as-code movement, pioneered in semiconductor and nuclear industries, represents the next frontier in agile compliance. By representing validation requirements as machine-executable code, teams automate regression testing during system updates and enable Git-like version control for protocols. The model’s inherent auditability—with every test result linked to specific code commits—directly addresses the data integrity priorities ranked #1 by 63% of digital validation adopters.
Table 1: Document-Centric vs. Data-Centric Validation Models
Aspect
Document-Centric
Data-Centric
Primary Artifact
PDF/Word Documents
Structured Data Objects
Change Management
Manual Version Control
Git-like Branching/Merging
Audit Readiness
Weeks of Preparation
Real-Time Dashboard Access
AI Compatibility
Limited (OCR-Dependent)
Native Integration (eg, LLM Fine-Tuning)
Cross-System Traceability
Manual Matrix Maintenance
Automated API-Driven Links
Implementation Roadmap
Organizations progressing towards maturity should:
AI in Validation: Early Adoption, Strategic Potential
Artificial intelligence (AI) adoption and validation are still in the early stages, though the outlook is promising. Currently, much of the conversation around AI is driven by hype, and while there are encouraging developments, significant questions remain about the fundamental soundness and reliability of AI technologies.
In my view, AI is something to consider for the future rather than immediate implementation, as we still need to fully understand how it functions. There are substantial concerns regarding the validation of AI systems that the industry must address, especially as we approach more advanced stages of integration. Nevertheless, AI holds considerable potential, and leading-edge companies are already exploring a variety of approaches to harness its capabilities.
Workloads increased for 66% of teams in 2025, yet 39% operate with 1–3 members, exacerbating talent gaps . Mid-career professionals (42% with 6–15 years of experience) dominate the workforce, signaling a looming “experience gap” as senior experts retire. This echoes 2023 quality challenges, where turnover risks and knowledge silos threaten operational resilience. Outsourcing has become a critical strategy, with 70% of firms relying on external partners for at least 10% of validation work.
Organizations are shifting from reactive compliance to building “always-ready” systems.
From Firefighting to Future-Proofing: The Strategic Shift to “Always-Ready” Quality Systems
The industry’s transition from reactive compliance to “always-ready” systems represents a fundamental reimagining of quality management. This shift aligns with the Excellence Triad framework—efficiency, effectiveness, and elegance—introduced in my 2025 post on elegant quality systems, where elegance is defined as the seamless integration of intuitive design, sustainability, and user-centric workflows. Rather than treating compliance as a series of checkboxes to address during audits, organizations must now prioritize systems that inherently maintain readiness through proactive risk mitigation , real-time data integrity , and self-correcting workflows .
Elegance as the Catalyst for Readiness
The concept of “always-ready” systems draws heavily from the elegance principle, which emphasizes reducing friction while maintaining sophistication. .
Principles-Based Compliance and Quality
The move towards always-ready systems also reflects lessons from principles-based compliance , which prioritizes regulatory intent over prescriptive rules.
Cultural and Structural Enablers
Building always-ready systems demands more than technology—it requires a cultural shift. The 2021 post on quality culture emphasized aligning leadership behavior with quality values, a theme reinforced by the 2025 VUCA/BANI framework , which advocates for “open-book metrics” and cross-functional transparency to prevent brittleness in chaotic environments. F
Outcomes Over Obligation
Ultimately, always-ready systems transform compliance from a cost center into a strategic asset. As noted in the 2025 elegance post , organizations using risk-adaptive documentation practices and API-driven integrations report 35% fewer audit findings, proving that elegance and readiness are mutually reinforcing. This mirrors the semiconductor industry’s success with validation-as-code, where machine-readable protocols enable automated regression testing and real-time traceability.
By marrying elegance with enterprise-wide integration, organizations are not just surviving audits—they’re redefining excellence as a state of perpetual readiness, where quality is woven into the fabric of daily operations rather than bolted on during inspections.
Workforce Resilience in Lean Teams
The imperative for cross-training in digital tools and validation methodologies stems from the interconnected nature of modern quality systems, where validation professionals must act as “system gardeners” nurturing adaptive, resilient processes. This competency framework aligns with the principles outlined in Building a Competency Framework for Quality Professionals as System Gardeners, emphasizing the integration of technical proficiency, regulatory fluency, and collaborative problem-solving.
Competency: Digital Validation Cross-Training
Definition : The ability to fluidly navigate and integrate digital validation tools with traditional methodologies while maintaining compliance and fostering system-wide resilience.
Dimensions and Elements
1. Adaptive Technical Mastery
Elements :
Tool Agnosticism : Proficiency across validation platforms and core systems (eQMS, etc) with ability to map workflows between systems.
System Literacy : Competence in configuring integrations between validation tools and electronic systems, such as an MES.
CSA Implementation : Practical application of Computer Software Assurance principles and GAMP 5.
2. Regulatory-DNA Integration
Elements :
ALCOA++ Fluency : Ability to implement data integrity controls that satisfy FDA 21 CFR Part 11 and EU Annex 11.
Inspection Readiness : Implementation of inspection readiness principles
Risk-Based AI Validation : Skills to validate machine learning models per FDA 2024 AI/ML Validation Draft Guidance.
3. Cross-Functional Cultivation
Elements :
Change Control Hybridization : Ability to harmonize agile sprint workflows with ASTM E2500 and GAMP 5 change control requirements.
Knowledge Pollination : Regular rotation through manufacturing/QC roles to contextualize validation decisions.
Validation’s Role in Broader Quality Ecosystems
Data Integrity as a Strategic Asset
The axiom “we are only as good as our data” encapsulates the existential reality of regulated industries, where decisions about product safety, regulatory compliance, and process reliability hinge on the trustworthiness of information. The ALCOA++ framework— Attributable, Legible, Contemporary, Original, Accurate, Complete, Consistent, Enduring, and Available —provides the architectural blueprint for embedding data integrity into every layer of validation and quality systems. As highlighted in the 2025 State of Validation Report , organizations that treat ALCOA++ as a compliance checklist rather than a cultural imperative risk systemic vulnerabilities, while those embracing it as a strategic foundation unlock resilience and innovation.
Cultural Foundations: ALCOA++ as a Mindset, Not a Mandate
The 2025 validation landscape reveals a stark divide: organizations treating ALCOA++ as a technical requirement struggle with recurring findings, while those embedding it into their quality culture thrive. Key cultural drivers include:
Leadership Accountability : Executives who tie KPIs to data integrity metrics (eg, % of unattributed deviations) signal its strategic priority, aligning with Principles-Based Compliance.
Cross-Functional Fluency : Training validation teams in ALCOA++-aligned tools bridges the 2025 report’s noted “experience gap” among mid-career professionals .
Psychological Safety : Encouraging staff to report near-misses without fear—a theme in Health of the Validation Program —prevents data manipulation and fosters trust.
The Cost of Compromise: When Data Integrity Falters
The 2025 report underscores that 25% of organizations spend >10% of project budgets on validation—a figure that balloons when data integrity failures trigger rework. Recent FDA warning letters cite ALCOA++ breaches as root causes for:
Batch rejections due to unverified temperature logs (lack of original records).
Clinical holds from incomplete adverse event reporting (failure of Complete ).
Import bans stemming from inconsistent stability data across sites (breach of Consistent ).
Conclusion: ALCOA++ as the Linchpin of Trust
In an era where AI-driven validation and hybrid inspections redefine compliance, ALCOA++ principles remain the non-negotiable foundation. Organizations must evolve beyond treating these principles as static rules, instead embedding them into the DNA of their quality systems—as emphasized in Pillars of Good Data. When data integrity drives every decision, validation transforms from a cost center into a catalyst for innovation, ensuring that “being as good as our data” means being unquestionably reliable.
Future-Proofing Validation in 2025
The 2025 validation landscape demands a dual focus: accelerating digital/AI adoption while fortifying human expertise . Key recommendations include:
Prioritize Integration : Break down silos by connecting validation tools to data sources and analytics platforms.
Adopt Risk-Based AI : Start with low-risk AI pilots to build regulatory confidence.
Invest in Talent Pipelines : Address mid-career gaps via academic partnerships and reskilling programs.
As the industry navigates these challenges, validation will increasingly serve as a catalyst for quality innovation—transforming from a cost center to a strategic asset.
Continuous Process Verification (CPV) represents the final and most dynamic stage of the FDA’s process validation lifecycle, designed to ensure manufacturing processes remain validated during routine production. The methodology for CPV and the selection of appropriate tools are deeply rooted in the FDA’s 2011 guidance, Process Validation: General Principles and Practices, which emphasizes a science- and risk-based approach to quality assurance. This blog post examines how CPV methodologies align with regulatory frameworks and how tools are selected to meet compliance and operational objectives.
CPV Methodology: Anchored in the FDA’s Lifecycle Approach
The FDA’s process validation framework divides activities into three stages: Process Design (Stage 1), Process Qualification (Stage 2), and Continued Process Verification (Stage 3). CPV, as Stage 3, is not an isolated activity but a continuation of the knowledge gained in earlier stages. This lifecycle approach is our framework.
Stage 1: Process Design
During Stage 1, manufacturers define Critical Quality Attributes (CQAs) and Critical Process Parameters (CPPs) through risk assessments and experimental design. This phase establishes the scientific basis for monitoring and control strategies. For example, if a parameter’s variability is inherently low (e.g., clustering near the Limit of Quantification, or LOQ), this knowledge informs later decisions about CPV tools.
Stage 2: Process Qualification
Stage 2 confirms that the process, when operated within established parameters, consistently produces quality products. Data from this stage—such as process capability indices (Cpk/Ppk)—provide baseline metrics for CPV. For instance, a high Cpk (>2) for a parameter near LOQ signals that traditional control charts may be inappropriate due to limited variability.
Stage 3: Continued Process Verification
CPV methodology is defined by two pillars:
Ongoing Monitoring: Continuous collection and analysis of CPP/CQA data.
Adaptive Control: Adjustments to maintain process control, informed by statistical and risk-based insights.
Regulatory agencies require that CPV methodologies must be tailored to the process’s unique characteristics. For example, a parameter with data clustered near LOQ (as in the case study) demands a different approach than one with normal variability.
Selecting CPV Tools: Aligning with Data and Risk
The framework emphasizes that CPV tools must be scientifically justified, with selection criteria based on data suitability, risk criticality, and regulatory alignment.
Data Suitability Assessments
Data suitability assessments form the bedrock of effective Continuous Process Verification (CPV) programs, ensuring that monitoring tools align with the statistical and analytical realities of the process. These assessments are not merely technical exercises but strategic activities rooted in regulatory expectations, scientific rigor, and risk management. Below, we explore the three pillars of data suitability—distribution analysis, process capability evaluation, and analytical performance considerations—and their implications for CPV tool selection.
The foundation of any statistical monitoring system lies in understanding the distribution of the data being analyzed. Many traditional tools, such as control charts, assume that data follows a normal (Gaussian) distribution. This assumption underpins the calculation of control limits (e.g., ±3σ) and the interpretation of rule violations. To validate this assumption, manufacturers employ tests such as the Shapiro-Wilk test or Anderson-Darling test, which quantitatively assess normality. Visual tools like Q-Q plots or histograms complement these tests by providing intuitive insights into data skewness, kurtosis, or clustering.
When data deviates significantly from normality—common in parameters with values clustered near detection or quantification limits (e.g., LOQ)—the use of parametric tools like control charts becomes problematic. For instance, a parameter with 95% of its data below the LOQ may exhibit a left-skewed distribution, where the calculated mean and standard deviation are distorted by the analytical method’s noise rather than reflecting true process behavior. In such cases, traditional control charts generate misleading signals, such as Rule 1 violations (±3σ), which flag analytical variability rather than process shifts.
To address non-normal data, manufacturers must transition to non-parametric methods that do not rely on distributional assumptions. Tolerance intervals, which define ranges covering a specified proportion of the population with a given confidence level, are particularly useful for skewed datasets. For example, a 95/99 tolerance interval (95% of data within 99% confidence) can replace ±3σ limits for non-normal data, reducing false positives. Bootstrapping—a resampling technique—offers another alternative, enabling robust estimation of control limits without assuming normality.
Process Capability: Aligning Tools with Inherent Variability
Process capability indices, such as Cp and Cpk, quantify a parameter’s ability to meet specifications relative to its natural variability. A high Cp (>2) indicates that the process variability is small compared to the specification range, often resulting from tight manufacturing controls or robust product designs. While high capability is desirable for quality, it complicates CPV tool selection. For example, a parameter with a Cp of 3 and data clustered near the LOQ will exhibit minimal variability, rendering control charts ineffective. The narrow spread of data means that control limits shrink, increasing the likelihood of false alarms from minor analytical noise.
In such scenarios, traditional SPC tools like control charts lose their utility. Instead, manufacturers should adopt attribute-based monitoring or batch-wise trending. Attribute-based approaches classify results as pass/fail against predefined thresholds (e.g., LOQ breaches), simplifying signal interpretation. Batch-wise trending aggregates data across production lots, identifying shifts over time without overreacting to individual outliers. For instance, a manufacturer with a high-capability dissolution parameter might track the percentage of batches meeting dissolution criteria monthly, rather than plotting individual tablet results.
The FDA’s emphasis on risk-based monitoring further supports this shift. ICH Q9 guidelines encourage manufacturers to prioritize resources for high-risk parameters, allowing low-risk, high-capability parameters to be monitored with simpler tools. This approach reduces administrative burden while maintaining compliance.
Analytical Performance: Decoupling Noise from Process Signals
Parameters operating near analytical limits of detection (LOD) or quantification (LOQ) present unique challenges. At these extremes, measurement systems contribute significant variability, often overshadowing true process signals. For example, a purity assay with an LOQ of 0.1% may report values as “<0.1%” for 98% of batches, creating a dataset dominated by the analytical method’s imprecision. In such cases, failing to decouple analytical variability from process performance leads to misguided investigations and wasted resources.
To address this, manufacturers must isolate analytical variability through dedicated method monitoring programs. This involves:
Analytical Method Validation: Rigorous characterization of precision, accuracy, and detection capabilities (e.g., determining the Practical Quantitation Limit, or PQL, which reflects real-world method performance).
Separate Trending: Implementing control charts or capability analyses for the analytical method itself (e.g., monitoring LOQ stability across batches).
Threshold-Based Alerts: Replacing statistical rules with binary triggers (e.g., investigating only results above LOQ).
For example, a manufacturer analyzing residual solvents near the LOQ might use detection capability indices to set action limits. If the analytical method’s variability (e.g., ±0.02% at LOQ) exceeds the process variability, threshold alerts focused on detecting values above 0.1% + 3σ_analytical would provide more meaningful signals than traditional control charts.
Integration with Regulatory Expectations
Regulatory agencies, including the FDA and EMA, mandate that CPV methodologies be “scientifically sound” and “statistically valid” (FDA 2011 Guidance). This requires documented justification for tool selection, including:
Normality Testing: Evidence that data distribution aligns with tool assumptions (e.g., Shapiro-Wilk test results).
Capability Analysis: Cp/Cpk values demonstrating the rationale for simplified monitoring.
A 2024 FDA warning letter highlighted the consequences of neglecting these steps. A firm using control charts for non-normal dissolution data received a 483 observation for lacking statistical rationale, underscoring the need for rigor in data suitability assessments.
Case Study Application: A manufacturer monitoring a CQA with 98% of data below LOQ initially used control charts, triggering frequent Rule 1 violations (±3σ). These violations reflected analytical noise, not process shifts. Transitioning to threshold-based alerts (investigating only LOQ breaches) reduced false positives by 72% while maintaining compliance.
Risk-Based Tool Selection
The ICH Q9 Quality Risk Management (QRM) framework provides a structured methodology for identifying, assessing, and controlling risks to pharmaceutical product quality, with a strong emphasis on aligning tool selection with the parameter’s impact on patient safety and product efficacy. Central to this approach is the principle that the rigor of risk management activities—including the selection of tools—should be proportionate to the criticality of the parameter under evaluation. This ensures resources are allocated efficiently, focusing on high-impact risks while avoiding overburdening low-risk areas.
Prioritizing Tools Through the Lens of Risk Impact
The ICH Q9 framework categorizes risks based on their potential to compromise product quality, guided by factors such as severity, detectability, and probability. Parameters with a direct impact on critical quality attributes (CQAs)—such as potency, purity, or sterility—are classified as high-risk and demand robust analytical tools. Conversely, parameters with minimal impact may require simpler methods. For example:
High-Impact Parameters: Use Failure Mode and Effects Analysis (FMEA) or Fault Tree Analysis (FTA) to dissect failure modes, root causes, and mitigation strategies.
Medium-Impact Parameters: Apply a tool such as a PHA.
Low-Impact Parameters: Utilize checklists or flowcharts for basic risk identification.
This tiered approach ensures that the complexity of the tool matches the parameter’s risk profile.
Importance: The parameter’s criticality to patient safety or product efficacy.
Complexity: The interdependencies of the system or process being assessed.
Uncertainty: Gaps in knowledge about the parameter’s behavior or controls.
For instance, a high-purity active pharmaceutical ingredient (API) with narrow specification limits (high importance) and variable raw material inputs (high complexity) would necessitate FMEA to map failure modes across the supply chain. In contrast, a non-critical excipient with stable sourcing (low uncertainty) might only require a simplified risk ranking matrix.
Implementing a Risk-Based Approach
1. Assess Parameter Criticality
Begin by categorizing parameters based on their impact on CQAs, as defined during Stage 1 (Process Design) of the FDA’s validation lifecycle. Parameters are classified as:
Critical: Directly affecting safety/efficacy
Key: Influencing quality but not directly linked to safety
Non-Critical: No measurable impact on quality
This classification informs the depth of risk assessment and tool selection.
2. Select Tools Using the ICU Framework
Importance-Driven Tools: High-importance parameters warrant tools that quantify risk severity and detectability. FMEA is ideal for linking failure modes to patient harm, while Statistical Process Control (SPC) charts monitor real-time variability.
Complexity-Driven Tools: For multi-step processes (e.g., bioreactor operations), HACCP identifies critical control points, while Ishikawa diagrams map cause-effect relationships.
Uncertainty-Driven Tools: Parameters with limited historical data (e.g., novel drug formulations) benefit from Bayesian statistical models or Monte Carlo simulations to address knowledge gaps.
3. Document and Justify Tool Selection
Regulatory agencies require documented rationale for tool choices. For example, a firm using FMEA for a high-risk sterilization process must reference its ability to evaluate worst-case scenarios and prioritize mitigations. This documentation is typically embedded in Quality Risk Management (QRM) Plans or validation protocols.
Integration with Living Risk Assessments
Living risk assessments are dynamic, evolving documents that reflect real-time process knowledge and data. Unlike static, ad-hoc assessments, they are continually updated through:
1. Ongoing Data Integration
Data from Continual Process Verification (CPV)—such as trend analyses of CPPs/CQAs—feeds directly into living risk assessments. For example, shifts in fermentation yield detected via SPC charts trigger updates to bioreactor risk profiles, prompting tool adjustments (e.g., upgrading from checklists to FMEA).
2. Periodic Review Cycles
Living assessments undergo scheduled reviews (e.g., biannually) and event-driven updates (e.g., post-deviation). A QRM Master Plan, as outlined in ICH Q9(R1), orchestrates these reviews by mapping assessment frequencies to parameter criticality. High-impact parameters may be reviewed quarterly, while low-impact ones are assessed annually.
3. Cross-Functional Collaboration
Quality, manufacturing, and regulatory teams collaborate to interpret CPV data and update risk controls. For instance, a rise in particulate matter in vials (detected via CPV) prompts a joint review of filling line risk assessments, potentially revising tooling from HACCP to FMEA to address newly identified failure modes.
Regulatory Expectations and Compliance
Regulatory agencies requires documented justification for CPV tool selection, emphasizing:
Protocol Preapproval: CPV plans must be submitted during Stage 2, detailing tool selection criteria.
Change Control: Transitions between tools (e.g., SPC → thresholds) require risk assessments and documentation.
Training: Staff must be proficient in both traditional (e.g., Shewhart charts) and modern tools (e.g., AI).
A 2024 FDA warning letter cited a firm for using control charts on non-normal data without validation, underscoring the consequences of poor tool alignment.
A Framework for Adaptive Excellence
The FDA’s CPV framework is not prescriptive but principles-based, allowing flexibility in methodology and tool selection. Successful implementation hinges on:
Science-Driven Decisions: Align tools with data characteristics and process capability.
Risk-Based Prioritization: Focus resources on high-impact parameters.
Regulatory Agility: Justify tool choices through documented risk assessments and lifecycle data.
CPV is a living system that must evolve alongside processes, leveraging tools that balance compliance with operational pragmatism. By anchoring decisions in the FDA’s lifecycle approach, manufacturers can transform CPV from a regulatory obligation into a strategic asset for quality excellence.