Draft Annex 11 Section 10: “Handling of Data” — Where Digital Reality Meets Data Integrity

Pharmaceutical compliance is experiencing a tectonic shift, and nowhere is that more clear than in the looming overhaul of EU GMP Annex 11. Most quality leaders have been laser-focused on the revised demands for electronic signatures, access management, or supplier oversight—as I’ve detailed in my previous deep analyses, but few realize that Section 10: Handling of Data is the sleeping volcano in the draft. It is here that the revised Annex 11 transforms data handling controls from “do your best and patch with SOPs” into an auditable, digital, risk-based discipline shaped by technological change.

This isn’t about stocking up your data archive or flipping the “audit trail” switch. This is about putting every point of data entry, transfer, migration, and security under the microscope—and making their control, verification, and risk mitigation the default, not the exception. If, until now, your team has managed GMP data with a cocktail of trust, periodic spot checks, and a healthy dose of hope, you are about to discover just how high the bar has been raised.

The Heart of Section 10: Every Data Touchpoint Is Critical

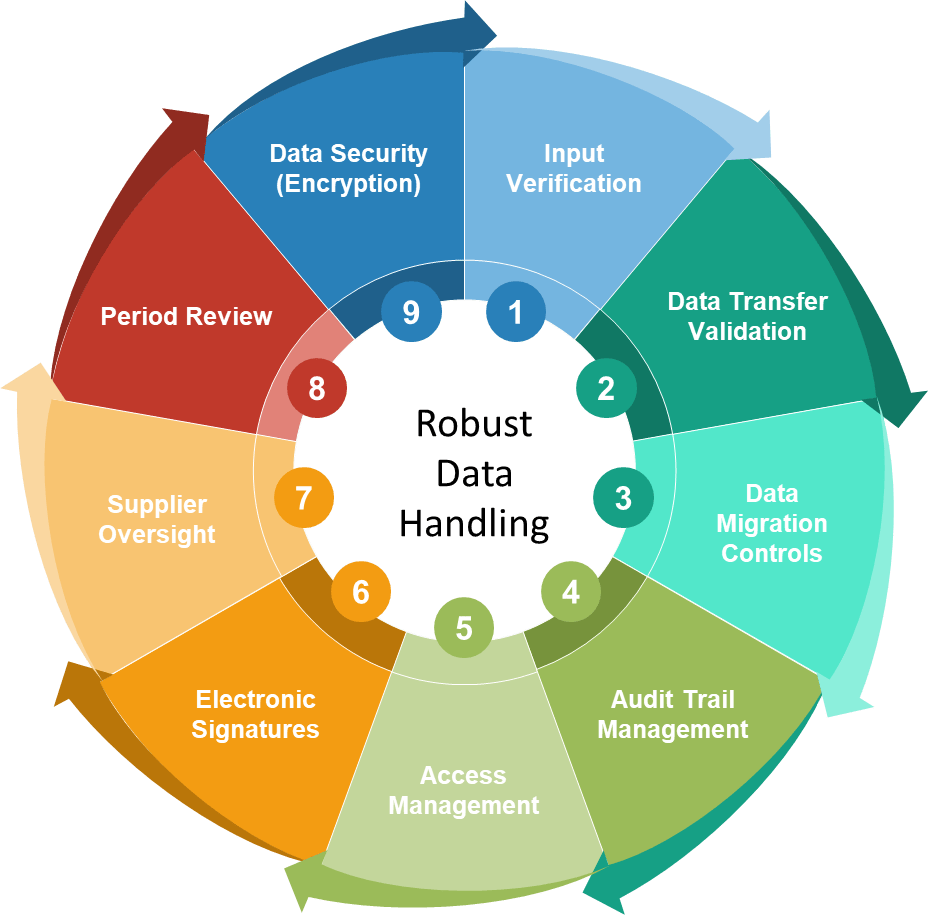
Section 10, as rewritten in the draft Annex 11, isn’t long, but it is dense. Its brevity belies the workload it creates: a mandate for systematizing, validating, and documenting every critical movement or entry of GMP-relevant data. The section is split into four thematic requirements, each of which deserves careful analysis:

  1. Input verification—requiring plausibility checks for all manual entry of critical data,
  2. Data transfer—enforcing validated electronic interfaces and exceptional controls for any manual transcription,
  3. Data migration—demanding that every one-off or routine migration goes through a controlled, validated process,
  4. Encryption—making secure storage and movement of critical data a risk-based expectation, not an afterthought.

Understanding these not as checkboxes but as an interconnected risk-control philosophy is the only way to achieve robust compliance—and to survive inspection without scrambling for a “procedural explanation” for each data error found.

Input Verification: Automating the Frontline Defense

The End of “Operator Skill” as a Compliance Pillar

Human error, for as long as there have been batch records and lab notebooks, has been a known compliance risk. Before electronic records, the answer was redundancy: a second set of eyes, a periodic QC review, or—let’s be realistic—a quick initial on a form the day before an audit. But in the age of digital systems, Section 10.1 recognizes the simple truth: where technology can prevent senseless or dangerous entries, it must.

Manual entry of critical data—think product counts, analytical results, process parameters—is now subject to real-time, system-enforced plausibility checks. Gone are the days when outlandish numbers in a yield calculation raises no flag, or when an analyst logs a temperature outside any physically possible range with little more than a raised eyebrow. Section 10 demands that every critical data field is bounded by logic—ranges, patterns, value consistency checks—and that nonsensical entries are not just flagged but, ideally, rejected automatically.

Any field that is critical to product quality or patient safety must be controlled at the entry point by automated means. If such logic is technically feasible but not deployed, expect intensive regulatory scrutiny—and be prepared to defend, in writing, why it isn’t in place.

Designing Plausibility Controls: Making Them Work

What does this mean on a practical level? It means scoping your process maps and digitized workflows to inventory every manual input touching GMP outcomes. For each, you need to:

  • Establish plausible ranges and patterns based on historical data, scientific rationale, and risk analysis.
  • Program system logic to enforce these boundaries, including mandatory explanatory overrides for any values outside “normal.”
  • Ensure every override is logged, investigated, and trended—because “frequent overrides” typically signal either badly set limits or a process slipping out of control.

But it’s not just numeric entries. Selectable options, free-text assessments, and uploads of evidence (e.g., images or files) must also be checked for logic and completeness, and mechanisms must exist to prevent accidental omissions or nonsensical entries (like uploading the wrong batch report for a product lot).

These expectations put pressure on system design teams and user interface developers, but they also fundamentally change the culture: from one where error detection is post hoc and personal, to one where error prevention is systemic and algorithmic.

Data Transfer: Validated Interfaces as the Foundation

Automated Data Flows, Not “Swivel Chair Integration”

The next Section 10 pillar wipes out the old “good enough” culture of manually keying critical data between systems—a common practice all the way up to the present day, despite decades of technical options to network devices, integrate systems, and use direct data feeds.

In this new paradigm, critical data must be transferred between systems electronically whenever possible. That means, for example, that:

  • Laboratory instruments should push their results to the LIMS automatically, not rely on an analyst to retype them.
  • The MES should transmit batch data to ERP systems for release decisions without recourse to copy-pasting or printout scanning.
  • Environmental monitoring systems should use validated data feeds into digital reports, not rely on handwritten transcriptions or spreadsheet imports.

Where technology blocks this approach—due to legacy equipment, bespoke protocols, or prohibitive costs—manual transfer is only justifiable as an explicitly assessed and mitigated risk. In those rare cases, organizations must implement secondary controls: independent verification by a second person, pre- and post-transfer checks, and logging of every step and confirmation.

What does a validated interface mean in this context? Not just that two systems can “talk,” but that the transfer is:

  • Complete (no dropped or duplicated records)
  • Accurate (no transformation errors or field misalignments)
  • Secure (with no risk of tampering or interception)

Every one of these must be tested at system qualification (OQ/PQ) and periodically revalidated if either end of the interface changes. Error conditions (such as data out of expected range, failed transfers, or discrepancies) must be logged, flagged to the user, and if possible, halt the associated GMP process until resolved.

Practical Hurdles—and Why They’re No Excuse

Organizations will protest: not every workflow can be harmonized, and some labyrinthine legacy systems lack the APIs or connectivity for automation. The response is clear: you can do manual transfer only when you’ve mapped, justified, and mitigated the added risk. This risk assessment and control strategy will be expected, and if auditors spot critical data being handed off by paper (including the batch record) or spreadsheet without robust double verification, you’ll have a finding that’s impossible to “train away.”

Remember, Annex 11’s philosophy flows from data integrity risk, not comfort or habit. In the new digital reality, technically possible is the compliance baseline.

Data Migration: Control, Validation, and Traceability

Migration Upgrades Are Compliance Projects, Not IT Favors

Section 10.3 brings overdue clarity to a part of compliance historically left to “IT shops” rather than Quality or data governance leads: migrations. In recent years, as cloud moves and system upgrades have exploded, so have the risks. Data gaps, incomplete mapping, field mismatches, and “it worked in test but not in prod” errors lurk in every migration, and their impact is enormous—lost batch records, orphaned critical information, and products released with documentation that simply vanished after a system reboot.

Annex 11 lays down a clear gauntlet: all data migrations must be planned, risk-assessed, and validated. Both the sending and receiving platforms must be evaluated for data constraints, and the migration process itself is subject to the same quality rigor as any new computerized system implementation.

This requires a full lifecycle approach:

  • Pre-migration planning to document field mapping, data types, format and allowable value reconciliations, and expected record counts.
  • Controlled execution with logs of each action, anomalies, and troubleshooting steps.
  • Post-migration verification—not just a “looks ok” sample, but a full reconciliation of batch counts, search for missing or duplicated records, and (where practical) data integrity spot checks.
  • Formal sign-off, with electronic evidence and supporting risk assessment, that the migration did not introduce errors, losses, or uncontrolled transformations.

Validating the Entire Chain, Not Just the Output

Annex 11’s approach is process-oriented. You can’t simply “prove a few outputs match”; you must show that the process as executed controlled, logged, and safeguarded every record. If source data was garbage, destination data will be worse—so validation includes both the “what” and the “how.” Don’t forget to document how you’ll highlight or remediate mismatched or orphaned records for future investigation or reprocessing; missing this step is a quality and regulatory land mine.

It’s no longer acceptable to treat migration as a purely technical exercise. Every migration is a compliance event. If you can’t show the system’s record—start-to-finish—of how, by whom, when, and under what procedural/corrective control migrations have been performed, you are vulnerable on every product released or batch referencing that data.

Encryption: Securing Data as a Business and Regulatory Mandate

Beyond “Defense in Depth” to a Compliance Expectation

Historically, data security and encryption were IT problems, and the GMP justification for employing them was often little stronger than “everyone else is doing it.” The revised Section 10 throws that era in the trash bin. Encryption is now a risk-based compliance requirement for storage and transfer of critical GMP data. If you don’t use strong encryption “where applicable,” you’d better have a risk assessment ready that shows why the threat is minimal or the technical/operational risk of encryption is greater than the gain.

This requirement is equally relevant whether you’re holding batch record files, digital signatures, process parameter archives, raw QC data, or product release records. Security compromises aren’t just a hacking story; they’re a data integrity, fraud prevention, and business continuity story. In the new regulatory mindset, unencrypted critical data is always suspicious. This is doubly so when the data moves through cloud services, outsourced IT, or is ever accessible outside the organization’s perimeter.

Implementing and Maintaining Encryption: Avoiding Hollow Controls

To comply, you need to specify and control:

  • Encryption standards (e.g., minimum AES-256 for rest and transit)
  • Robust key management (with access control, periodic audits, and revocation/logging routines)
  • Documentation for every location and method where data is or isn’t encrypted, with reference to risk assessments
  • Procedures for regularly verifying encryption status and responding to incidents or suspected compromises

Regulators will likely want to see not only system specifications but also periodic tests, audit trails of encryption/decryption, and readouts from recent patch cycles or vulnerability scans proving encryption hasn’t been silently “turned off” or configured improperly.

Section 10 Is the Hub of the Data Integrity Wheel

Section 10 cannot be treated in isolation. It underpins and is fed by virtually every other control in the GMP computerized system ecosystem.

  • Input controls support audit trails: If data can be entered erroneously or fraudulently, the best audit trail is just a record of error.
  • Validated transfers prevent downstream chaos: If system A and system B don’t transfer reliably, everything “downstream” is compromised.
  • Migrations touch batch continuity and product release: If you lose or misplace records, your recall and investigation responses are instantly impaired.
  • Encryption protects change control and deviation closure: If sensitive data is exposed, audit trails and signature controls can’t protect you from the consequences.

Risk-Based Implementation: From Doctrine to Daily Practice

The draft’s biggest strength is its honest embrace of risk-based thinking. Every expectation in Section 10 is to be scaled by impact to product quality and patient safety. You can—and must—document decisions for why a given control is (or is not) necessary for every data touchpoint in your process universe.

That means your risk assessment does more than check a box. For every GMP data field, every transfer, every planned or surprise migration, every storage endpoint, you need to:

  • Identify every way the data could be made inaccurate, incomplete, unavailable, or stolen.
  • Define controls appropriate both to the criticality of the data and the likelihood and detectability of error or compromise.
  • Test and document both normal and failure scenarios—because what matters in a recall, investigation, or regulatory challenge is what happens when things go wrong, not just when they go right.

ALCOA+ is codified by these risk processes: accuracy via plausibility checks, completeness via transfer validation, longevity via robust migration and storage; contemporaneity and endurability via encryption and audit linkage.

Handling of Data vs. Previous Guidance and Global Norms

While much of this seems “good practice,” make no mistake: the regulatory expectations have fundamentally changed. In 2011, Annex 11 was silent on specifics, and 21 CFR Part 11 relied on broad “input checks” and an expectation that organizations would design controls relative to what was reasonable at the time.

Now:

  • Electronic input plausibility is not just a “should” but a “must”—if your system can automate it, you must.
  • Manual transfer is justified, not assumed; all manual steps must have procedural/methodological reinforcement and evidence logs.
  • Migration is a qualification event. The entire lifecycle, not just the output, must be documented, trended, and reviewed.
  • Encryption is an expectation, not a best effort. The risk burden now falls on you to prove why it isn’t needed, not why it is.
  • Responsibility is on the MAH/manufacturer, not the vendor, IT, or “business owner.” You outsource activity, not liability.

This matches, in setting, recent FDA guidance via Computer Software Assurance (CSA), GAMP 5’s digital risk lifecycle, and every modern data privacy regulation. The difference is that, starting with the new Annex 11, these approaches are not “suggested”—they are codified.

Real-Life Scenarios: Application of Section 10

Imagine a high-speed packaging line. The operator enters the number of rejected vials per shift. In the old regime, the operator could mistype “80” as “800” or enter a negative number during a hasty correction. With section 10 in force, the system simply will not permit it—90% confidence that any such error will be caught before it mars the official record.

Now think about laboratory results—analysts transferring HPLC data into the LIMS manually. Every entry runs a risk of decimal misplacement or sample ID mismatch. Annex 11 now demands full instrument-to-LIMS interfacing (where feasible), and when not, a double verification protocol meticulously executed, logged, and reviewed.

On the migration front, consider upgrading your document management system. The stakes: decades of batch release records. In 2019, you might have planned a database export, a few spot checks, and post-migration validation of “high value” documents. Under the new Annex 11, you require a documented mapping of every critical field, technical and process reconciliation, error reporting, and lasting evidence for defensibility two or ten years from now.

Encryption is now expected as a default. Cloud-hosted data with no encryption? Prepare to be asked why, and to defend your choice with up-to-date, context-specific risk assessments—not hand-waving.

Bringing Section 10 to Life: Steps for Implementation

A successful strategy for aligning to Annex 11 Section 10 begins with an exhaustive mapping of all critical data touchpoints and their methods of entry, transfer, and storage. This is a multidisciplinary process, requiring cooperation among quality, IT, operations, and compliance teams.

For each critical data field or process, define:

  • The party responsible for its entry and management
  • The system’s capability for plausibility checking, range enforcement, and error prevention;
  • Mechanisms to block or correct entry outside expected norms
  • Methods of data handoff and transfer between systems, with documentation of integration or a procedural justification for unavoidable manual steps
  • Protocols and evidence logs for validation of both routine transfers and one-off (migration) events

For all manual data handling that remains, create detailed, risk-based procedures for independent verification and trending review. For data migration, walk through an end-to-end lifecycle—pre-migration risk mapping, execution protocols, post-migration review, discrepancy handling, and archiving of all planning/validation evidence.

For storage and transfer, produce a risk matrix for where and how critical data is held, updated, and moved, and deploy encryption accordingly. Document both technical standards and the process for periodic review and incident response.

Quality management is not the sole owner; business leads, system admins, and IT architects must be brought to the table. For every major change, tie change control procedures to a Section 10 review—any new process, upgrade, or integration comes back to data handling risk, with a closing check for automation and procedural compliance.

Regulatory Impact and Inspection Strategy

Regulatory expectations around data integrity are not only becoming more stringent—they are also far more precise and actionable than in the past. Inspectors now arrive prepared and trained to probe deeply into what’s called “data provenance”: that is, the complete, traceable life story of every critical data point. It’s no longer sufficient to show where a value appears in a final batch record or report; regulators want to see how that data originated, through which systems and interfaces it was transferred, how each entry or modification was verified, and exactly what controls were in place (or not in place) at each step.

Gone are the days when, if questioned about persistent risks like error-prone manual transcription, a company could deflect with, “that’s how we’ve always done it.” Now, inspectors expect detailed explanations and justifications for every manual, non-automated, or non-encrypted data entry or transfer. They will require you to produce not just policies but actual logs, complete audit trails, electronic signature evidence where required, and documented decision-making within your risk assessments for every process step that isn’t fully controlled by technology.

In practical terms, this means you must be able to reconstruct and defend the exact conditions and controls present at every point data is created, handled, moved, or modified. If a process relies on a workaround, a manual step, or an unvalidated migration, you will need transparent evidence that risks were understood, assessed, and mitigated—not simply asserted away.

The implications are profound: mastering Section 10 isn’t just about satisfying the regulator. Robust, risk-based data handling is fundamental to your operation’s resilience—improving traceability, minimizing costly errors or data loss, ensuring you can withstand disruption, and enabling true digital transformation across your business. Leaders who excel here will find that their compliance posture translates into real business value, competitive differentiation, and lasting operational stability.

The Bigger Picture: Section 10 as Industry Roadmap

What’s clear is this: Section 10 eliminates the excuses that have long made “data handling risk” a tolerated, if regrettable, feature of pharmaceutical compliance. It replaces them with a pathway for digital, risk-based, and auditable control culture. This is not just for global pharma behemoths—cloud-native startups, generics manufacturers, and even virtual companies reliant on CDMOs must take note. The same expectations now apply to every regulated data touchpoint, wherever in the supply chain or manufacturing lifecycle it lies.

Bringing your controls into compliance with Section 10 is a strategic imperative in 2025 and beyond. Those who move fastest will spend less time and money on post-inspection remediation, operate more efficiently, and have a defensible record for every outcome.

Requirement AreaAnnex 11 (2011)Draft Annex 11 Section 10 (2025)21 CFR Part 11GAMP 5 / Best Practice
Input verificationGeneral expectation, not definedMandatory for critical manual entry; system logic and boundaries“Input checks” required, methods not specifiedRisk-based, ideally automated
Data transferManual allowed, interface preferredValidated interfaces wherever possible; strict controls for manualImplicit through system interface requirementsAutomated transfer is the baseline, double checked for manual
Manual transcriptionAllowed, requires reviewOnly justified exceptions; robust secondary verification & documentationNot directly mentionedTwo-person verification, periodic audit and trending
Data migrationMentioned, not detailedMust be planned, risk-assessed, validated, and be fully auditableImplied via system lifecycle controlsFull protocol: mapping, logs, verification, and discrepancy handling
EncryptionNot referencedMandated for critical data; exceptions need documented, defensible riskRecommended, not strictly requiredDefault for sensitive data; standard in cloud, backup, and distributed setups
Audit trail for handlingImplied via system change auditingAll data moves and handling steps linked/logged in audit trailRequired for modifications/rest/correctionIntegrated with system actions, trended for error and compliance
Manual exceptionsNot formally addressedMust be justified and mitigated; always subject to periodic reviewNot directly statedException management, always with trending, review, and CAPA

Handling of Data as Quality Culture, Not Just IT Control

Section 10 in the draft Annex 11 is nothing less than the codification of real data integrity for the digitalized era. It lays out a field guide for what true GMP data governance looks like—not in the clouds of intention, but in the minutiae of everyday operation. Whether you’re designing a new MES integration, cleaning up the residual technical debt of manual record transfer, or planning the next system migration, take heed: how you handle data when no one’s watching is the new standard of excellence in pharmaceutical quality.

As always, the organizations that embrace these requirements as opportunities—not just regulatory burdens—will build a culture, a system, and a supply chain that are robust, efficient, and genuinely defensible.

Continuous Process Verification (CPV) Methodology and Tool Selection: A Framework Guided by FDA Process Validation

Continuous Process Verification (CPV) represents the final and most dynamic stage of the FDA’s process validation lifecycle, designed to ensure manufacturing processes remain validated during routine production. The methodology for CPV and the selection of appropriate tools are deeply rooted in the FDA’s 2011 guidance, Process Validation: General Principles and Practices, which emphasizes a science- and risk-based approach to quality assurance. This blog post examines how CPV methodologies align with regulatory frameworks and how tools are selected to meet compliance and operational objectives.

3 stages of process validation, with CPV in green as the 3rd stage

CPV Methodology: Anchored in the FDA’s Lifecycle Approach

The FDA’s process validation framework divides activities into three stages: Process Design (Stage 1), Process Qualification (Stage 2), and Continued Process Verification (Stage 3). CPV, as Stage 3, is not an isolated activity but a continuation of the knowledge gained in earlier stages. This lifecycle approach is our framework.

Stage 1: Process Design

During Stage 1, manufacturers define Critical Quality Attributes (CQAs) and Critical Process Parameters (CPPs) through risk assessments and experimental design. This phase establishes the scientific basis for monitoring and control strategies. For example, if a parameter’s variability is inherently low (e.g., clustering near the Limit of Quantification, or LOQ), this knowledge informs later decisions about CPV tools.

Stage 2: Process Qualification

Stage 2 confirms that the process, when operated within established parameters, consistently produces quality products. Data from this stage—such as process capability indices (Cpk/Ppk)—provide baseline metrics for CPV. For instance, a high Cpk (>2) for a parameter near LOQ signals that traditional control charts may be inappropriate due to limited variability.

Stage 3: Continued Process Verification

CPV methodology is defined by two pillars:

  1. Ongoing Monitoring: Continuous collection and analysis of CPP/CQA data.
  2. Adaptive Control: Adjustments to maintain process control, informed by statistical and risk-based insights.

Regulatory agencies require that CPV methodologies must be tailored to the process’s unique characteristics. For example, a parameter with data clustered near LOQ (as in the case study) demands a different approach than one with normal variability.

Selecting CPV Tools: Aligning with Data and Risk

The framework emphasizes that CPV tools must be scientifically justified, with selection criteria based on data suitability, risk criticality, and regulatory alignment.

Data Suitability Assessments

Data suitability assessments form the bedrock of effective Continuous Process Verification (CPV) programs, ensuring that monitoring tools align with the statistical and analytical realities of the process. These assessments are not merely technical exercises but strategic activities rooted in regulatory expectations, scientific rigor, and risk management. Below, we explore the three pillars of data suitability—distribution analysis, process capability evaluation, and analytical performance considerations—and their implications for CPV tool selection.

The foundation of any statistical monitoring system lies in understanding the distribution of the data being analyzed. Many traditional tools, such as control charts, assume that data follows a normal (Gaussian) distribution. This assumption underpins the calculation of control limits (e.g., ±3σ) and the interpretation of rule violations. To validate this assumption, manufacturers employ tests such as the Shapiro-Wilk test or Anderson-Darling test, which quantitatively assess normality. Visual tools like Q-Q plots or histograms complement these tests by providing intuitive insights into data skewness, kurtosis, or clustering.

When data deviates significantly from normality—common in parameters with values clustered near detection or quantification limits (e.g., LOQ)—the use of parametric tools like control charts becomes problematic. For instance, a parameter with 95% of its data below the LOQ may exhibit a left-skewed distribution, where the calculated mean and standard deviation are distorted by the analytical method’s noise rather than reflecting true process behavior. In such cases, traditional control charts generate misleading signals, such as Rule 1 violations (±3σ), which flag analytical variability rather than process shifts.

To address non-normal data, manufacturers must transition to non-parametric methods that do not rely on distributional assumptions. Tolerance intervals, which define ranges covering a specified proportion of the population with a given confidence level, are particularly useful for skewed datasets. For example, a 95/99 tolerance interval (95% of data within 99% confidence) can replace ±3σ limits for non-normal data, reducing false positives. Bootstrapping—a resampling technique—offers another alternative, enabling robust estimation of control limits without assuming normality.

Process Capability: Aligning Tools with Inherent Variability

Process capability indices, such as Cp and Cpk, quantify a parameter’s ability to meet specifications relative to its natural variability. A high Cp (>2) indicates that the process variability is small compared to the specification range, often resulting from tight manufacturing controls or robust product designs. While high capability is desirable for quality, it complicates CPV tool selection. For example, a parameter with a Cp of 3 and data clustered near the LOQ will exhibit minimal variability, rendering control charts ineffective. The narrow spread of data means that control limits shrink, increasing the likelihood of false alarms from minor analytical noise.

In such scenarios, traditional SPC tools like control charts lose their utility. Instead, manufacturers should adopt attribute-based monitoring or batch-wise trending. Attribute-based approaches classify results as pass/fail against predefined thresholds (e.g., LOQ breaches), simplifying signal interpretation. Batch-wise trending aggregates data across production lots, identifying shifts over time without overreacting to individual outliers. For instance, a manufacturer with a high-capability dissolution parameter might track the percentage of batches meeting dissolution criteria monthly, rather than plotting individual tablet results.

The FDA’s emphasis on risk-based monitoring further supports this shift. ICH Q9 guidelines encourage manufacturers to prioritize resources for high-risk parameters, allowing low-risk, high-capability parameters to be monitored with simpler tools. This approach reduces administrative burden while maintaining compliance.

Analytical Performance: Decoupling Noise from Process Signals

Parameters operating near analytical limits of detection (LOD) or quantification (LOQ) present unique challenges. At these extremes, measurement systems contribute significant variability, often overshadowing true process signals. For example, a purity assay with an LOQ of 0.1% may report values as “<0.1%” for 98% of batches, creating a dataset dominated by the analytical method’s imprecision. In such cases, failing to decouple analytical variability from process performance leads to misguided investigations and wasted resources.

To address this, manufacturers must isolate analytical variability through dedicated method monitoring programs. This involves:

  1. Analytical Method Validation: Rigorous characterization of precision, accuracy, and detection capabilities (e.g., determining the Practical Quantitation Limit, or PQL, which reflects real-world method performance).
  2. Separate Trending: Implementing control charts or capability analyses for the analytical method itself (e.g., monitoring LOQ stability across batches).
  3. Threshold-Based Alerts: Replacing statistical rules with binary triggers (e.g., investigating only results above LOQ).

For example, a manufacturer analyzing residual solvents near the LOQ might use detection capability indices to set action limits. If the analytical method’s variability (e.g., ±0.02% at LOQ) exceeds the process variability, threshold alerts focused on detecting values above 0.1% + 3σ_analytical would provide more meaningful signals than traditional control charts.

Integration with Regulatory Expectations

Regulatory agencies, including the FDA and EMA, mandate that CPV methodologies be “scientifically sound” and “statistically valid” (FDA 2011 Guidance). This requires documented justification for tool selection, including:

  • Normality Testing: Evidence that data distribution aligns with tool assumptions (e.g., Shapiro-Wilk test results).
  • Capability Analysis: Cp/Cpk values demonstrating the rationale for simplified monitoring.
  • Analytical Validation Data: Method performance metrics justifying decoupling strategies.

A 2024 FDA warning letter highlighted the consequences of neglecting these steps. A firm using control charts for non-normal dissolution data received a 483 observation for lacking statistical rationale, underscoring the need for rigor in data suitability assessments.

Case Study Application:
A manufacturer monitoring a CQA with 98% of data below LOQ initially used control charts, triggering frequent Rule 1 violations (±3σ). These violations reflected analytical noise, not process shifts. Transitioning to threshold-based alerts (investigating only LOQ breaches) reduced false positives by 72% while maintaining compliance.

Risk-Based Tool Selection

The ICH Q9 Quality Risk Management (QRM) framework provides a structured methodology for identifying, assessing, and controlling risks to pharmaceutical product quality, with a strong emphasis on aligning tool selection with the parameter’s impact on patient safety and product efficacy. Central to this approach is the principle that the rigor of risk management activities—including the selection of tools—should be proportionate to the criticality of the parameter under evaluation. This ensures resources are allocated efficiently, focusing on high-impact risks while avoiding overburdening low-risk areas.

Prioritizing Tools Through the Lens of Risk Impact

The ICH Q9 framework categorizes risks based on their potential to compromise product quality, guided by factors such as severity, detectability, and probability. Parameters with a direct impact on critical quality attributes (CQAs)—such as potency, purity, or sterility—are classified as high-risk and demand robust analytical tools. Conversely, parameters with minimal impact may require simpler methods. For example:

  • High-Impact Parameters: Use Failure Mode and Effects Analysis (FMEA) or Fault Tree Analysis (FTA) to dissect failure modes, root causes, and mitigation strategies.
  • Medium-Impact Parameters: Apply a tool such as a PHA.
  • Low-Impact Parameters: Utilize checklists or flowcharts for basic risk identification.

This tiered approach ensures that the complexity of the tool matches the parameter’s risk profile.

  1. Importance: The parameter’s criticality to patient safety or product efficacy.
  2. Complexity: The interdependencies of the system or process being assessed.
  3. Uncertainty: Gaps in knowledge about the parameter’s behavior or controls.

For instance, a high-purity active pharmaceutical ingredient (API) with narrow specification limits (high importance) and variable raw material inputs (high complexity) would necessitate FMEA to map failure modes across the supply chain. In contrast, a non-critical excipient with stable sourcing (low uncertainty) might only require a simplified risk ranking matrix.

Implementing a Risk-Based Approach

1. Assess Parameter Criticality

Begin by categorizing parameters based on their impact on CQAs, as defined during Stage 1 (Process Design) of the FDA’s validation lifecycle. Parameters are classified as:

  • Critical: Directly affecting safety/efficacy
  • Key: Influencing quality but not directly linked to safety
  • Non-Critical: No measurable impact on quality

This classification informs the depth of risk assessment and tool selection.

2. Select Tools Using the ICU Framework
  • Importance-Driven Tools: High-importance parameters warrant tools that quantify risk severity and detectability. FMEA is ideal for linking failure modes to patient harm, while Statistical Process Control (SPC) charts monitor real-time variability.
  • Complexity-Driven Tools: For multi-step processes (e.g., bioreactor operations), HACCP identifies critical control points, while Ishikawa diagrams map cause-effect relationships.
  • Uncertainty-Driven Tools: Parameters with limited historical data (e.g., novel drug formulations) benefit from Bayesian statistical models or Monte Carlo simulations to address knowledge gaps.
3. Document and Justify Tool Selection

Regulatory agencies require documented rationale for tool choices. For example, a firm using FMEA for a high-risk sterilization process must reference its ability to evaluate worst-case scenarios and prioritize mitigations. This documentation is typically embedded in Quality Risk Management (QRM) Plans or validation protocols.

Integration with Living Risk Assessments

Living risk assessments are dynamic, evolving documents that reflect real-time process knowledge and data. Unlike static, ad-hoc assessments, they are continually updated through:

1. Ongoing Data Integration

Data from Continual Process Verification (CPV)—such as trend analyses of CPPs/CQAs—feeds directly into living risk assessments. For example, shifts in fermentation yield detected via SPC charts trigger updates to bioreactor risk profiles, prompting tool adjustments (e.g., upgrading from checklists to FMEA).

2. Periodic Review Cycles

Living assessments undergo scheduled reviews (e.g., biannually) and event-driven updates (e.g., post-deviation). A QRM Master Plan, as outlined in ICH Q9(R1), orchestrates these reviews by mapping assessment frequencies to parameter criticality. High-impact parameters may be reviewed quarterly, while low-impact ones are assessed annually.

3. Cross-Functional Collaboration

Quality, manufacturing, and regulatory teams collaborate to interpret CPV data and update risk controls. For instance, a rise in particulate matter in vials (detected via CPV) prompts a joint review of filling line risk assessments, potentially revising tooling from HACCP to FMEA to address newly identified failure modes.

Regulatory Expectations and Compliance

Regulatory agencies requires documented justification for CPV tool selection, emphasizing:

  • Protocol Preapproval: CPV plans must be submitted during Stage 2, detailing tool selection criteria.
  • Change Control: Transitions between tools (e.g., SPC → thresholds) require risk assessments and documentation.
  • Training: Staff must be proficient in both traditional (e.g., Shewhart charts) and modern tools (e.g., AI).

A 2024 FDA warning letter cited a firm for using control charts on non-normal data without validation, underscoring the consequences of poor tool alignment.

A Framework for Adaptive Excellence

The FDA’s CPV framework is not prescriptive but principles-based, allowing flexibility in methodology and tool selection. Successful implementation hinges on:

  1. Science-Driven Decisions: Align tools with data characteristics and process capability.
  2. Risk-Based Prioritization: Focus resources on high-impact parameters.
  3. Regulatory Agility: Justify tool choices through documented risk assessments and lifecycle data.

CPV is a living system that must evolve alongside processes, leveraging tools that balance compliance with operational pragmatism. By anchoring decisions in the FDA’s lifecycle approach, manufacturers can transform CPV from a regulatory obligation into a strategic asset for quality excellence.

Beyond Documents: Embracing Data-Centric Thinking

We live in a fascinating inflection point in quality management, caught between traditional document-centric approaches and the emerging imperative for data-centricity needed to fully realize the potential of digital transformation. For several decades, we’ve been in a process that continues to accelerate through a technology transition that will deliver dramatic improvements in operations and quality. This transformation is driven by three interconnected trends: Pharma 4.0, the Rise of AI, and the shift from Documents to Data.

The History and Evolution of Documents in Quality Management

The history of document management can be traced back to the introduction of the file cabinet in the late 1800s, providing a structured way to organize paper records. Quality management systems have even deeper roots, extending back to medieval Europe when craftsman guilds developed strict guidelines for product inspection. These early approaches established the document as the fundamental unit of quality management—a paradigm that persisted through industrialization and into the modern era.

The document landscape took a dramatic turn in the 1980s with the increasing availability of computer technology. The development of servers allowed organizations to store documents electronically in centralized mainframes, marking the beginning of electronic document management systems (eDMS). Meanwhile, scanners enabled conversion of paper documents to digital format, and the rise of personal computers gave businesses the ability to create and store documents directly in digital form.

In traditional quality systems, documents serve as the backbone of quality operations and fall into three primary categories: functional documents (providing instructions), records (providing evidence), and reports (providing specific information). This document trinity has established our fundamental conception of what a quality system is and how it operates—a conception deeply influenced by the physical limitations of paper.

Photo by Andrea Piacquadio on Pexels.com

Breaking the Paper Paradigm: Limitations of Document-Centric Thinking

The Paper-on-Glass Dilemma

The maturation path for quality systems typically progresses mainly from paper execution to paper-on-glass to end-to-end integration and execution. However, most life sciences organizations remain stuck in the paper-on-glass phase of their digital evolution. They still rely on the paper-on-glass data capture method, where digital records are generated that closely resemble the structure and layout of a paper-based workflow. In general, the wider industry is still reluctant to transition away from paper-like records out of process familiarity and uncertainty of regulatory scrutiny.

Paper-on-glass systems present several specific limitations that hamper digital transformation:

  1. Constrained design flexibility: Data capture is limited by the digital record’s design, which often mimics previous paper formats rather than leveraging digital capabilities. A pharmaceutical batch record system that meticulously replicates its paper predecessor inherently limits the system’s ability to analyze data across batches or integrate with other quality processes.
  2. Manual data extraction requirements: When data is trapped in digital documents structured like paper forms, it remains difficult to extract. This means data from paper-on-glass records typically requires manual intervention, substantially reducing data utilization effectiveness.
  3. Elevated error rates: Many paper-on-glass implementations lack sufficient logic and controls to prevent avoidable data capture errors that would be eliminated in truly digital systems. Without data validation rules built into the capture process, quality systems continue to allow errors that must be caught through manual review.
  4. Unnecessary artifacts: These approaches generate records with inflated sizes and unnecessary elements, such as cover pages that serve no functional purpose in a digital environment but persist because they were needed in paper systems.
  5. Cumbersome validation: Content must be fully controlled and managed manually, with none of the advantages gained from data-centric validation approaches.

Broader Digital Transformation Struggles

Pharmaceutical and medical device companies must navigate complex regulatory requirements while implementing new digital systems, leading to stalling initiatives. Regulatory agencies have historically relied on document-based submissions and evidence, reinforcing document-centric mindsets even as technology evolves.

Beyond Paper-on-Glass: What Comes Next?

What comes after paper-on-glass? The natural evolution leads to end-to-end integration and execution systems that transcend document limitations and focus on data as the primary asset. This evolution isn’t merely about eliminating paper—it’s about reconceptualizing how we think about the information that drives quality management.

In fully integrated execution systems, functional documents and records become unified. Instead of having separate systems for managing SOPs and for capturing execution data, these systems bring process definitions and execution together. This approach drives up reliability and drives out error, but requires fundamentally different thinking about how we structure information.

A prime example of moving beyond paper-on-glass can be seen in advanced Manufacturing Execution Systems (MES) for pharmaceutical production. Rather than simply digitizing batch records, modern MES platforms incorporate AI, IIoT, and Pharma 4.0 principles to provide the right data, at the right time, to the right team. These systems deliver meaningful and actionable information, moving from merely connecting devices to optimizing manufacturing and quality processes.

AI-Powered Documentation: Breaking Through with Intelligent Systems

A dramatic example of breaking free from document constraints comes from Novo Nordisk’s use of AI to draft clinical study reports. The company has taken a leap forward in pharmaceutical documentation, putting AI to work where human writers once toiled for weeks. The Danish pharmaceutical company is using Claude, an AI model by Anthropic, to draft clinical study reports—documents that can stretch hundreds of pages.

This represents a fundamental shift in how we think about documents. Rather than having humans arrange data into documents manually, we can now use AI to generate high-quality documents directly from structured data sources. The document becomes an output—a view of the underlying data—rather than the primary artifact of the quality system.

Data Requirements: The Foundation of Modern Quality Systems in Life Sciences

Shifting from document-centric to data-centric thinking requires understanding that documents are merely vessels for data—and it’s the data that delivers value. When we focus on data requirements instead of document types, we unlock new possibilities for quality management in regulated environments.

At its core, any quality process is a way to realize a set of requirements. These requirements come from external sources (regulations, standards) and internal needs (efficiency, business objectives). Meeting these requirements involves integrating people, procedures, principles, and technology. By focusing on the underlying data requirements rather than the documents that traditionally housed them, life sciences organizations can create more flexible, responsive quality systems.

ICH Q9(R1) emphasizes that knowledge is fundamental to effective risk management, stating that “QRM is part of building knowledge and understanding risk scenarios, so that appropriate risk control can be decided upon for use during the commercial manufacturing phase.” We need to recognize the inverse relationship between knowledge and uncertainty in risk assessment. As ICH Q9(R1) notes, uncertainty may be reduced “via effective knowledge management, which enables accumulated and new information (both internal and external) to be used to support risk-based decisions throughout the product lifecycle.”

This approach helps us ensure that our tools take into account that our processes are living and breathing, our tools should take that into account. This is all about moving to a process repository and away from a document mindset.

Documents as Data Views: Transforming Quality System Architecture

When we shift our paradigm to view documents as outputs of data rather than primary artifacts, we fundamentally transform how quality systems operate. This perspective enables a more dynamic, interconnected approach to quality management that transcends the limitations of traditional document-centric systems.

Breaking the Document-Data Paradigm

Traditionally, life sciences organizations have thought of documents as containers that hold data. This subtle but profound perspective has shaped how we design quality systems, leading to siloed applications and fragmented information. When we invert this relationship—seeing data as the foundation and documents as configurable views of that data—we unlock powerful capabilities that better serve the needs of modern life sciences organizations.

The Benefits of Data-First, Document-Second Architecture

When documents become outputs—dynamic views of underlying data—rather than the primary focus of quality systems, several transformative benefits emerge.

First, data becomes reusable across multiple contexts. The same underlying data can generate different documents for different audiences or purposes without duplication or inconsistency. For example, clinical trial data might generate regulatory submission documents, internal analysis reports, and patient communications—all from a single source of truth.

Second, changes to data automatically propagate to all relevant documents. In a document-first system, updating information requires manually changing each affected document, creating opportunities for errors and inconsistencies. In a data-first system, updating the central data repository automatically refreshes all document views, ensuring consistency across the quality ecosystem.

Third, this approach enables more sophisticated analytics and insights. When data exists independently of documents, it can be more easily aggregated, analyzed, and visualized across processes.

In this architecture, quality management systems must be designed with robust data models at their core, with document generation capabilities built on top. This might include:

  1. A unified data layer that captures all quality-related information
  2. Flexible document templates that can be populated with data from this layer
  3. Dynamic relationships between data entities that reflect real-world connections between quality processes
  4. Powerful query capabilities that enable users to create custom views of data based on specific needs

The resulting system treats documents as what they truly are: snapshots of data formatted for human consumption at specific moments in time, rather than the authoritative system of record.

Electronic Quality Management Systems (eQMS): Beyond Paper-on-Glass

Electronic Quality Management Systems have been adopted widely across life sciences, but many implementations fail to realize their full potential due to document-centric thinking. When implementing an eQMS, organizations often attempt to replicate their existing document-based processes in digital form rather than reconceptualizing their approach around data.

Current Limitations of eQMS Implementations

Document-centric eQMS systems treat functional documents as discrete objects, much as they were conceived decades ago. They still think it terms of SOPs being discrete documents. They structure workflows, such as non-conformances, CAPAs, change controls, and design controls, with artificial gaps between these interconnected processes. When a manufacturing non-conformance impacts a design control, which then requires a change control, the connections between these events often remain manual and error-prone.

This approach leads to compartmentalized technology solutions. Organizations believe they can solve quality challenges through single applications: an eQMS will solve problems in quality events, a LIMS for the lab, an MES for manufacturing. These isolated systems may digitize documents but fail to integrate the underlying data.

Data-Centric eQMS Approaches

We are in the process of reimagining eQMS as data platforms rather than document repositories. A data-centric eQMS connects quality events, training records, change controls, and other quality processes through a unified data model. This approach enables more effective risk management, root cause analysis, and continuous improvement.

For instance, when a deviation is recorded in a data-centric system, it automatically connects to relevant product specifications, equipment records, training data, and previous similar events. This comprehensive view enables more effective investigation and corrective action than reviewing isolated documents.

Looking ahead, AI-powered eQMS solutions will increasingly incorporate predictive analytics to identify potential quality issues before they occur. By analyzing patterns in historical quality data, these systems can alert quality teams to emerging risks and recommend preventive actions.

Manufacturing Execution Systems (MES): Breaking Down Production Data Silos

Manufacturing Execution Systems face similar challenges in breaking away from document-centric paradigms. Common MES implementation challenges highlight the limitations of traditional approaches and the potential benefits of data-centric thinking.

MES in the Pharmaceutical Industry

Manufacturing Execution Systems (MES) aggregate a number of the technologies deployed at the MOM level. MES as a technology has been successfully deployed within the pharmaceutical industry and the technology associated with MES has matured positively and is fast becoming a recognized best practice across all life science regulated industries. This is borne out by the fact that green-field manufacturing sites are starting with an MES in place—paperless manufacturing from day one.

The amount of IT applied to an MES project is dependent on business needs. At a minimum, an MES should strive to replace paper batch records with an Electronic Batch Record (EBR). Other functionality that can be applied includes automated material weighing and dispensing, and integration to ERP systems; therefore, helping the optimization of inventory levels and production planning.

Beyond Paper-on-Glass in Manufacturing

In pharmaceutical manufacturing, paper batch records have traditionally documented each step of the production process. Early electronic batch record systems simply digitized these paper forms, creating “paper-on-glass” implementations that failed to leverage the full potential of digital technology.

Advanced Manufacturing Execution Systems are moving beyond this limitation by focusing on data rather than documents. Rather than digitizing batch records, these systems capture manufacturing data directly, using sensors, automated equipment, and operator inputs. This approach enables real-time monitoring, statistical process control, and predictive quality management.

An example of a modern MES solution fully compliant with Pharma 4.0 principles is the Tempo platform developed by Apprentice. It is a complete manufacturing system designed for life sciences companies that leverages cloud technology to provide real-time visibility and control over production processes. The platform combines MES, EBR, LES (Laboratory Execution System), and AR (Augmented Reality) capabilities to create a comprehensive solution that supports complex manufacturing workflows.

Electronic Validation Management Systems (eVMS): Transforming Validation Practices

Validation represents a critical intersection of quality management and compliance in life sciences. The transition from document-centric to data-centric approaches is particularly challenging—and potentially rewarding—in this domain.

Current Validation Challenges

Traditional validation approaches face several limitations that highlight the problems with document-centric thinking:

  1. Integration Issues: Many Digital Validation Tools (DVTs) remain isolated from Enterprise Document Management Systems (eDMS). The eDMS system is typically the first step where vendor engineering data is imported into a client system. However, this data is rarely validated once—typically departments repeat this validation step multiple times, creating unnecessary duplication.
  2. Validation for AI Systems: Traditional validation approaches are inadequate for AI-enabled systems. Traditional validation processes are geared towards demonstrating that products and processes will always achieve expected results. However, in the digital “intellectual” eQMS world, organizations will, at some point, experience the unexpected.
  3. Continuous Compliance: A significant challenge is remaining in compliance continuously during any digital eQMS-initiated change because digital systems can update frequently and quickly. This rapid pace of change conflicts with traditional validation approaches that assume relative stability in systems once validated.

Data-Centric Validation Solutions

Modern electronic Validation Management Systems (eVMS) solutions exemplify the shift toward data-centric validation management. These platforms introduce AI capabilities that provide intelligent insights across validation activities to unlock unprecedented operational efficiency. Their risk-based approach promotes critical thinking, automates assurance activities, and fosters deeper regulatory alignment.

We need to strive to leverage the digitization and automation of pharmaceutical manufacturing to link real-time data with both the quality risk management system and control strategies. This connection enables continuous visibility into whether processes are in a state of control.

The 11 Axes of Quality 4.0

LNS Research has identified 11 key components or “axes” of the Quality 4.0 framework that organizations must understand to successfully implement modern quality management:

  1. Data: In the quality sphere, data has always been vital for improvement. However, most organizations still face lags in data collection, analysis, and decision-making processes. Quality 4.0 focuses on rapid, structured collection of data from various sources to enable informed and agile decision-making.
  2. Analytics: Traditional quality metrics are primarily descriptive. Quality 4.0 enhances these with predictive and prescriptive analytics that can anticipate quality issues before they occur and recommend optimal actions.
  3. Connectivity: Quality 4.0 emphasizes the connection between operating technology (OT) used in manufacturing environments and information technology (IT) systems including ERP, eQMS, and PLM. This connectivity enables real-time feedback loops that enhance quality processes.
  4. Collaboration: Breaking down silos between departments is essential for Quality 4.0. This requires not just technological integration but cultural changes that foster teamwork and shared quality ownership.
  5. App Development: Quality 4.0 leverages modern application development approaches, including cloud platforms, microservices, and low/no-code solutions to rapidly deploy and update quality applications.
  6. Scalability: Modern quality systems must scale efficiently across global operations while maintaining consistency and compliance.
  7. Management Systems: Quality 4.0 integrates with broader management systems to ensure quality is embedded throughout the organization.
  8. Compliance: While traditional quality focused on meeting minimum requirements, Quality 4.0 takes a risk-based approach to compliance that is more proactive and efficient.
  9. Culture: Quality 4.0 requires a cultural shift that embraces digital transformation, continuous improvement, and data-driven decision-making.
  10. Leadership: Executive support and vision are critical for successful Quality 4.0 implementation.
  11. Competency: New skills and capabilities are needed for Quality 4.0, requiring significant investment in training and workforce development.

The Future of Quality Management in Life Sciences

The evolution from document-centric to data-centric quality management represents a fundamental shift in how life sciences organizations approach quality. While documents will continue to play a role, their purpose and primacy are changing in an increasingly data-driven world.

By focusing on data requirements rather than document types, organizations can build more flexible, responsive, and effective quality systems that truly deliver on the promise of digital transformation. This approach enables life sciences companies to maintain compliance while improving efficiency, enhancing product quality, and ultimately delivering better outcomes for patients.

The journey from documents to data is not merely a technical transition but a strategic evolution that will define quality management for decades to come. As AI, machine learning, and process automation converge with quality management, the organizations that successfully embrace data-centricity will gain significant competitive advantages through improved agility, deeper insights, and more effective compliance in an increasingly complex regulatory landscape.

The paper may go, but the document—reimagined as structured data that enables insight and action—will continue to serve as the foundation of effective quality management. The key is recognizing that documents are vessels for data, and it’s the data that drives value in the organization.

Building a Data-Driven Culture: Empowering Everyone for Success

Data-driven decision-making is an essential component for achieving organizational success. Simply adopting the latest technologies or bringing on board data scientists is not enough to foster a genuinely data-driven culture. Instead, it requires a comprehensive strategy that involves every level of the organization.

This holistic approach emphasizes the importance of empowering all employees—regardless of their role or technical expertise—to effectively utilize data in their daily tasks and decision-making processes. It involves providing training and resources that enhance data literacy, enabling individuals to understand and interpret data insights meaningfully. Moreover, organizations should cultivate an environment that encourages curiosity and critical thinking around data. This might include promoting cross-departmental collaboration where teams can share insights and best practices regarding data use. Leadership plays a vital role in this transformation by modeling data-driven behaviors and championing a culture that values data as a critical asset. By prioritizing data accessibility and encouraging open dialogue about data analytics, organizations can truly empower their workforce to harness the potential of data, driving informed decisions that contribute to overall success and innovation.

The Three Pillars of Data Empowerment

To build a robust data-driven culture, leaders must focus on three key areas of readiness:

Data Readiness: The Foundation of Informed Decision-Making

Data readiness ensures that high-quality, relevant data is accessible to the right people at the right time. This involves:

  • Implementing robust data governance policies
  • Investing in data management platforms
  • Ensuring data quality and consistency
  • Providing secure and streamlined access to data

By establishing a strong foundation of data readiness, organizations can foster trust in their data and encourage its use across all levels of the company.

Analytical Readiness: Cultivating Data Literacy

Analytical readiness is a crucial component of building a data-driven culture. While access to data is essential, it’s only the first step in the journey. To truly harness the power of data, employees need to develop the skills and knowledge necessary to interpret and derive meaningful insights. Let’s delve deeper into the key aspects of analytical readiness:

Comprehensive Training on Data Analysis Tools

Organizations must invest in robust training programs that cover a wide range of data analysis tools and techniques. This training should be tailored to different skill levels and job functions, ensuring that everyone from entry-level employees to senior executives can effectively work with data.

  • Basic data literacy: Start with foundational courses that cover data types, basic statistical concepts, and data visualization principles.
  • Tool-specific training: Provide hands-on training for popular data analysis tools and the specialized business intelligence platforms that are adopted.
  • Advanced analytics: Offer more advanced courses on machine learning, predictive modeling, and data mining for those who require deeper analytical skills.

Developing Critical Thinking Skills for Data Interpretation

Raw data alone doesn’t provide value; it’s the interpretation that matters. Employees need to develop critical thinking skills to effectively analyze and draw meaningful conclusions from data.

  • Data context: Teach employees to consider the broader context in which data is collected and used, including potential biases and limitations.
  • Statistical reasoning: Enhance understanding of statistical concepts to help employees distinguish between correlation and causation, and to recognize the significance of findings.
  • Hypothesis testing: Encourage employees to formulate hypotheses and use data to test and refine their assumptions.
  • Scenario analysis: Train staff to consider multiple interpretations of data and explore various scenarios before drawing conclusions.

Encouraging a Culture of Curiosity and Continuous Learning

A data-driven culture thrives on curiosity and a commitment to ongoing learning. Organizations should foster an environment that encourages employees to explore data and continuously expand their analytical skills.

  • Data exploration time: Allocate dedicated time for employees to explore datasets relevant to their work, encouraging them to uncover new insights.
  • Learning resources: Provide access to online courses, webinars, and industry conferences to keep employees updated on the latest data analysis trends and techniques.
  • Internal knowledge sharing: Organize regular “lunch and learn” sessions or internal workshops where employees can share their data analysis experiences and insights.
  • Data challenges: Host internal competitions or hackathons that challenge employees to solve real business problems using data.

Fostering Cross-Functional Collaboration to Share Data Insights

Data-driven insights become more powerful when shared across different departments and teams. Encouraging cross-functional collaboration can lead to more comprehensive and innovative solutions.

  • Interdepartmental data projects: Initiate projects that require collaboration between different teams, combining diverse datasets and perspectives.
  • Data visualization dashboards: Implement shared dashboards that allow teams to view and interact with data from various departments.
  • Regular insight-sharing meetings: Schedule cross-functional meetings where teams can present their data findings and discuss potential implications for other areas of the business.
  • Data ambassadors: Designate data champions within each department to facilitate the sharing of insights and best practices across the organization.

By investing in these aspects of analytical readiness, organizations empower their employees to make data-informed decisions confidently and effectively. This not only improves the quality of decision-making but also fosters a culture of innovation and continuous improvement. As employees become more proficient in working with data, they’re better equipped to identify opportunities, solve complex problems, and drive the organization forward in an increasingly data-centric business landscape.

Infrastructure Readiness: Enabling Seamless Data Operations

To support a data-driven culture, organizations must have the right technological infrastructure in place. This includes:

  • Implementing scalable hardware solutions
  • Adopting user-friendly software for data analysis and visualization
  • Ensuring robust cybersecurity measures to protect sensitive data
  • Providing adequate computing power for complex data processing
  • Build a clear and implementable qualification methodology around data solutions

With the right infrastructure, employees can work with data efficiently and securely, regardless of their role or department.

The Path to a Data-Driven Culture

Building a data-driven culture is an ongoing process that requires commitment from leadership and active participation from all employees. Here are some key steps to consider:

  1. Lead by example: Executives should actively use data in their decision-making processes and communicate the importance of data-driven approaches.
  2. Democratize data access: Break down data silos and provide user-friendly tools that allow employees at all levels to access and analyze relevant data.
  3. Invest in training and education: Develop comprehensive data literacy programs that cater to different skill levels and job functions.
  4. Encourage experimentation: Create a safe environment where employees feel comfortable using data to test hypotheses and drive innovation.
  5. Celebrate data-driven successes: Recognize and reward individuals and teams who effectively use data to drive positive outcomes for the organization.

Conclusion

To build a truly data-driven culture, leaders must take everyone along on the journey. By focusing on data readiness, analytical readiness, and infrastructure readiness, organizations can empower their employees to harness the full potential of data. This holistic approach not only improves decision-making but also fosters innovation, drives efficiency, and ultimately leads to better business outcomes.

Remember, building a data-driven culture is not a one-time effort but a continuous process of improvement and adaptation. By consistently investing in these three areas of readiness, organizations can create a sustainable competitive advantage in today’s data-centric business landscape.

Data and a Good Data Culture

I often joke that as a biotech company employee I am primarily responsible for the manufacture of data (and water) first and foremost, and as a result we get a byproduct of a pharmaceutical drugs.

Many of us face challenges within organizations when it comes to effectively managing data. There tends to be a prevailing mindset that views data handling as a distinct activity, often relegated to the responsibility of someone else, rather than recognizing it as an integral part of everyone’s role. This separation can lead to misunderstandings and missed opportunities for utilizing data to its fullest potential.

Many organizations suffer some multifaceted challenges around data management:

  1. Lack of ownership: When data is seen as “someone else’s job,” it often falls through the cracks.
  2. Inconsistent quality: Without a unified approach, data quality can vary widely across departments.
  3. Missed insights: Siloed data management can result in missed opportunities for valuable insights.
  4. Inefficient processes: Disconnected data handling often leads to duplicated efforts and wasted resources.

Integrate Data into Daily Work

  1. Make data part of job descriptions: Clearly define data-related responsibilities for each role, emphasizing how data contributes to overall job performance.
  2. Provide context: Help employees understand how their data-related tasks directly impact business outcomes and decision-making processes.
  3. Encourage data-driven decision making: Train employees to use data in their daily work, from small decisions to larger strategic choices.

We want to strive to ask four questions.

  1. UnderstandingDo people understand that they are data creators and how the data they create fits into the bigger picture?
  2. Empowerment: Are there mechanisms for people to voice concerns, suggest potential improvements, and make changes? Do you provide psychological safety so they do so without fear?
  3. AccountabilityDo people feel pride of ownership and take on responsibly to create, obtain, and put to work data that supports the organization’s mission?
  4. CollaborationDo people see themselves as customers of data others create, with the right and responsibility to explain what they need and help creators craft solutions for the good of all involved?

Foster a Data-Driven Culture

Fostering a data-driven culture is essential for organizations seeking to leverage the full potential of their data assets. This cultural shift requires a multi-faceted approach that starts at the top and permeates throughout the entire organization.

Leadership by example is crucial in establishing a data-driven culture. Managers and executives must actively incorporate data into their decision-making processes and discussions. By consistently referencing data in meetings, presentations, and communications, leaders demonstrate the value they place on data-driven insights. This behavior sets the tone for the entire organization, encouraging employees at all levels to adopt a similar approach. When leaders ask data-informed questions and base their decisions on factual evidence, it reinforces the importance of data literacy and analytical thinking across the company.

Continuous learning is another vital component of a data-driven culture. Organizations should invest in regular training sessions that enhance data literacy and proficiency with relevant analysis tools. These educational programs should be tailored to each role within the company, ensuring that employees can apply data skills directly to their specific responsibilities. By providing ongoing learning opportunities, companies empower their workforce to make informed decisions and contribute meaningfully to data-driven initiatives. This investment in employee development not only improves individual performance but also strengthens the organization’s overall analytical capabilities.

Creating effective feedback loops is essential for refining and improving data processes over time. Organizations should establish systems that allow employees to provide input on data-related practices and suggest enhancements. This two-way communication fosters a sense of ownership and engagement among staff, encouraging them to actively participate in the data-driven culture. By valuing employee feedback, companies can identify bottlenecks, streamline processes, and uncover innovative ways to utilize data more effectively. These feedback mechanisms also help in closing the loop between data insights and actionable outcomes, ensuring that the organization continually evolves its data practices to meet changing needs and challenges.

Build Data as a Core Principle

  1. Focus on quality: Emphasize the importance of data quality to the mission of the organization
  2. Continuous improvement: Encourage ongoing refinement of data processes,.
  3. Pride in workmanship: Foster a sense of ownership and pride in data-related tasks, .
  4. Break down barriers: Promote cross-departmental collaboration on data initiatives and eliminate silos.
  5. Drive out fear: Create a safe environment for employees to report data issues or inconsistencies without fear of reprisal.

By implementing these strategies, organizations can effectively tie data to employees’ daily work and create a robust data culture that enhances overall performance and decision-making capabilities.