The Hidden Contamination Hazards: What the Catalent Warning Letter Reveals About Systemic Aseptic Processing Failures

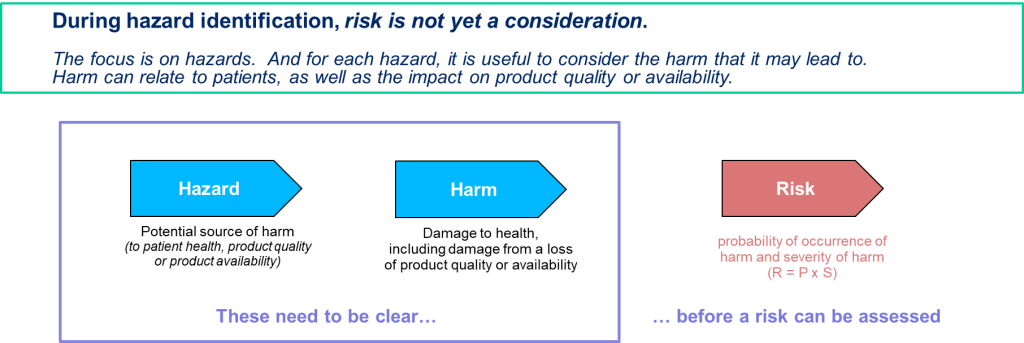
The November 2025 FDA Warning Letter to Catalent Indiana, LLC reads like an autopsy report—a detailed dissection of how contamination hazards aren’t discovered but rather engineered into aseptic operations through a constellation of decisions that individually appear defensible yet collectively create what I’ve previously termed the “zemblanity field” in pharmaceutical quality. Section 2, addressing failures under 21 CFR 211.113(b), exposes contamination hazards that didn’t emerge from random misfortune but from deliberate choices about decontamination strategies, sampling methodologies, intervention protocols, and investigation rigor.​

What makes this warning letter particularly instructive isn’t the presence of contamination events—every aseptic facility battles microbial ingress—but rather the systematic architectural failures that allowed contamination hazards to persist unrecognized, uninvestigated, and unmitigated despite multiple warning signals spanning more than 20 deviations and customer complaints. The FDA’s critique centers on three interconnected contamination hazard categories: VHP decontamination failures involving occluded surfaces, inadequate environmental monitoring methods that substituted convenience for detection capability, and intervention risk assessments that ignored documented contamination routes.

For those of us responsible for contamination control in aseptic manufacturing, this warning letter demands we ask uncomfortable questions: How many of our VHP cycles are validated against surfaces that remain functionally occluded? How often have we chosen contact plates over swabs because they’re faster, not because they’re more effective? When was the last time we terminated a media fill and treated it with the investigative rigor of a batch contamination event?

The Occluded Surface Problem: When Decontamination Becomes Theatre

The FDA’s identification of occluded surfaces as contamination sources during VHP decontamination represents a failure mode I’ve observed with troubling frequency across aseptic facilities. The fundamental physics are unambiguous: vaporized hydrogen peroxide achieves sporicidal efficacy through direct surface contact at validated concentration-time profiles. Any surface the vapor doesn’t contact—or contacts at insufficient concentration—remains a potential contamination reservoir regardless of cycle completion indicators showing “successful” decontamination.​

The Catalent situation involved two distinct occluded surface scenarios, each revealing different architectural failures in contamination hazard assessment. First, equipment surfaces occluded during VHP decontamination that subsequently became contamination sources during atypical interventions involving equipment changes. The FDA noted that “the most probable root cause” of an environmental monitoring failure was equipment surfaces occluded during VHP decontamination, with contamination occurring during execution of an atypical intervention involving changes to components integral to stopper seating.​

This finding exposes a conceptual error I frequently encounter: treating VHP decontamination as a universal solution that overcomes design deficiencies rather than as a validated process with specific performance boundaries. The Catalent facility’s own risk assessments advised against interventions that could disturb potentially occluded surfaces, yet these interventions continued—creating the precise contamination pathway their risk assessments identified as unacceptable.​

The second occluded surface scenario involved wrapped components within the filling line where insufficient VHP exposure allowed potential contamination. The FDA cited “occluded surfaces on wrapped [components] within the [equipment] as the potential cause of contamination”. This represents a validation failure: if wrapping materials prevent adequate VHP penetration, either the wrapping must be eliminated, the decontamination method must change, or these surfaces must be treated through alternative validated processes.​

The literature on VHP decontamination is explicit about occluded surface risks. As Sandle notes, surfaces must be “designed and installed so that operations, maintenance, and repairs can be performed outside the cleanroom” and where unavoidable, “all surfaces needing decontaminated” must be explicitly identified. The PIC/S guidance is similarly unambiguous: “Continuously occluded surfaces do not qualify for such trials as they cannot be exposed to the process and should have been eliminated”. Yet facilities continue to validate VHP cycles that demonstrate biological indicator kill on readily accessible flat coupons while ignoring the complex geometries, wrapped items, and recessed surfaces actually present in their filling environments.

What does a robust approach to occluded surface assessment look like? Based on the regulatory expectations and technical literature, facilities should:

Conduct comprehensive occluded surface mapping during design qualification. Every component introduced into VHP-decontaminated spaces must undergo geometric analysis to identify surfaces that may not receive adequate vapor exposure. This includes crevices, threaded connections, wrapped items, hollow spaces, and any surface shadowed by another object. The mapping should document not just that surfaces exist but their accessibility to vapor flow based on the specific VHP distribution characteristics of the equipment.​

Validate VHP distribution using chemical and biological indicators placed on identified occluded surfaces. Flat coupon placement on readily accessible horizontal surfaces tells you nothing about vapor penetration into wrapped components or recessed geometries. Biological indicators should be positioned specifically where vapor exposure is questionable—inside wrapped items, within threaded connections, under equipment flanges, in dead-legs of transfer lines. If biological indicators in these locations don’t achieve the validated log reduction, the surfaces are occluded and require design modification or alternative decontamination methods.​

Establish clear intervention protocols that distinguish between “sterile-to-sterile” and “potentially contaminated” surface contact. The Catalent finding reveals that atypical interventions involving equipment changes exposed the Grade A environment to surfaces not reliably exposed to VHP. Intervention risk assessments must explicitly categorize whether the intervention involves only VHP-validated surfaces or introduces components from potentially occluded areas. The latter category demands heightened controls: localized Grade A air protection, pre-intervention surface swabbing and disinfection, real-time environmental monitoring during the intervention, and post-intervention investigation if environmental monitoring shows any deviation.​

Implement post-decontamination surface monitoring that targets historically occluded locations. If your facility has identified occluded surfaces that cannot be designed out, these become critical sampling locations for post-VHP environmental monitoring. Trending of these specific locations provides early detection of decontamination effectiveness degradation before contamination reaches product-contact surfaces.

The FDA’s remediation demand is appropriately comprehensive: “a review of VHP exposure to decontamination methods as well as permitted interventions, including a retrospective historical review of routine interventions and atypical interventions to determine their risks, a comprehensive identification of locations that are not reliably exposed to VHP decontamination (i.e., occluded surfaces), your plan to reduce occluded surfaces where feasible, review of currently permitted interventions and elimination of high-risk interventions entailing equipment manipulations during production campaigns that expose the ISO 5 environment to surfaces not exposed to a validated decontamination process, and redesign of any intervention that poses an unacceptable contamination risk”.​

This remediation framework represents best practice for any aseptic facility using VHP decontamination. The occluded surface problem isn’t limited to Catalent—it’s an industry-wide vulnerability wherever VHP validation focuses on demonstrating sporicidal activity under ideal conditions rather than confirming adequate vapor contact across all surfaces within the validated space.

Contact Plates Versus Swabs: The Detection Capability Trade-Off

The FDA’s critique of Catalent’s environmental monitoring methodology exposes a decision I’ve challenged repeatedly throughout my career: the use of contact plates for sampling irregular, product-contact surfaces in Grade A environments. The technical limitations are well-established, yet contact plates persist because they’re faster and operationally simpler—prioritizing workflow convenience over contamination detection capability.

The specific Catalent deficiency involved sampling filling line components using “contact plate, sampling [surfaces] with one sweeping sampling motion.” The FDA identified two fundamental inadequacies: “With this method, you are unable to attribute contamination events to specific [locations]” and “your firm’s use of contact plates is not as effective as using swab methods”. These limitations aren’t novel discoveries—they’re inherent to contact plate methodology and have been documented in the microbiological literature for decades.​

Contact plates—rigid agar surfaces pressed against the area to be sampled—were designed for flat, smooth surfaces where complete agar-to-surface contact can be achieved with uniform pressure. They perform adequately on stainless steel benchtops, isolator walls, and other horizontal surfaces. But filling line components—particularly those identified in the warning letter—present complex geometries: curved surfaces, corners, recesses, and irregular topographies where rigid agar cannot conform to achieve complete surface contact.

The microbial recovery implications are significant. When a contact plate fails to achieve complete surface contact, microorganisms in uncontacted areas remain unsampled. The result is a false-negative environmental monitoring reading that suggests contamination control while actual contamination persists undetected. Worse, the “sweeping sampling motion” described in the warning letter—moving a single contact plate across multiple locations—creates the additional problem the FDA identified: inability to attribute any recovered contamination to a specific surface. Was the contamination on the first component contacted? The third? Somewhere in between? This sampling approach provides data too imprecise for meaningful contamination source investigation.

The alternative—swab sampling—addresses both deficiencies. Swabs conform to irregular surfaces, accessing corners, recesses, and curved topographies that contact plates cannot reach. Swabs can be applied to specific, discrete locations, enabling precise attribution of any contamination recovered to a particular surface. The trade-off is operational: swab sampling requires more time, involves additional manipulative steps within Grade A environments, and demands different operator technique validation.​

Yet the Catalent warning letter makes clear that this operational inconvenience doesn’t justify compromised detection capability for critical product-contact surfaces. The FDA’s expectation—acknowledged in Catalent’s response—is swab sampling “to replace use of contact plates to sample irregular surfaces”. This represents a fundamental shift from convenience-optimized to detection-optimized environmental monitoring.​

What should a risk-based surface sampling strategy look like? The differentiation should be based on surface geometry and criticality:

Contact plates remain appropriate for flat, smooth, readily accessible surfaces where complete agar contact can be verified and where contamination risk is lower (Grade B floors, isolator walls, equipment external surfaces). The speed and simplicity advantages of contact plates justify their continued use in these applications.

Swab sampling should be mandatory for product-contact surfaces, irregular geometries, recessed areas, and any location where contact plate conformity is questionable. This includes filling needles, stopper bowls, vial transport mechanisms, crimping heads, and the specific equipment components cited in the Catalent letter. The additional time required for swab sampling is trivial compared to the contamination risk from inadequate monitoring.

Surface sampling protocols must specify the exact location sampled, not general equipment categories. Rather than “sample stopper bowl,” protocols should identify “internal rim of stopper bowl,” “external base of stopper bowl,” “stopper agitation mechanism interior surfaces.” This specificity enables contamination source attribution during investigations and ensures sampling actually reaches the highest-risk surfaces.

Swab technique must be validated to ensure consistent recovery from target surfaces. Simply switching from contact plates to swabs doesn’t guarantee improved detection unless swab technique—pressure applied, surface area contacted, swab saturation, transfer to growth media—is standardized and demonstrated to achieve adequate microbial recovery from the specific materials and geometries being sampled.​

The EU GMP Annex 1 and FDA guidance documents emphasize detection capability over convenience in environmental monitoring. The expectation isn’t perfect contamination prevention—that’s impossible in aseptic processing—but rather monitoring systems sensitive enough to detect contamination events when they occur, enabling investigation and corrective action before product impact. Contact plates on irregular surfaces fail this standard by design, not because of operator error or inadequate validation but because the fundamental methodology cannot access the surfaces requiring monitoring.​

The Intervention Paradox: When Risk Assessments Identify Hazards But Operations Ignore Them

Perhaps the most troubling element of the Catalent contamination hazards section isn’t the presence of occluded surfaces or inadequate sampling methods but rather the intervention management failure that reveals a disconnect between risk assessment and operational decision-making. Catalent’s risk assessments explicitly “advised against interventions that can disturb potentially occluded surfaces,” yet these high-risk interventions continued during production campaigns.​

This represents what I’ve termed “investigation theatre” in previous posts—creating the superficial appearance of risk-based decision-making while actual operations proceed according to production convenience rather than contamination risk mitigation. The risk assessment identified the hazard. The environmental monitoring data confirmed the hazard when contamination occurred during the intervention. Yet the intervention continued as an accepted operational practice.​

The specific intervention involved equipment changes to components “integral to stopper seating in the [filling line]”. These components operate at the critical interface between the sterile stopper and the vial—precisely the location where any contamination poses direct product impact risk. The intervention occurred during production campaigns rather than between campaigns when comprehensive decontamination and validation could occur. The intervention involved surfaces potentially occluded during VHP decontamination, meaning their microbiological state was unknown when introduced into the Grade A filling environment.​

Every element of this scenario screams “unacceptable contamination risk,” yet it persisted as accepted practice until FDA inspection. How does this happen? Based on my experience across multiple aseptic facilities, the failure mode follows a predictable pattern:

Production scheduling drives intervention timing rather than contamination risk assessment. Stopping a campaign for equipment maintenance creates schedule disruption, yield loss, and capacity constraints. The pressure to maintain campaign continuity overwhelms contamination risk considerations that appear theoretical compared to the immediate, quantifiable production impact.

Risk assessments become compliance artifacts disconnected from operational decision-making. The quality unit conducts a risk assessment, documents that certain interventions pose unacceptable contamination risk, and files the assessment. But when production encounters the situation requiring that intervention, the actual decision-making process references production need, equipment availability, and batch schedules—not the risk assessment that identified the intervention as high-risk.

Interventions become “normalized deviance”—accepted operational practices despite documented risks. After performing a high-risk intervention successfully (meaning without detected contamination) multiple times, it transitions from “high-risk intervention requiring exceptional controls” to “routine intervention” in operational thinking. The fact that adequate controls prevented contamination detection gets inverted into evidence that the intervention isn’t actually high-risk.

Environmental monitoring provides false assurance when contamination goes undetected. If a high-risk intervention occurs and subsequent environmental monitoring shows no contamination, operations interprets this as validation that the intervention is acceptable. But as discussed in the contact plate section, inadequate sampling methodology may fail to detect contamination that actually occurred. The absence of detected contamination becomes “proof” that contamination didn’t occur, reinforcing the normalization of high-risk interventions.

The EU GMP Annex 1 requirements for intervention management represent regulatory recognition of these failure modes. Annex 1 Section 8.16 requires “the list of interventions evaluated via risk analysis” and Section 9.36 requires that aseptic process simulations include “interventions and associated risks”. The framework is explicit: identify interventions, assess their contamination risk, validate that operators can perform them aseptically through media fills, and eliminate interventions that cannot be performed without unacceptable contamination risk.​

What does robust intervention risk management look like in practice?

Categorize interventions by contamination risk based on specific, documented criteria. The categorization should consider: surfaces contacted (sterile-to-sterile vs. potentially contaminated), duration of exposure, proximity to open product, operator actions required, first air protection feasibility, and frequency. This creates a risk hierarchy that enables differentiated control strategies rather than treating all interventions equivalently.​

Establish clear decision authorities for different intervention risk levels. Routine interventions (low contamination risk, validated through media fills, performed regularly) can proceed under operator judgment following standard procedures. High-risk interventions (those involving occluded surfaces, extended exposure, or proximity to open product) should require quality unit pre-approval including documented risk assessment and enhanced controls specification. Interventions identified as posing unacceptable risk should be prohibited until equipment redesign or process modification eliminates the contamination hazard.​

Validate intervention execution through media fills that specifically simulate the intervention’s contamination challenges. Generic media fills demonstrating overall aseptic processing capability don’t validate specific high-risk interventions. If your risk assessment identifies a particular intervention as posing contamination risk, your media fill program must include that intervention, performed by the operators who will execute it, under the conditions (campaign timing, equipment state, environmental conditions) where it will actually occur.​

Implement intervention-specific environmental monitoring that targets the contamination pathways identified in risk assessments. If the risk assessment identifies that an intervention may expose product to surfaces not reliably decontaminated, environmental monitoring immediately following that intervention should specifically sample those surfaces and adjacent areas. Trending this intervention-specific monitoring data separately from routine environmental monitoring enables detection of intervention-associated contamination patterns.​

Conduct post-intervention investigations when environmental monitoring shows any deviation. The Catalent warning letter describes an environmental monitoring failure whose “most probable root cause” was an atypical intervention involving equipment changes. This temporal association between intervention and contamination should trigger automatic investigation even if environmental monitoring results remain within action levels. The investigation should assess whether intervention protocols require modification or whether the intervention should be eliminated.​

The FDA’s remediation demand addresses this gap directly: “review of currently permitted interventions and elimination of high-risk interventions entailing equipment manipulations during production campaigns that expose the ISO 5 environment to surfaces not exposed to a validated decontamination process”. This requirement forces facilities to confront the intervention paradox: if your risk assessment identifies an intervention as high-risk, you cannot simultaneously permit it as routine operational practice. Either modify the intervention to reduce risk, validate enhanced controls that mitigate the risk, or eliminate the intervention entirely.​

Media Fill Terminations: When Failures Become Invisible

The Catalent warning letter’s discussion of media fill terminations exposes an investigation failure mode that reveals deeper quality system inadequacies. Since November 2023, Catalent terminated more than five media fill batches representing the filling line. Following two terminations for stoppering issues and extrinsic particle contamination, the facility “failed to open a deviation or an investigation at the time of each failure, as required by your SOPs”.​

Read that again. Media fills—the fundamental aseptic processing validation tool, the simulation specifically designed to challenge contamination control—were terminated due to failures, and no deviation was opened, no investigation initiated. The failures simply disappeared from the quality system, becoming invisible until FDA inspection revealed their existence.

The rationalization is predictable: “there was no impact to the SISPQ (Safety, Identity, Strength, Purity, Quality) of the terminated media batches or to any customer batches” because “these media fills were re-executed successfully with passing results”. This reasoning exposes a fundamental misunderstanding of media fill purpose that I’ve encountered with troubling frequency across the industry.​

A media fill is not a “test” that you pass or fail with product consequences. It is a simulation—a deliberate challenge to your aseptic processing capability using growth medium instead of product specifically to identify contamination risks without product impact. When a media fill is terminated due to a processing failure, that termination is itself the critical finding. The termination reveals that your process is vulnerable to exactly the failure mode that caused termination: stoppering problems that could occur during commercial filling, extrinsic particles that could contaminate product.

The FDA’s response is appropriately uncompromising: “You do not provide the investigations with a root cause that justifies aborting and re-executing the media fills, nor do you provide the corrective actions taken for each terminated media fill to ensure effective CAPAs were promptly initiated”. The regulatory expectation is clear: media fill terminations require investigation identical in rigor to commercial batch failures. Why did the stoppering issue occur? What equipment, material, or operator factors contributed? How do we prevent recurrence? What commercial batches may have experienced similar failures that went undetected?​

The re-execution logic is particularly insidious. By immediately re-running the media fill and achieving passing results, Catalent created the appearance of successful validation while ignoring the process vulnerability revealed by the termination. The successful re-execution proved only that under ideal conditions—now with heightened operator awareness following the initial failure—the process could be executed successfully. It provided no assurance that commercial operations, without that heightened awareness and under the same conditions that caused the initial termination, wouldn’t experience identical failures.

What should media fill termination management look like?

Treat every media fill termination as a critical deviation requiring immediate investigation initiation. The investigation should identify the root cause of the termination, assess whether the failure mode could occur during commercial manufacturing, evaluate whether previous commercial batches may have experienced similar failures, and establish corrective actions that prevent recurrence. This investigation must occur before re-execution, not instead of investigation.​

Require quality unit approval before media fill re-execution. The approval should be based on documented investigation findings demonstrating that the termination cause is understood, corrective actions are implemented, and re-execution will validate process capability under conditions that include the corrective actions. Re-execution without investigation approval perpetuates the “keep running until we get a pass” mentality that defeats media fill purpose.​

Implement media fill termination trending as a critical quality indicator. A facility terminating “more than five media fill batches” in a period should recognize this as a signal of fundamental process capability problems, not as a series of unrelated events requiring re-execution. Trending should identify common factors: specific operators, equipment states, intervention types, campaign timing.​

Ensure deviation tracking systems cannot exclude media fill terminations. The Catalent situation arose partly because “you failed to initiate a deviation record to capture the lack of an investigation for each of the terminated media fills, resulting in an undercounting of the deviations”. Quality metrics that exclude media fill terminations from deviation totals create perverse incentives to avoid formal deviation documentation, rendering media fill findings invisible to quality system oversight.​

The broader issue extends beyond media fill terminations to how aseptic processing validation integrates with quality systems. Media fills should function as early warning indicators—detecting aseptic processing vulnerabilities before product impact occurs. But this detection value requires that findings from media fills drive investigations, corrective actions, and process improvements with the same rigor as commercial batch deviations. When media fill failures can be erased through re-execution without investigation, the entire validation framework becomes performative rather than protective.

The Stopper Supplier Qualification Failure: Accepting Contamination at the Source

The stopper contamination issues discussed throughout the warning letter—mammalian hair found in or around stopper regions of vials from nearly 20 batches across multiple products—reveal a supplier qualification and incoming inspection failure that compounds the contamination hazards already discussed. The FDA’s critique focuses on Catalent’s “inappropriate reliance on pre-shipment samples (tailgate samples)” and failure to implement “enhanced or comparative sampling of stoppers from your other suppliers”.​

The pre-shipment or “tailgate” sample approach represents a fundamental violation of GMP sampling principles. Under this approach, the stopper supplier—not Catalent—collected samples from lots prior to shipment and sent these samples directly to Catalent for quality testing. Catalent then made accept/reject decisions for incoming stopper lots based on testing of supplier-selected samples that never passed through Catalent’s receiving or storage processes.​

Why does this matter? Because representative sampling requires that samples be selected from the material population actually received by the facility, stored under facility conditions, and handled through facility processes. Supplier-selected pre-shipment samples bypass every opportunity to detect contamination introduced during shipping, storage transitions, or handling. They enable a supplier to selectively sample from cleaner portions of production lots while shipping potentially contaminated material in the same lot to the customer.

The FDA guidance on this issue is explicit and has been for decades: samples for quality attribute testing “are to be taken at your facility from containers after receipt to ensure they are representative of the components in question”. This isn’t a new expectation emerging from enhanced regulatory scrutiny—it’s a baseline GMP requirement that Catalent systematically violated through reliance on tailgate samples.​

But the tailgate sample issue represents only one element of broader supplier qualification failures. The warning letter notes that “while stoppers from [one supplier] were the primary source of extrinsic particles, they were not the only source of foreign matter.” Yet Catalent implemented “limited, enhanced sampling strategy for one of your suppliers” while failing to “increase sampling oversight” for other suppliers. This selective enhancement—focusing remediation only on the most problematic supplier while ignoring systemic contamination risks across the stopper supply base—predictably failed to resolve ongoing contamination issues.​

What should stopper supplier qualification and incoming inspection look like for aseptic filling operations?

Eliminate pre-shipment or tailgate sampling entirely. All quality testing must be conducted on samples taken from received lots, stored in facility conditions, and selected using documented random sampling procedures. If suppliers require pre-shipment testing for their internal quality release, that’s their process requirement—it doesn’t substitute for the purchaser’s independent incoming inspection using facility-sampled material.​

Implement risk-based incoming inspection that intensifies sampling when contamination history indicates elevated risk. The warning letter notes that Catalent recognized stoppers as “a possible contributing factor for contamination with mammalian hairs” in July 2024 but didn’t implement enhanced sampling until May 2025—a ten-month delay. The inspection enhancement should be automatic and immediate when contamination events implicate incoming materials. The sampling intensity should remain elevated until trending data demonstrates sustained contamination reduction across multiple lots.​

Apply visual inspection with reject criteria specific to the defect types that create product contamination risk. Generic visual inspection looking for general “defects” fails to detect the specific contamination types—embedded hair, extrinsic particles, material fragments—that create sterile product risks. Inspection protocols must specify mammalian hair, fiber contamination, and particulate matter as reject criteria with sensitivity adequate to detect single-particle contamination in sampled stoppers.​

Require supplier process changes—not just enhanced sampling—when contamination trends indicate process capability problems. The warning letter acknowledges Catalent “worked with your suppliers to reduce the likelihood of mammalian hair contamination events” but notes that despite these efforts, “you continued to receive complaints from customers who observed mammalian hair contamination in drug products they received from you”. Enhanced sampling detects contamination; it doesn’t prevent it. Suppliers demonstrating persistent contamination require process audits, environmental control improvements, and validated contamination reduction demonstrated through process capability studies—not just promises to improve quality.​

Implement finished product visual inspection with heightened sensitivity for products using stoppers from suppliers with contamination history. The FDA notes that Catalent indicated “future batches found during visual inspection of finished drug products would undergo a re-inspection followed by tightened acceptable quality limit to ensure defective units would be removed” but didn’t provide the re-inspection procedure. This two-stage inspection approach—initial inspection followed by re-inspection with enhanced criteria for lots from high-risk suppliers—provides additional contamination detection but must be validated to demonstrate adequate defect removal.​

The broader lesson extends beyond stoppers to supplier qualification for any component used in sterile manufacturing. Components introduce contamination risks—microbial bioburden, particulate matter, chemical residues—that cannot be fully mitigated through end-product testing. Supplier qualification must function as a contamination prevention tool, ensuring that materials entering aseptic operations meet microbiological and particulate quality standards appropriate for their role in maintaining sterility. Reliance on tailgate samples, delayed sampling enhancement, and acceptance of persistent supplier contamination all represent failures to recognize suppliers as critical contamination control points requiring rigorous qualification and oversight.

The Systemic Pattern: From Contamination Hazards to Quality System Architecture

Stepping back from individual contamination hazards—occluded surfaces, inadequate sampling, high-risk interventions, media fill terminations, supplier qualification failures—a systemic pattern emerges that connects this warning letter to the broader zemblanity framework I’ve explored in previous posts. These aren’t independent, unrelated deficiencies that coincidentally occurred at the same facility. They represent interconnected architectural failures in how the quality system approaches contamination control.​

The pattern reveals itself through three consistent characteristics:

Detection systems optimized for convenience rather than capability. Contact plates instead of swabs for irregular surfaces. Pre-shipment samples instead of facility-based incoming inspection. Generic visual inspection instead of defect-specific contamination screening. Each choice prioritizes operational ease and workflow efficiency over contamination detection sensitivity. The result is a quality system that generates reassuring data—passing environmental monitoring, acceptable incoming inspection results, successful visual inspection—while actual contamination persists undetected.

Risk assessments that identify hazards without preventing their occurrence. Catalent’s risk assessments advised against interventions disturbing potentially occluded surfaces, yet these interventions continued. The facility recognized stoppers as contamination sources in July 2024 but delayed enhanced sampling until May 2025. Media fill terminations revealed aseptic processing vulnerabilities but triggered re-execution rather than investigation. Risk identification became separated from risk mitigation—the assessment process functioned as compliance theatre rather than decision-making input.​

Investigation systems that erase failures rather than learn from them. Media fill terminations occurred without deviation initiation. Mammalian hair contamination events were investigated individually without recognizing the trend across 20+ deviations. Root cause investigations concluded “no product impact” based on passing sterility tests rather than addressing the contamination source enabling future events. The investigation framework optimized for batch release justification rather than contamination prevention.​

These patterns don’t emerge from incompetent quality professionals or inadequate resource allocation. They emerge from quality system design choices that prioritize production efficiency, workflow continuity, and batch release over contamination detection, investigation rigor, and source elimination. The system delivers what it was designed to deliver: maximum throughput with minimum disruption. It fails to deliver what patients require: contamination control capable of detecting and eliminating sterility risks before product impact.

Recommendations: Building Contamination Hazard Detection Into System Architecture

What does effective contamination hazard management look like at the quality system architecture level? Based on the Catalent failures and broader industry patterns, several principles should guide aseptic operations:

Design decontamination validation around worst-case geometries, not ideal conditions. VHP validation using flat coupons on horizontal surfaces tells you nothing about vapor penetration into the complex geometries, wrapped components, and recessed surfaces actually present in your filling line. Biological indicator placement should target occluded surfaces specifically—if you can’t achieve validated kill on these locations, they’re contamination hazards requiring design modification or alternative decontamination methods.

Select environmental monitoring methods based on detection capability for the surfaces and conditions actually requiring monitoring. Contact plates are adequate for flat, smooth surfaces. They’re inadequate for irregular product-contact surfaces, recessed areas, and complex geometries. Swab sampling takes more time but provides contamination detection capability that contact plates cannot match. The operational convenience sacrifice is trivial compared to the contamination risk from monitoring methods incapable of detecting contamination when it occurs.​

Establish intervention risk classification with decision authorities proportional to contamination risk. Routine low-risk interventions validated through media fills can proceed under operator judgment. High-risk interventions—those involving occluded surfaces, extended exposure, or proximity to open product—require quality unit pre-approval with documented enhanced controls. Interventions identified as posing unacceptable risk should be prohibited pending equipment redesign.​

Treat media fill terminations as critical deviations requiring investigation before re-execution. The termination reveals process vulnerability—the investigation must identify root cause, assess commercial batch risk, and establish corrective actions before validation continues. Re-execution without investigation perpetuates the failures that caused termination.​

Implement supplier qualification with facility-based sampling, contamination-specific inspection criteria, and automatic sampling enhancement when contamination trends emerge. Tailgate samples cannot provide representative material assessment. Visual inspection must target the specific contamination types—mammalian hair, particulate matter, material fragments—that create product risks. Enhanced sampling should be automatic and sustained when contamination history indicates elevated risk.​

Build investigation systems that learn from contamination events rather than erasing them through re-execution or “no product impact” conclusions. Contamination events represent failures in contamination control regardless of whether subsequent testing shows product remains within specification. The investigation purpose is preventing recurrence, not justifying release.​

The FDA’s comprehensive remediation demands represent what quality system architecture should look like: independent assessment of investigation capability, CAPA effectiveness evaluation, contamination hazard risk assessment covering material flows and equipment placement, detailed remediation with specific improvements, and ongoing management oversight throughout the manufacturing lifecycle.​

The Contamination Control Strategy as Living System

The Catalent warning letter’s contamination hazards section serves as a case study in how quality systems can simultaneously maintain surface-level compliance while allowing fundamental contamination control failures to persist. The facility conducted VHP decontamination cycles, performed environmental monitoring, executed media fills, and inspected incoming materials—checking every compliance box. Yet contamination hazards proliferated because these activities optimized for operational convenience and batch release justification rather than contamination detection and source elimination.

The EU GMP Annex 1 Contamination Control Strategy requirement represents regulatory recognition that contamination control cannot be achieved through isolated compliance activities. It requires integrated systems where facility design, decontamination processes, environmental monitoring, intervention protocols, material qualification, and investigation practices function cohesively to detect, investigate, and eliminate contamination sources. The Catalent failures reveal what happens when these elements remain disconnected: decontamination cycles that don’t reach occluded surfaces, monitoring that can’t detect contamination on irregular geometries, interventions that proceed despite identified risks, investigations that erase failures through re-execution​

For those of us responsible for contamination control in aseptic manufacturing, the question isn’t whether our facilities face similar vulnerabilities—they do. The question is whether our quality systems are architected to detect these vulnerabilities before regulators discover them. Are your VHP validations addressing actual occluded surfaces or ideal flat coupons? Are you using contact plates because they detect contamination effectively or because they’re operationally convenient? Do your intervention protocols prevent the high-risk activities your risk assessments identify? When media fills terminate, do investigations occur before re-execution?

The Catalent warning letter provides a diagnostic framework for assessing contamination hazard management. Use it. Map your own decontamination validation against the occluded surface criteria. Evaluate your environmental monitoring method selection against detection capability requirements. Review intervention protocols for alignment with risk assessments. Examine media fill termination handling for investigation rigor. Assess supplier qualification for facility-based sampling and contamination-specific inspection.

The contamination hazards are already present in your aseptic operations. The question is whether your quality system architecture can detect them.

Finding Rhythm in Quality Risk Management: Moving Beyond Control to Adaptive Excellence

The pharmaceutical industry has long operated under what Michael Hudson aptly describes in his recent Forbes article as “symphonic control, “carefully orchestrated strategies executed with rigid precision, where quality units can function like conductors trying to control every note. But as Hudson observes, when our meticulously crafted risk assessments collide with chaotic reality, what emerges is often discordant. The time has come for quality risk management to embrace what I am going to call “rhythmic excellence,” a jazz-inspired approach that maintains rigorous standards while enabling adaptive performance in our increasingly BANI (Brittle, Anxious, Non-linear, and Incomprehensible) regulatory and manufacturing environment.

And since I love a good metaphor, I bring you:

Rhythmic Quality Risk Management

Recent research by Amy Edmondson and colleagues at Harvard Business School provides compelling evidence for rhythmic approaches to complex work. After studying more than 160 innovation teams, they found that performance suffered when teams mixed reflective activities (like risk assessments and control strategy development) with exploratory activities (like hazard identification and opportunity analysis) in the same time period. The highest-performing teams established rhythms that alternated between exploration and reflection, creating distinct beats for different quality activities.

This finding resonates deeply with the challenges we face in pharmaceutical quality risk management. Too often, our risk assessment meetings become frantic affairs where hazard identification, risk analysis, control strategy development, and regulatory communication all happen simultaneously. Teams push through these sessions exhausted and unsatisfied, delivering risk assessments they aren’t proud of—what Hudson describes as “cognitive whiplash”.

From Symphonic Control to Jazz-Based Quality Leadership

The traditional approach to pharmaceutical quality risk management mirrors what Hudson calls symphonic leadership—attempting to impose top-down structure as if more constraint and direction are what teams need to work with confidence. We create detailed risk assessment procedures, prescriptive FMEA templates, and rigid review schedules, then wonder why our teams struggle to adapt when new hazards emerge or when manufacturing conditions change unexpectedly.

Karl Weick’s work on organizational sensemaking reveals why this approach undermines our quality objectives: complex manufacturing environments require “mindful organizing” and the ability to notice subtle changes and respond fluidly. Setting a quality rhythm and letting go of excessive control provides support without constraint, giving teams the freedom to explore emerging risks, experiment with novel control strategies, and make sense of the quality challenges they face.

This represents a fundamental shift in how we conceptualize quality risk management leadership. Instead of being the conductor trying to orchestrate every risk assessment note, quality leaders should function as the rhythm section—establishing predictable beats that keep everyone synchronized while allowing individual expertise to flourish.

The Quality Rhythm Framework: Four Essential Beats

Drawing from Hudson’s research-backed insights and integrating them with ICH Q9(R1) requirements, I envision a Quality Rhythm Framework built on four essential beats:

Beat 1: Find Your Risk Cadence

Establish predictable rhythms that create temporal anchors for your quality team while maintaining ICH Q9 compliance. Weekly hazard identification sessions, daily deviation assessments, monthly control strategy reviews, and quarterly risk communication cycles aren’t just meetings—they’re the beats that keep everyone synchronized while allowing individual risk management expression.

The ICH Q9(R1) revision’s emphasis on proportional formality aligns perfectly with this rhythmic approach. High-risk processes require more frequent beats, while lower-risk areas can operate with extended rhythms. The key is consistency within each risk category, creating what Weick calls “structured flexibility”—the ability to respond creatively within clear boundaries.

Consider implementing these quality-specific rhythmic structures:

  • Daily Risk Pulse: Brief stand-ups focused on emerging quality signals—not comprehensive risk assessments, but awareness-building sessions that keep the team attuned to the manufacturing environment.
  • Weekly Hazard Identification Sessions: Dedicated time for exploring “what could go wrong” and, following ISO 31000 principles, “what could go better than expected.” These sessions should alternate between different product lines or process areas to maintain focus.
  • Monthly Control Strategy Reviews: Deeper evaluations of existing risk controls, including assessment of whether they remain appropriate and identification of optimization opportunities.
  • Quarterly Risk Communication Cycles: Structured information sharing with stakeholders, including regulatory bodies when appropriate, ensuring that risk insights flow effectively throughout the organization.

Beat 2: Pause for Quality Breaths

Hudson emphasizes that jazz musicians know silence is as important as sound, and quality risk management desperately needs structured pauses. Build quality breaths into your organizational rhythm—moments for reflection, integration, and recovery from the intense focus required for effective risk assessment.

Research by performance expert Jim Loehr demonstrates that sustainable excellence requires oscillation, not relentless execution. In quality contexts, this means creating space between intensive risk assessment activities and implementation of control strategies. These pauses allow teams to process complex risk information, integrate diverse perspectives, and avoid the decision fatigue that leads to poor risk judgments.

Practical quality breaths include:

  • Post-Assessment Integration Time: Following comprehensive risk assessments, build in periods where team members can reflect on findings, consult additional resources, and refine their thinking before finalizing control strategies.
  • Cross-Functional Synthesis Sessions: Regular meetings where different functions (Quality, Operations, Regulatory, Technical) come together not to make decisions, but to share perspectives and build collective understanding of quality risks.
  • Knowledge Capture Moments: Structured time for documenting lessons learned, updating risk models based on new experience, and creating institutional memory that enhances future risk assessments.

Beat 3: Encourage Quality Experimentation

Within your rhythmic structure, create psychological safety and confidence that team members can explore novel risk identification approaches without fear of hitting “wrong notes.” When learning and reflection are part of a predictable beat, trust grows and experimentation becomes part of the quality flow.

The ICH Q9(R1) revision’s focus on managing subjectivity in risk assessments creates opportunities for experimental approaches. Instead of viewing subjectivity as a problem to eliminate, we can experiment with structured methods for harnessing diverse perspectives while maintaining analytical rigor.

Hudson’s research shows that predictable rhythm facilitates innovation—when people are comfortable with the rhythm, they’re free to experiment with the melody. In quality risk management, this means establishing consistent frameworks that enable creative hazard identification and innovative control strategy development.

Experimental approaches might include:

  • Success Mode and Benefits Analysis (SMBA): As I’ve discussed previously, complement traditional FMEA with systematic identification of positive potential outcomes. Experiment with different SMBA formats and approaches to find what works best for specific process areas.
  • Cross-Industry Risk Insights: Dedicate portions of risk assessment sessions to exploring how other industries handle similar quality challenges. These experiments in perspective-taking can reveal blind spots in traditional pharmaceutical approaches.
  • Scenario-Based Risk Planning: Experiment with “what if” exercises that go beyond traditional failure modes to explore complex, interdependent risk situations that might emerge in dynamic manufacturing environments.

Beat 4: Enable Quality Solos

Just as jazz musicians trade solos while the ensemble provides support, look for opportunities for individual quality team members to drive specific risk management initiatives. This distributed leadership approach builds capability while maintaining collective coherence around quality objectives.

Hudson’s framework emphasizes that adaptive leaders don’t try to be conductors but create conditions for others to lead. In quality risk management, this means identifying team members with specific expertise or interest areas and empowering them to lead risk assessments in those domains.

Quality leadership solos might include:

  • Process Expert Risk Leadership: Assign experienced operators or engineers to lead risk assessments for processes they know intimately, with quality professionals providing methodological support.
  • Cross-Functional Risk Coordination: Empower individuals to coordinate risk management across organizational boundaries, taking ownership for ensuring all relevant perspectives are incorporated.
  • Innovation Risk Championship: Designate team members to lead risk assessments for new technologies or novel approaches, building expertise in emerging quality challenges.

The Rhythmic Advantage: Three Quality Transformation Benefits

Mastering these rhythmic approaches to quality risk management provide three advantages that mirror Hudson’s leadership research:

Fluid Quality Structure

A jazz ensemble can improvise because musicians share a rhythm. Similarly, quality rhythms keep teams functioning together while offering freedom to adapt to emerging risks, changing regulatory requirements, or novel manufacturing challenges. Management researchers call this “structured flexibility”—exactly what ICH Q9(R1) envisions when it emphasizes proportional formality.

When quality teams operate with shared rhythms, they can respond more effectively to unexpected events. A contamination incident doesn’t require completely reinventing risk assessment approaches—teams can accelerate their established rhythms, bringing familiar frameworks to bear on novel challenges while maintaining analytical rigor.

Sustainable Quality Energy

Quality risk management is inherently demanding work that requires sustained attention to complex, interconnected risks. Traditional approaches often lead to burnout as teams struggle with relentless pressure to identify every possible hazard and implement perfect controls. Rhythmic approaches prevent this exhaustion by regulating pace and integrating recovery.

More importantly, rhythmic quality management aligns teams around purpose and vision rather than merely compliance deadlines. This enables what performance researchers call “sustainable high performance”—quality excellence that endures rather than depletes organizational energy.

When quality professionals find rhythm in their risk management work, they develop what Mihaly Csikszentmihalyi identified as “flow state,” moments when attention is fully focused and performance feels effortless. These states are crucial for the deep thinking required for effective hazard identification and the creative problem-solving needed for innovative control strategies.

Enhanced Quality Trust and Innovation

The paradox Hudson identifies, that some constraint enables creativity, applies directly to quality risk management. Predictable rhythms don’t stifle innovation; they provide the stable foundation from which teams can explore novel approaches to quality challenges.

When quality teams know they have regular, structured opportunities for risk exploration, they’re more willing to raise difficult questions, challenge assumptions, and propose unconventional solutions. The rhythm creates psychological safety for intellectual risk-taking within the controlled environment of systematic risk assessment.

This enhanced innovation capability is particularly crucial as pharmaceutical manufacturing becomes increasingly complex, with continuous manufacturing, advanced process controls, and novel drug modalities creating quality challenges that traditional risk management approaches weren’t designed to address.

Integrating Rhythmic Principles with ICH Q9(R1) Compliance

The beauty of rhythmic quality risk management lies in its fundamental compatibility with ICH Q9(R1) requirements. The revision’s emphasis on scientific knowledge, proportional formality, and risk-based decision-making aligns perfectly with rhythmic approaches that create structured flexibility for quality teams.

Rhythmic Risk Assessment Enhancement

ICH Q9 requires systematic hazard identification, risk analysis, and risk evaluation. Rhythmic approaches enhance these activities by establishing regular, focused sessions for each component rather than trying to accomplish everything in marathon meetings.

During dedicated hazard identification beats, teams can employ diverse techniques—traditional brainstorming, structured what-if analysis, cross-industry benchmarking, and the Success Mode and Benefits Analysis I’ve advocated. The rhythm ensures these activities receive appropriate attention while preventing the cognitive overload that reduces identification effectiveness.

Risk analysis benefits from rhythmic separation between data gathering and interpretation activities. Teams can establish rhythms for collecting process data, manufacturing experience, and regulatory intelligence, followed by separate beats for analyzing this information and developing risk models.

Rhythmic Risk Control Development

The ICH Q9(R1) emphasis on risk-based decision-making aligns perfectly with rhythmic approaches to control strategy development. Instead of rushing from risk assessment to control implementation, rhythmic approaches create space for thoughtful strategy development that considers multiple options and their implications.

Rhythmic control development might include beats for:

  • Control Strategy Ideation: Creative sessions focused on generating potential control approaches without immediate evaluation of feasibility or cost.
  • Implementation Planning: Separate sessions for detailed planning of selected control strategies, including resource requirements, timeline development, and change management considerations.
  • Effectiveness Assessment: Regular rhythms for evaluating implemented controls, gathering performance data, and identifying optimization opportunities.

Rhythmic Risk Communication

ICH Q9’s communication requirements benefit significantly from rhythmic approaches. Instead of ad hoc communication when problems arise, establish regular rhythms for sharing risk insights, control strategy updates, and lessons learned.

Quality communication rhythms should align with organizational decision-making cycles, ensuring that risk insights reach stakeholders when they’re most useful for decision-making. This might include monthly updates to senior leadership, quarterly reports to regulatory affairs, and annual comprehensive risk reviews for long-term strategic planning.

Practical Implementation: Building Your Quality Rhythm

Implementing rhythmic quality risk management requires systematic integration rather than wholesale replacement of existing approaches. Start by evaluating your current risk management processes to identify natural rhythm points and opportunities for enhancement.

Phase 1: Rhythm Assessment and Planning

Map your existing quality risk management activities against rhythmic principles. Identify where teams experience the cognitive whiplash Hudson describes—trying to accomplish too many different types of thinking in single sessions. Look for opportunities to separate exploration from analysis, strategy development from implementation planning, and individual reflection from group decision-making.

Establish criteria for quality rhythm frequency based on risk significance, process complexity, and organizational capacity. High-risk processes might require daily pulse checks and weekly deep dives, while lower-risk areas might operate effectively with monthly assessment rhythms.

Train quality teams on rhythmic principles and their application to risk management. Help them understand how rhythm enhances rather than constrains their analytical capabilities, providing structure that enables deeper thinking and more creative problem-solving.

Phase 2: Pilot Program Development

Select pilot areas where rhythmic approaches are most likely to demonstrate clear benefits. New product development projects, technology implementation initiatives, or process improvement activities often provide ideal testing grounds because their inherent uncertainty creates natural opportunities for both risk management and opportunity identification.

Design pilot programs to test specific rhythmic principles:

  • Rhythm Separation: Compare traditional comprehensive risk assessment meetings with rhythmic approaches that separate hazard identification, risk analysis, and control strategy development into distinct sessions.
  • Quality Breathing: Experiment with structured pauses between intensive risk assessment activities and measure their impact on decision quality and team satisfaction.
  • Distributed Leadership: Identify opportunities for team members to lead specific aspects of risk management and evaluate the impact on engagement and expertise development.

Phase 3: Organizational Integration

Based on pilot results, develop systematic approaches for scaling rhythmic quality risk management across the organization. This requires integration with existing quality systems, regulatory processes, and organizational governance structures.

Consider how rhythmic approaches will interact with regulatory inspection activities, change control processes, and continuous improvement initiatives. Ensure that rhythmic flexibility doesn’t compromise documentation requirements or audit trail integrity.

Establish metrics for evaluating rhythmic quality risk management effectiveness, including both traditional risk management indicators (incident rates, control effectiveness, regulatory compliance) and rhythm-specific measures (team engagement, innovation frequency, decision speed).

Phase 4: Continuous Enhancement and Cultural Integration

Like all aspects of quality risk management, rhythmic approaches require continuous improvement based on experience and changing needs. Regular assessment of rhythm effectiveness helps refine approaches over time and ensures sustained benefits.

The ultimate goal is cultural integration—making rhythmic thinking a natural part of how quality professionals approach risk management challenges. This requires consistent leadership modeling, recognition of rhythmic successes, and integration of rhythmic principles into performance expectations and career development.

Measuring Rhythmic Quality Success

Traditional quality metrics focus primarily on negative outcome prevention: deviation rates, batch failures, regulatory findings, and compliance scores. While these remain important, rhythmic quality risk management requires expanded measurement approaches that capture both defensive effectiveness and adaptive capability.

Enhanced metrics should include:

  • Rhythm Consistency Indicators: Frequency of established quality rhythms, participation rates in rhythmic activities, and adherence to planned cadences.
  • Innovation and Adaptation Measures: Number of novel risk identification approaches tested, implementation rate of creative control strategies, and frequency of process improvements emerging from risk management activities.
  • Team Engagement and Development: Participation in quality leadership opportunities, cross-functional collaboration frequency, and professional development within risk management capabilities.
  • Decision Quality Indicators: Time from risk identification to control implementation, stakeholder satisfaction with risk communication, and long-term effectiveness of implemented controls.

Regulatory Considerations: Communicating Rhythmic Value

Regulatory agencies are increasingly interested in risk-based approaches that demonstrate genuine process understanding and continuous improvement capabilities. Rhythmic quality risk management strengthens regulatory relationships by showing sophisticated thinking about process optimization and quality enhancement within established frameworks.

When communicating with regulatory agencies, emphasize how rhythmic approaches improve process understanding, enhance control strategy development, and support continuous improvement objectives. Show how structured flexibility leads to better patient protection through more responsive and adaptive quality systems.

Focus regulatory communications on how enhanced risk understanding leads to better quality outcomes rather than on operational efficiency benefits that might appear secondary to regulatory objectives. Demonstrate how rhythmic approaches maintain analytical rigor while enabling more effective responses to emerging quality challenges.

The Future of Quality Risk Management: Beyond Rhythm to Resonance

As we master rhythmic approaches to quality risk management, the next evolution involves what I call “quality resonance”—the phenomenon that occurs when individual quality rhythms align and amplify each other across organizational boundaries. Just as musical instruments can create resonance that produces sounds more powerful than any individual instrument, quality organizations can achieve resonant states where risk management effectiveness transcends the sum of individual contributions.

Resonant quality organizations share several characteristics:

  • Synchronized Rhythm Networks: Quality rhythms in different departments, processes, and product lines align to create organization-wide patterns of risk awareness and response capability.
  • Harmonic Risk Communication: Information flows between quality functions create harmonics that amplify important signals while filtering noise, enabling more effective decision-making at all organizational levels.
  • Emergent Quality Intelligence: The interaction of multiple rhythmic quality processes generates insights and capabilities that wouldn’t be possible through individual efforts alone.

Building toward quality resonance requires sustained commitment to rhythmic principles, continuous refinement of quality cadences, and patient development of organizational capability. The payoff, however, is transformational: quality risk management that not only prevents problems but actively creates value through enhanced understanding, improved processes, and strengthened competitive position.

Finding Your Quality Beat

Uncertainty is inevitable in pharmaceutical manufacturing, regulatory environments, and global supply chains. As Hudson emphasizes, the choice is whether to exhaust ourselves trying to conduct every quality note or to lay down rhythms that enable entire teams to create something extraordinary together.

Tomorrow morning, when you walk into that risk assessment meeting, you’ll face this choice in real time. Will you pick up the conductor’s baton, trying to control every analytical voice? Or will you sit at the back of the stage and create the beat on which your quality team can find its flow?

The research is clear: rhythmic approaches to complex work create better outcomes, higher engagement, and more sustainable performance. The ICH Q9(R1) framework provides the flexibility needed to implement rhythmic quality risk management while maintaining regulatory compliance. The tools and techniques exist to transform quality risk management from a defensive necessity into an adaptive capability that drives innovation and competitive advantage.

The question isn’t whether rhythmic quality risk management will emerge—it’s whether your organization will lead this transformation or struggle to catch up. The teams that master quality rhythm first will be best positioned to thrive in our increasingly BANI pharmaceutical world, turning uncertainty into opportunity while maintaining the rigorous standards our patients deserve.

Start with one beat. Find one aspect of your current quality risk management where you can separate exploration from analysis, create space for reflection, or enable someone to lead. Feel the difference that rhythm makes. Then gradually expand, building the quality jazz ensemble that our complex manufacturing world demands.

The rhythm section is waiting. It’s time to find your quality beat.

Risk Management for the 4 Levels of Controls for Product

There are really 4 layers of protection for our pharmaceutical product.

  1. Process controls
  2. Equipment controls
  3. Operating procedure controls
  4. Production environment controls

These individually and together are evaluated as part of the HACCP process, forming our layers of control analysis.

Process Controls:

    • Conduct a detailed hazard analysis for each step in the production process
    • Identify critical control points (CCPs) where hazards can be prevented, eliminated or reduced
    • Establish critical limits for each CCP (e.g. time/temperature parameters)
    • Develop monitoring procedures to ensure critical limits are met
    • Establish corrective actions if critical limits are not met
    • Validate and verify the effectiveness of process controls

    Equipment Controls:

      • Evaluate equipment design and materials for hazards
      • Establish preventive maintenance schedules
      • Develop sanitation and cleaning procedures for equipment
      • Calibrate equipment and instruments regularly
      • Validate equipment performance for critical processes
      • Establish equipment monitoring procedures

      Operating Procedure Controls:

        • Develop standard operating procedures (SOPs) for all key tasks
        • Create good manufacturing practices (GMPs) for personnel
        • Establish hygiene and sanitation procedures
        • Implement employee training programs on contamination control
        • Develop recordkeeping and documentation procedures
        • Regularly review and update operating procedures

        Production Environment Controls:

          • Design facility layout to prevent cross-contamination
          • Establish zoning and traffic patterns
          • Implement pest control programs
          • Develop air handling and filtration systems
          • Create sanitation schedules for production areas
          • Monitor environmental conditions (temperature, humidity, etc.)
          • Conduct regular environmental testing

          The key is to use a systematic, science-based approach to identify potential hazards at each layer and implement appropriate preventive controls. The controls should be validated, monitored, verified and documented as part of the overall contamination control strategy (system). Regular review and updates are needed to ensure the controls remain effective.

          Conducting A Hazard and Operability Study (HAZOP)

          A Hazard and Operability Study (HAZOP) is a structured and systematic examination of a complex planned or existing process or operation to identify and evaluate problems that may represent risks to product, personnel or equipment. The primary goal of a HAZOP is to ensure that risks are managed effectively by identifying potential hazards and operability problems and developing appropriate mitigation strategies.

          Why Use HAZOP?

          Biotech facilities involve intricate processes that can be prone to various risks, including contamination, equipment failure, and process deviations. Implementing a HAZOP can:

          • Risk Identification and Mitigation: HAZOPs help identify potential hazards associated with biotech processes, such as contamination risks, equipment malfunctions, and deviations from standard operating procedures. By identifying these risks, facilities can implement mitigation strategies to prevent accidents and ensure safety.
          • Process Optimization: Through the systematic analysis of processes, HAZOPs can identify inefficiencies and areas for improvement, leading to optimized operations and enhanced productivity.

          Part of a Continuum of Risk Tools

          A HAZOP (Hazard and Operability) study differs from other risk assessment methods in a few key ways:

          1. Systematic examination of process deviations: HAZOP uses a very structured approach of examining potential deviations from the intended design and operation of a process, using guidewords like “more”, “less”, “no”, “reverse”, etc. This systematic approach helps identify hazards that may be missed by other methods.
          2. Focus on operability issues: The HAZOP examines operability problems that could impact process efficiency or product quality.
          3. Node-by-node analysis: The process is broken down into nodes or sections that are analyzed individually, allowing for very thorough examination.
          4. Qualitative analysis: Unlike quantitative risk assessment methods, HAZOP is primarily qualitative, focusing on identifying potential hazards rather than quantifying risk levels. HAZOPs do not typically assign numerical scores or rankings to risks.
          5. Consideration of causes and consequences: For each deviation, the team examines possible causes, consequences, and existing safeguards before recommending additional actions.
          6. Applicable to complex processes: The structured approach makes HAZOP well-suited for analyzing complex processes with many variables and potential interactions.
          MethodDescriptionStrengthsLimitations
          HAZOP (Hazard and Operability Study)Systematic examination of process/operation to identify potential hazards and operability problems– Very thorough and structured approach
          – Examines deviations from design intent
          – Team-based
          – Time consuming
          – Primarily qualitative
          FMEA (Failure Mode and Effects Analysis)Systematic method to identify potential failure modes and their effects– Quantitative risk prioritization
          – Proactive approach
          – Can be used on products and processes
          – Does not consider combinations of failures
          – Can be subjective
          HACCP (Hazard Analysis and Critical Control Points)Systematic approach to food safety hazards– Focus on prevention
          – Identifies critical control points
          – Requires prerequisite programs in place
          PHA (Preliminary Hazard Analysis)Early stage hazard identification technique– Can be used early in design process
          – Relatively quick to perform
          – Identifies major hazards
          – Not very detailed
          – Qualitative only
          – May miss some hazards
          Bow-Tie AnalysisCombines fault tree and event tree analysis– Visual representation of risk pathways
          – Shows preventive and mitigative controls
          – Good communication tool
          – Does not show detailed failure logic
          – Can oversimplify complex scenarios
          – Time consuming for multiple hazards

          Key differences:

          • HAZOP focuses on deviations from design intent, while FMEA looks at potential failure modes
          • HACCP is specific to identify hazards and is commonly used in food safety, while the others are more general risk assessment tools
          • PHA is used early in design, while the others are typically used on existing systems
          • Bow-Tie provides a visual risk pathway, while the others use more tabular formats
          • FMEA and HAZOP tend to be the most thorough and time-intensive methods

          The choice of method depends on the specific application, stage of design, and level of detail required. Often a combination of methods may be used.

          Instructions for Conducting a HAZOP

          Preparation

            • Assemble a multidisciplinary team comprising appropriate experts
            • Define the scope of the HAZOP study, including the specific processes or operations to be analyzed.
            • Gather and review all relevant documentation, such as process flow diagrams, piping and instrumentation diagrams, and standard operating procedures.

            Execution

              • Divide the Process into Nodes: Break down the process into manageable sections or nodes. Each node typically represents a specific part of the process, such as a piece of equipment or a process step.
              • Identify Deviations: For each node, guidewords are applied to identify potential deviations from the intended design or operation. Common guidewords include:
                • No: Complete absence of a process parameter (e.g., no flow).
                • More: Quantitative increase (e.g., more pressure).
                • Less: Quantitative decrease (e.g., less temperature).
                • As well as: Presence of additional elements (e.g., contamination).
                • Part of: Partial completion of an action (e.g., partial mixing).
                • Reverse: Logical opposite of the intended action (e.g., reverse flow).
              • Analyze Causes and Consequences: Determine the possible causes of each deviation and analyze the potential consequences on safety, environment, and operations. This involves considering various factors such as equipment failure, human error, environmental conditions, or procedural issues that could lead to the deviation.
                • Use of Experience and Knowledge: The team relies on their collective experience and knowledge of the process, equipment, and industry standards to hypothesize potential causes. This may include reviewing historical data, previous incidents, and near misses.
              • Recommend Actions: Develop recommendations for mitigating identified risks, such as changes to the process, additional controls, or procedural modifications.

              Documentation and Follow-Up

                • Document all findings, including identified hazards, potential consequences, and recommended actions.
                • Assign responsibilities for implementing recommendations and establish timelines for completion.
                • Conduct follow-up reviews to ensure that recommended actions have been implemented effectively and that the process remains safe and operable.

                Review and Update

                  • Regularly review and update the HAZOP study to account for changes in processes, equipment, or regulations.
                  • Ensure continuous improvement by incorporating lessons learned from past incidents or near misses.
                  • Iterative Process: The process is iterative, with the team revisiting and refining their analysis as more information becomes available or as the understanding of the process deepens.
                  NodeGuidewordParameterDeviationCauseConsequenceSafeguardsRecommendationsActions
                  Specific section or equipment being analyzedGuideword applied (e.g. No, More, Less, Reverse, etc.)Process parameter being examined (e.g. Flow, Temperature, Pressure, etc.)How the parameter deviates from design intent when guideword is appliedPossible reasons for the deviationPotential results if deviation occursExisting measures to prevent or mitigate the deviationSuggested additional measures to control the riskSpecific tasks assigned to implement recommendations

                  Data Quality, Data Bias, and the Risk Assessment

                  I’ve seen my fair share of risk assessments listing data quality or bias as hazards. I tend to think that is pretty sloppy. I especially see this a lot in conversations around AI/ML. Data quality is not a risk. It is a causal factor in the failure or severity.

                  Data Quality and Data Bias

                  Data Quality

                  Data quality refers to how well a dataset meets certain criteria that make it fit for its intended use. The key dimensions of data quality include:

                  1. Accuracy – The data correctly represents the real-world entities or events it’s supposed to describe.
                  2. Completeness – The dataset contains all the necessary information without missing values.
                  3. Consistency – The data is uniform and coherent across different systems or datasets.
                  4. Timeliness – The data is up-to-date and available when needed.
                  5. Validity – The data conforms to defined business rules and parameters.
                  6. Uniqueness – There are no duplicate records in the dataset.

                  High-quality data is crucial for making informed quality decisions, conducting accurate analyses, and developing reliable AI/ML models. Poor data quality can lead to operational issues, inaccurate insights, and flawed strategies.

                  Data Bias

                  Data bias refers to systematic errors or prejudices present in the data that can lead to inaccurate or unfair outcomes, especially in machine learning and AI applications. Some common types of data bias include:

                  1. Sampling bias – When the data sample doesn’t accurately represent the entire population.
                  2. Selection bias – When certain groups are over- or under-represented in the dataset.
                  3. Reporting bias – When the frequency of events in the data doesn’t reflect real-world frequencies.
                  4. Measurement bias – When the data collection method systematically skews the results.
                  5. Algorithmic bias – When the algorithms or models introduce biases in the results.

                  Data bias can lead to discriminatory outcomes and produce inaccurate predictions or classifications.

                  Relationship between Data Quality and Bias

                  While data quality and bias are distinct concepts, they are closely related:

                  • Poor data quality can introduce or exacerbate biases. For example, incomplete or inaccurate data may disproportionately affect certain groups.
                  • High-quality data doesn’t necessarily mean unbiased data. A dataset can be accurate, complete, and consistent but still contain inherent biases.
                  • Addressing data bias often involves improving certain aspects of data quality, such as completeness and representativeness.

                  Organizations must implement robust data governance practices to ensure high-quality and unbiased data, regularly assess their data for quality issues and potential biases, and use techniques like data cleansing, resampling, and algorithmic debiasing.

                  Identifying the Hazards and the Risks

                  It is critical to remember the difference between a hazard and a risk. Data quality is a causal factor in the hazard, not a harm.

                  Hazard Identification

                  Think of it like a fever. An open wound is a causal factor for the fever, which has a root cause of poor wound hygiene. I can have the factor (the wound), but without the presence of the root cause (poor wound hygiene), the event (fever) would not develop (okay, there may be other root causes in play as well; remember there is never really just one root cause).

                  Potential Issues of Poor Data Quality and Inadequate Data Governance

                  The risks associated with poor data quality and inadequate data governance can significantly impact organizations. Here are the key areas where risks can develop:

                  Decreased Data Quality

                  • Inaccurate, incomplete, or inconsistent data leads to flawed decision-making
                  • Errors in customer information, product details, or financial data can cause operational issues
                  • Poor quality data hinders effective analysis and forecasting

                  Compliance Failures:

                  • Non-compliance with regulations can result in regulatory actions
                  • Legal complications and reputational damage from failing to meet regulatory requirements
                  • Increased scrutiny from regulatory bodies

                  Security Breaches

                  • Inadequate data protection increases vulnerability to cyberattacks and data breaches
                  • Financial costs associated with breach remediation, legal fees, and potential fines
                  • Loss of customer trust and long-term reputational damage

                  Operational Inefficiencies

                  • Time wasted on manual data cleaning and correction
                  • Reduced productivity due to employees working with unreliable data
                  • Inefficient processes resulting from poor data integration or inconsistent data formats

                  Missed Opportunities

                  • Failure to identify market trends or customer insights due to unreliable data
                  • Missed sales leads or potential customers because of inaccurate contact information
                  • Inability to capitalize on business opportunities due to lack of trustworthy data

                  Poor Decision-Making

                  • Decisions based on inaccurate or incomplete data leading to suboptimal outcomes, including deviations and product/study impact
                  • Misallocation of resources due to flawed insights from poor quality data
                  • Inability to effectively measure and improve performance

                  Potential Issues of Data Bias

                  Data bias presents significant risks across various domains, particularly when integrated into machine learning (ML) and artificial intelligence (AI) systems. These risks can manifest in several ways, impacting both individuals and organizations.

                  Discrimination and Inequality

                  Data bias can lead to discriminatory outcomes, systematically disadvantaging certain groups based on race, gender, age, or socioeconomic status. For example:

                  • Judicial Systems: Biased algorithms used in risk assessments for bail and sentencing can result in harsher penalties for people of color compared to their white counterparts, even when controlling for similar circumstances.
                  • Healthcare: AI systems trained on biased medical data may provide suboptimal care recommendations for minority groups, potentially exacerbating health disparities.

                  Erosion of Trust and Reputation

                  Organizations that rely on biased data for decision-making risk losing the trust of their customers and stakeholders. This can have severe reputational consequences:

                  • Customer Trust: If customers perceive that an organization’s AI systems are biased, they may lose trust in the brand, leading to a decline in customer loyalty and revenue.
                  • Reputation Damage: High-profile cases of AI bias, such as discriminatory hiring practices or unfair loan approvals, can attract negative media attention and public backlash.

                  Legal and Regulatory Risks

                  There are significant legal and regulatory risks associated with data bias:

                  • Compliance Issues: Organizations may face legal challenges and fines if their AI systems violate anti-discrimination laws.
                  • Regulatory Scrutiny: Increasing awareness of AI bias has led to calls for stricter regulations to ensure fairness and accountability in AI systems.

                  Poor Decision-Making

                  Biased data can lead to erroneous decisions that negatively impact business operations:

                  • Operational Inefficiencies: AI models trained on biased data may make poor predictions, leading to inefficient resource allocation and operational mishaps.
                  • Financial Losses: Incorrect decisions based on biased data can result in financial losses, such as extending credit to high-risk individuals or mismanaging inventory.

                  Amplification of Existing Biases

                  AI systems can perpetuate and even amplify existing biases if not properly managed:

                  • Feedback Loops: Biased AI systems can create feedback loops where biased outcomes reinforce the biased data, leading to increasingly skewed results over time.
                  • Entrenched Inequities: Over time, biased AI systems can entrench societal inequities, making it harder to address underlying issues of discrimination and inequality.

                  Ethical and Moral Implications

                  The ethical implications of data bias are profound:

                  • Fairness and Justice: Biased AI systems challenge the principles of fairness and justice, raising moral questions about using such technologies in critical decision-making processes.
                  • Human Rights: There are concerns that biased AI systems could infringe on human rights, particularly in areas like surveillance, law enforcement, and social services.

                  Perform the Risk Assessment

                  ICH Q9 (r1) Risk Management Process

                  Risk Management happens at the system/process level, where an AI/ML solution will be used. As appropriate, it drills down to the technology level. Never start with the technology level.

                  Hazard Identification

                  It is important to identify product quality hazards that may ultimately lead to patient harm. What is the hazard of that bad decision? What is the hazard of bad quality data? Those are not hazards; they are causes.

                  Hazard identification, the first step of a risk assessment, begins with a well-defined question defining why the risk assessment is being performed. It helps define the system and the appropriate scope of what will be studied. It addresses the “What might go wrong?” question, including identifying the possible consequences of hazards. The output of the hazard identification step is the identification of the possibilities (i.e., hazards) that the risk event (e.g., impact to product quality) happens.

                  The risk question takes the form of “What is the risk of using AI/ML solution for <Process/System> to <purpose of AI/MIL solution.” For example, “What is the risk of using AI/ML to identify deviation recurrence and help prioritize CAPAs?” or “What is the risk of using AI/ML to monitor real-time continuous manufacturing to determine the need to evaluate for a potential diversion?”

                  Process maps, data maps, and knowledge maps are critical here.

                  We can now identify the specific failure modes associated with AI/ML. This may involve deeep dive risk assessments. A failure mode is the specific way a failure occurs. So in this case, the specific way that bad data or bad decision making can happen. Multiple failure modes can, and usually do, lead to the same hazardous situation.

                  Make sure you drill down on failure causes. If more than 5 potential causes can be identified for a proposed failure mode, it is too broad and probably written at a high level in the process or item being risk assessed. It should be broken down into several specific failure modes with fewer potential causes and more manageable.

                  Start with an outline of how the process works and a description of the AI/ML (special technology) used in the process. Then, interrogate the following for potential failure modes:

                  • The steps in the process or item under study in which AI/ML interventions occur;
                  • The process/procedure documentation for example, master batch records, SOPs, protocols, etc.
                    • Current and proposed process/procedure in sufficient detail to facilitate failure mode identification;
                  • Critical Process Controls