Key Metrics for GMP Training in Pharmaceutical Systems: Leading & Lagging Indicators

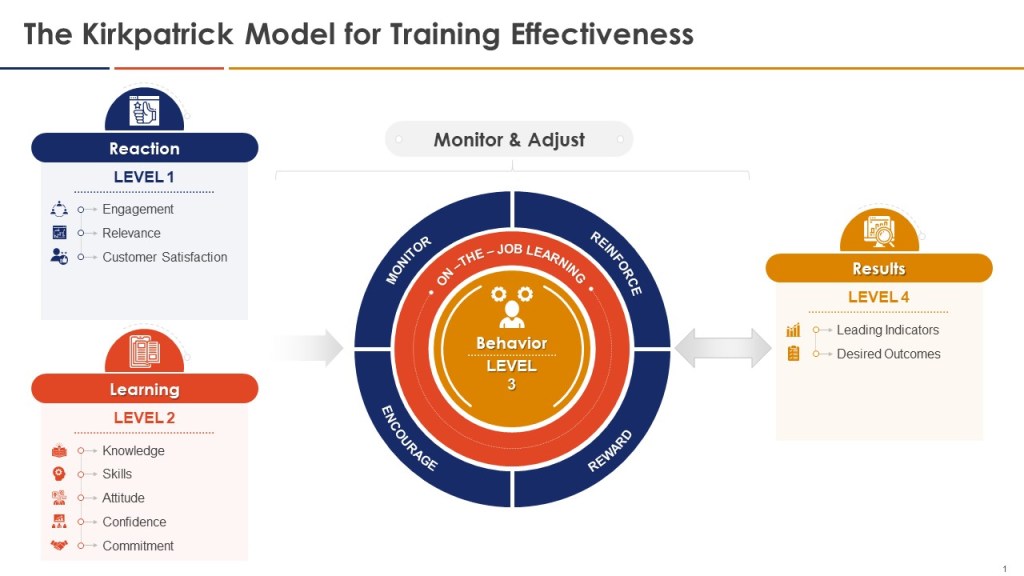
When thinking about the training program you can add the Kilpatrick model to the mix and build from there. This allows a view across the training system to drive for an effective training program.

GMP Training Metrics Framework Aligned with Kirkpatrick’s Model

Kirkpatrick LevelCategoryMetric TypeExamplePurposeData SourceRegulatory Alignment
Level 1: ReactionKPILeading% Training Satisfaction Surveys CompletedMeasures engagement and perceived relevance of GMP trainingLMS (Learning Management System)ICH Q10 Section 2.7 (Training Effectiveness)
KRILeading% Surveys with Negative Feedback (<70%)Identifies risk of disengagement or poor training designSurvey ToolsFDA Quality Metrics Reporting (2025 Draft)
KBILeadingParticipation in Post-Training FeedbackEncourages proactive communication about training gapsAttendance LogsEU GMP Chapter 2 (Personnel Training)
Level 2: LearningKPILeadingPre/Post-Training Quiz Pass Rate (≥90%)Validates knowledge retention of GMP principlesAssessment Software21 CFR 211.25 (Training Requirements)
KRILeading% Trainees Requiring Remediation (>15%)Predicts future compliance risks due to knowledge gapsLMS Remediation ReportsFDA Warning Letters (Training Deficiencies)
KBILaggingReduction in Knowledge Assessment RetakesValidates long-term retention of GMP conceptsTraining RecordsICH Q7 Section 2.12 (Training Documentation)
Level 3: BehaviorKPILeadingObserved GMP Compliance Rate During AuditsMeasures real-time application of training in daily workflowsAudit ChecklistsFDA 21 CFR 211 (cGMP Compliance)
KRILeadingNear-Miss Reports Linked to Training GapsIdentifies emerging behavioral risks before incidents occurQMS (Quality Management System)ISO 9001:2015 Clause 10.2 (Nonconformity)
KBILeadingFrequency of Peer-to-Peer Knowledge SharingEncourages a culture of continuous learning and collaborationMeeting LogsICH Q10 Section 3.2.3 (Knowledge Management)
Level 4: ResultsKPILagging% Reduction in Repeat Deviations Post-TrainingQuantifies training’s impact on operational qualityDeviation Management SystemsFDA Quality Metrics (Batch Rejection Rate)
KRILaggingAudit Findings Related to Training EffectivenessReflects systemic training failures impacting complianceRegulatory Audit ReportsEU GMP Annex 15 (Qualification & Validation)
KBILaggingEmployee TurnoverAssesses cultural impact of training on staff retentionHR RecordsICH Q10 Section 1.5 (Management Responsibility)

Kirkpatrick Model Integration

  1. Level 1 (Reaction):
  • Leading KPI: Track survey completion to ensure trainees perceive value in GMP content.
  • Leading KRI: Flag facilities with >30% negative feedback for immediate remediation .
  1. Level 2 (Learning):
  • Leading KPI: Require ≥90% quiz pass rates for high-risk roles (e.g., aseptic operators) .
  • Lagging KBI: Retake rates >20% trigger refresher courses under EU GMP Chapter 3 .
  1. Level 3 (Behavior):
  • Leading KPI: <95% compliance during audits mandates retraining per 21 CFR 211.25 .
  • Leading KRI: >5 near-misses/month linked to training gaps violates FDA’s “state of control” .
  1. Level 4 (Results):
  • Lagging KPI: <10% reduction in deviations triggers CAPA under ICH Q10 Section 4.3 .
  • Lagging KRI: Audit findings >3/year require FDA-mandated QMS reviews .

Regulatory & Strategic Alignment

  • FDA Quality Metrics: Level 4 KPIs (e.g., deviation reduction) align with FDA’s 2025 focus on “sustainable compliance” .
  • ICH Q10: Level 3 KBIs (peer knowledge sharing) support “continual improvement of process performance” .
  • EU GMP: Level 2 KRIs (remediation rates) enforce Annex 11’s electronic training documentation requirements .

By integrating Kirkpatrick’s levels with GMP training metrics, organizations bridge knowledge acquisition to measurable quality outcomes while meeting global regulatory expectations.

Key Metrics for Pharmaceutical Change Control: Leading & Lagging Indicators

CategoryMetric TypeExamplePurposeRegulatory Alignment
KPILeading% Change Requests with Completed Risk AssessmentsPredicts compliance with FDA 21 CFR 211.100 (process control)FDA 21 CFR 211, ICH Q10, ICH Q9
LaggingAverage Time to Close Change RequestsValidates efficiency of change implementation (EudraLex Annex 15)EU GMP Annex 15
KRILeadingUnresolved CAPAs Linked to Change RequestsIdentifies systemic risks before deviations occur (FDA Warning Letters)21 CFR 211.22, ICH Q7
LaggingRepeat Deviations Post-ChangeReflects failure to address root causes (FDA 483 Observations)21 CFR 211.192
KBILeadingCross-Functional Review Participation RateEncourages proactive collaboration in change evaluationICH Q10 Section 3.2.3
LaggingReduction in Documentation Errors Post-TrainingValidates effectiveness of staff competency programsEU 1252/2014 Article 14

Key Performance Indicators (KPIs)

  • Leading KPI:
  • Change Requests with Completed Risk Assessments: Measures proactive compliance with FDA requirements for risk-based change evaluation. A rate <90% triggers quality reviews.
  • Lagging KPI:
  • Time to Close Changes: Benchmarks against EMA’s 30-day resolution expectation for critical changes. Prolonged closure (>45 days) indicates process bottlenecks.

Key Risk Indicators (KRIs)

  • Leading KRI:
  • Unresolved CAPAs: Predicts validation gaps; >5 open CAPAs per change violates FDA’s “state of control” mandate.
  • Lagging KRI:
  • Repeat Deviations: >3 repeat deviations quarterly triggers mandatory revalidation per FDA 21 CFR 211.180.

Key Behavioral Indicators (KBIs)

  • Leading KBI:
  • Review Participation: <80% cross-functional attendance violates ICH Q10’s “integrated team” expectation.
  • Lagging KBI:
  • Documentation Errors: Post-training error reduction <30% prompts requalification under EU GMP Chapter 4.

Implementation Guidance

Align with Regulatory Thresholds: Set leading KPI targets using FDA’s 2025 draft guidance: ≥95% risk assessment completion for high-impact changes.

Automate Tracking: Integrate metrics with eQMS software to monitor CAPA aging (leading KRI) and deviation trends (lagging KRI) in real time.

Link to Training: Tie lagging KBIs to annual GMP refresher courses, as required by EU 1252/2014 Article 14.


    Why It Matters:
    Leading metrics enable proactive mitigation of change-related risks (e.g., unresolved CAPAs predicting audit failures), while lagging metrics validate adherence to FDA’s lifecycle approach for process validation. Balancing both ensures compliance with 21 CFR 211’s “state of control” mandate while fostering continuous improvement.

    Navigating Metrics in Quality Management: Leading vs. Lagging Indicators, KPIs, KRIs, KBIs, and Their Role in OKRs

    Understanding how to measure success and risk is critical for organizations aiming to achieve strategic objectives. As we develop Quality Plans and Metric Plans it is important to explore the nuances of leading and lagging metrics, define Key Performance Indicators (KPIs), Key Behavioral Indicators (KBIs), and Key Risk Indicators (KRIs), and explains how these concepts intersect with Objectives and Key Results (OKRs).

    Leading vs. Lagging Metrics: A Foundation

    Leading metrics predict future outcomes by measuring activities that drive results. They are proactive, forward-looking, and enable real-time adjustments. For example, tracking employee training completion rates (leading) can predict fewer operational errors.

    Lagging metrics reflect historical performance, confirming whether quality objectives were achieved. They are reactive and often tied to outcomes like batch rejection rates or the number of product recalls. For example, in a pharmaceutical quality system, lagging metrics might include the annual number of regulatory observations, the percentage of batches released on time, or the rate of customer complaints related to product quality. These metrics provide a retrospective view of the quality system’s effectiveness, allowing organizations to assess their performance against predetermined quality goals and industry standards. They offer limited opportunities for mid-course corrections

    The interplay between leading and lagging metrics ensures organizations balance anticipation of future performance with accountability for past results.

    Defining KPIs, KRIs, and KBIs

    Key Performance Indicators (KPIs)

    KPIs measure progress toward Quality System goals. They are outcome-focused and often tied to strategic objectives.

    • Leading KPI Example: Process Capability Index (Cpk) – This measures how well a process can produce output within specification limits. A higher Cpk could indicate fewer products requiring disposition.
    • Lagging KPI Example: Cost of Poor Quality (COPQ) -The total cost associated with products that don’t meet quality standards, including testing and disposition cost.

    Key Risk Indicators (KRIs)

    KRIs monitor risks that could derail objectives. They act as early warning systems for potential threats. Leading KRIs should trigger risk assessments and/or pre-defined corrections when thresholds are breached.

    • Leading KRI Example: Unresolved CAPAs (Corrective and Preventive Actions) – Tracks open corrective actions for past deviations. A rising number signals unresolved systemic issues that could lead to recurrence
    • Lagging KRI Example: Repeat Deviation Frequency – Tracks recurring deviations of the same type. Highlights ineffective CAPAs or systemic weaknesses

    Key Behavioral Indicators (KBIs)

    KBIs track employee actions and cultural alignment. They link behaviors to Quality System outcomes.

    • Leading KBI Example: Frequency of safety protocol adherence (predicts fewer workplace accidents).
    • Lagging KBI Example: Employee turnover rate (reflects past cultural challenges).

    Applying Leading and Lagging Metrics to KPIs, KRIs, and KBIs

    Each metric type can be mapped to leading or lagging dimensions:

    • KPIs: Leading KPIs drive action while lagging KPIs validate results
    • KRIs: Leading KRIs identify emerging risks while lagging KRIs analyze past incidents
    • KBIs: Leading KBIs encourage desired behaviors while lagging KBIs assess outcomes

    Oversight Framework for the Validated State

    An example of applying this for the FUSE(P) program.

    CategoryMetric TypeFDA-Aligned ExamplePurposeData Source
    KPILeading% completion of Stage 3 CPV protocolsProactively ensures continued process verification aligns with validation master plans Validation tracking systems
    LaggingAnnual audit findings related to validation driftConfirms adherence to regulator’s “state of control” requirementsInternal/regulatory audit reports
    KRILeadingOpen CAPAs linked to FUSe(P) validation gapsIdentifies unresolved systemic risks affecting process robustness Quality management systems (QMS)
    LaggingRepeat deviations in validated batchesReflects failure to address root causes post-validation Deviation management systems
    KBILeadingCross-functional review of process monitoring trendsEncourages proactive behavior to maintain validation stateMeeting minutes, action logs
    LaggingReduction in human errors during requalificationValidates effectiveness of training/behavioral controlsTraining records, deviation reports

    This framework operationalizes a focus on data-driven, science-based programs while closing gaps cited in recent Warning Letters.


    Goals vs. OKRs: Alignment with Metrics

    Goals are broad, aspirational targets (e.g., “Improve product quality”). OKRs (Objectives and Key Results) break goals into actionable, measurable components:

    • Objective: Reduce manufacturing defects.
    • Key Results:
      • Decrease batch rejection rate from 5% to 2% (lagging KPI).
      • Train 100% of production staff on updated protocols by Q2 (leading KPI).
      • Reduce repeat deviations by 30% (lagging KRI).

    KPIs, KRIs, and KBIs operationalize OKRs by quantifying progress and risks. For instance, a leading KRI like “number of open CAPAs” (Corrective and Preventive Actions) informs whether the OKR to reduce defects is on track.


    More Pharmaceutical Quality System Examples

    Leading Metrics

    • KPI: Percentage of staff completing GMP training (predicts adherence to quality standards).
    • KRI: Number of unresolved deviations in the CAPA system (predicts compliance risks).
    • KBI: Daily equipment calibration checks (predicts fewer production errors).

    Lagging Metrics

    • KPI: Batch rejection rate due to contamination (confirms quality failures).
    • KRI: Regulatory audit findings (reflects past non-compliance).
    • KBI: Employee turnover in quality assurance roles (indicates cultural or procedural issues).

    Metric TypePurposeLeading ExampleLagging Example
    KPIMeasure performance outcomesTraining completion rateQuarterly profit margin
    KRIMonitor risksOpen CAPAsRegulatory violations
    KBITrack employee behaviorsSafety protocol adherence frequencyEmployee turnover rate

    Building Effective Metrics

    1. Align with Strategy: Ensure metrics tie to Quality System goals. For OKRs, select KPIs/KRIs that directly map to key results.
    2. Balance Leading and Lagging: Use leading indicators to drive proactive adjustments and lagging indicators to validate outcomes.
    3. Pharmaceutical Focus: In quality systems, prioritize metrics like right-first-time rate (leading KPI) and repeat deviation rate (lagging KRI) to balance prevention and accountability.

    By integrating KPIs, KRIs, and KBIs into OKRs, organizations create a feedback loop that connects daily actions to long-term success while mitigating risks. This approach transforms abstract goals into measurable, actionable pathways—a critical advantage in regulated industries like pharmaceuticals.

    Understanding these distinctions empowers teams to not only track performance but also shape it proactively, ensuring alignment with both immediate priorities and strategic vision.