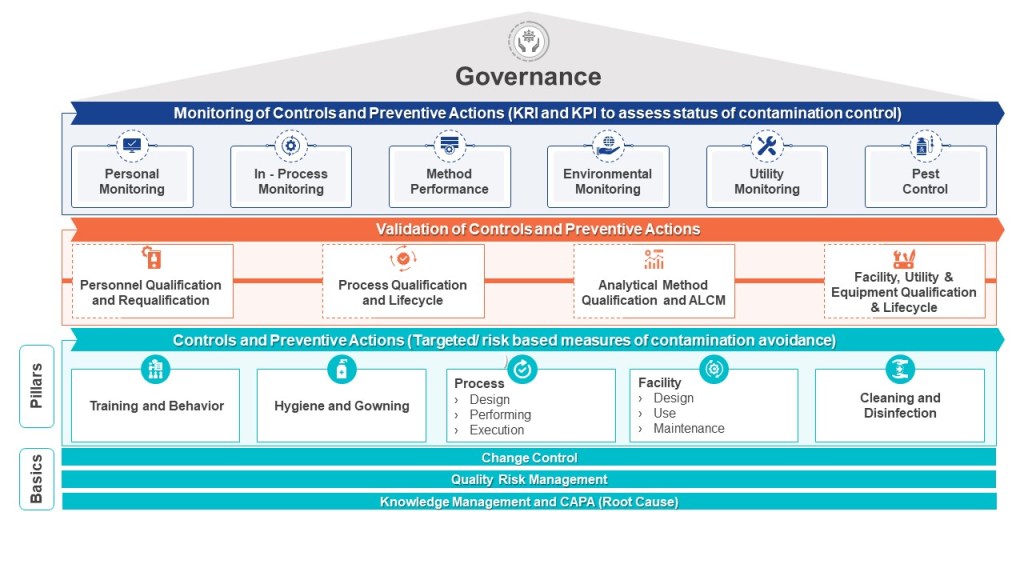
Ineffective risk management and quality systems revolve around superficial risk management. The core issue? Teams designed for compliance as a check-the-box activity rather than cognitive rigor. These gaps create systematic blind spots that no checklist can fix. The solution isn’t more assessors—it’s fewer, more competent ones anchored in science, patient impact, and lived process reality.
Core Roles: The Non-Negotiables
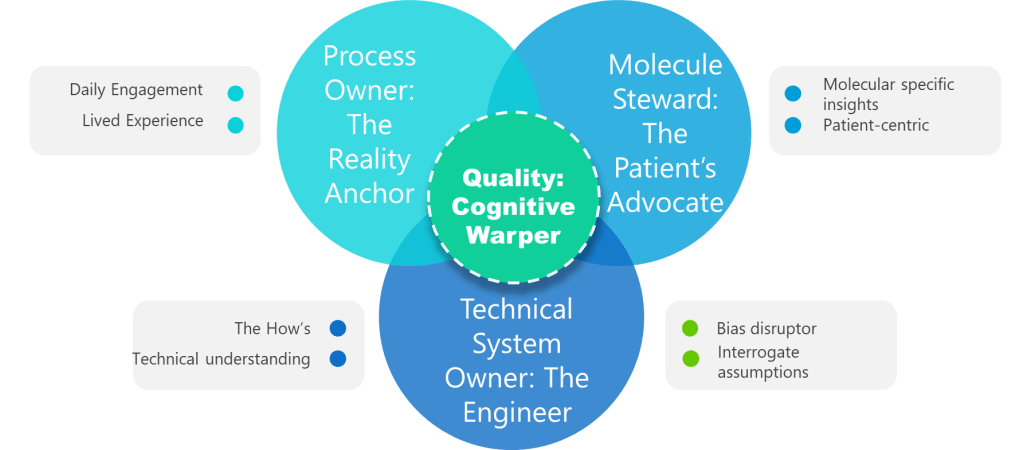
1. Process Owner: The Reality Anchor
Not a title. A lived experience. Superficial ownership creates the “unjustified assumptions.” This role requires daily engagement with the process—not just signature authority. Without it, assumptions go unchallenged.
2. ASTM E2500 Molecule Steward: The Patient’s Advocate
Beyond “SME”—the protein whisperer. This role demands provable knowledge of degradation pathways, critical quality attributes (CQAs), and patient impact. Contrast this with generic “subject matter experts” who lack molecule-specific insights. Without this anchor, assessments overlook patient-centric failure modes.
3. Technical System Owner: The Engineer
The value of the Technical System Owner—often the engineer—lies in their unique ability to bridge the worlds of design, operations, and risk control throughout the pharmaceutical lifecycle. Far from being a mere custodian of equipment, the system owner is the architect who understands not just how a system is built, but how it behaves under real-world conditions and how it integrates with the broader manufacturing program
4. Quality: The Cognitive Warper
Forget the auditor—this is your bias disruptor. Quality’s value lies in forcing cross-functional dialogue, challenging tacit assumptions, and documenting debates. When Quality fails to interrogate assumptions, hazards go unidentified. Their real role: Mandate “assumption logs” where every “We’ve always done it this way” must produce data or die.
Team Design as Knowledge Preservation
Team design in the context of risk management is fundamentally an act of knowledge preservation, not just an exercise in filling seats or meeting compliance checklists. Every effective risk team is a living repository of the organization’s critical process insights, technical know-how, and nuanced operational experience. When teams are thoughtfully constructed to include individuals with deep, hands-on familiarity—process owners, technical system engineers, molecule stewards, and quality integrators—they collectively safeguard the hard-won lessons and tacit knowledge that are so often lost when people move on or retire. This approach ensures that risk assessments are not just theoretical exercises but are grounded in the practical realities that only those with lived experience can provide.
Combating organizational forgetting requires more than documentation or digital knowledge bases; it demands intentional, cross-functional team design that fosters active knowledge transfer. When a risk team brings together diverse experts who routinely interact, challenge each other’s assumptions, and share context from their respective domains, they create a dynamic environment where critical information is surfaced, scrutinized, and retained. This living dialogue is far more effective than static records, as it allows for the continuous updating and contextualization of knowledge in response to new challenges, regulatory changes, and operational shifts. In this way, team design becomes a strategic defense against the silent erosion of expertise that can leave organizations exposed to avoidable risks.
Ultimately, investing in team design as a knowledge preservation strategy is about building organizational resilience. It means recognizing that the greatest threats often arise not from what is known, but from what is forgotten or never shared. By prioritizing teams that embody both breadth and depth of experience, organizations create a robust safety net—one that catches subtle warning signs, adapts to evolving risks, and ensures that critical knowledge endures beyond any single individual’s tenure. This is how organizations move from reactive problem-solving to proactive risk management, turning collective memory into a competitive advantage and a foundation for sustained quality.
Call to Action: Build the Risk Team
Moving from compliance theater to true protection starts with assembling a team designed for cognitive rigor, knowledge depth and psychological safety.
Start with a Clear Charter, Not a Checklist
An excellent risk team exists to frame, analyse and communicate uncertainty so that the business can make science-based, patient-centred decisions. Assigning authorities and accountabilities is a leadership duty, not an after-thought. Before naming people, write down:
- the decisions the team must enable,
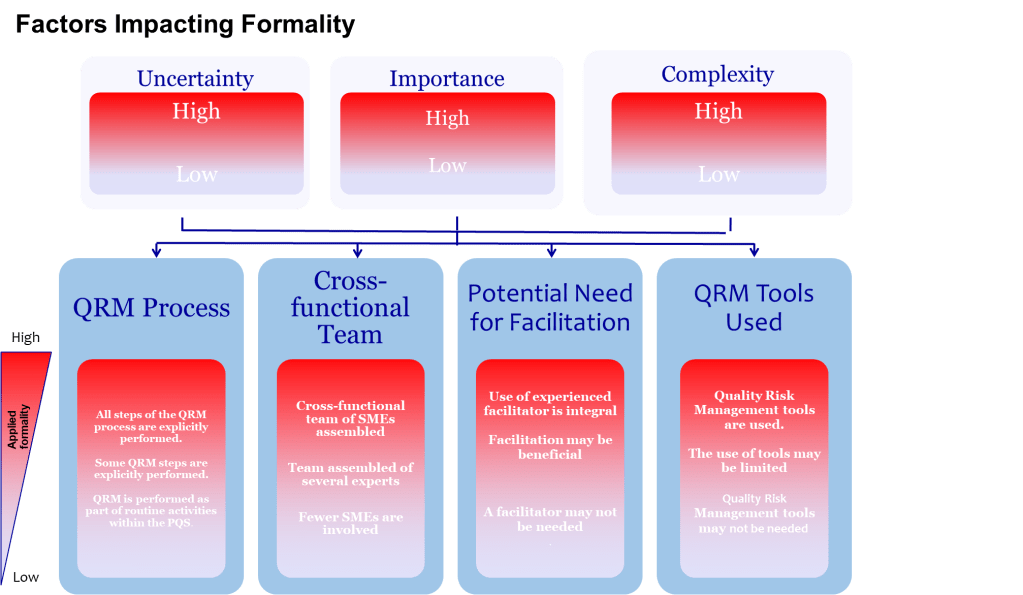
- the degree of formality those decisions demand, and
- the resources (time, data, tools) management will guarantee.
Without this charter, even star performers will default to box-ticking.
Fill Four Core Seats – And Prove Competence
ICH Q9 is blunt: risk work should be done by interdisciplinary teams that include experts from quality, engineering, operations and regulatory affairs. ASTM E2500 translates that into a requirement for documented subject-matter experts (SMEs) who own critical knowledge throughout the lifecycle. Map those expectations onto four non-negotiable roles.
- Process Owner – The Reality Anchor: This individual has lived the operation in the last 90 days, not just signed SOPs. They carry the authority to change methods, budgets and training, and enough hands-on credibility to spot when a theoretical control will never work on the line. Authentic owners dismantle assumptions by grounding every risk statement in current shop-floor facts.
- Molecule Steward – The Patient’s Advocate: Too often “SME” is shorthand for “the person available.” The molecule steward is different: a scientist who understands how the specific product fails and can translate deviations into patient impact. When temperature drifts two degrees during freeze-drying, the steward can explain whether a monoclonal antibody will aggregate or merely lose a day of shelf life. Without this anchor, the team inevitably under-scores hazards that never appear in a generic FMEA template.
- Technical System Owner – The Engineering Interpreter: Equipment does not care about meeting minutes; it obeys physics. The system owner must articulate functional requirements, design limits and integration logic. Where a tool-focused team may obsess over gasket leaks, the system owner points out that a single-loop PLC has no redundancy and that a brief voltage dip could push an entire batch outside critical parameters—a classic case of method over physics.
- Quality Integrator – The Bias Disruptor: Quality’s mission is to force cross-functional dialogue and preserve evidence. That means writing assumption logs, challenging confirmation bias and ensuring that dissenting voices are heard. The quality lead also maintains the knowledge repository so future teams are not condemned to repeat forgotten errors.
Secure Knowledge Accessibility, Not Just Possession
A credentialed expert who cannot be reached when the line is down at 2 a.m. is as useful as no expert at all. Conduct a Knowledge Accessibility Index audit before every major assessment.
Embed Psychological Safety to Unlock the Team’s Brainpower
No amount of SOPs compensates for a culture that punishes bad news. Staff speak up only when leaders are approachable, intolerant of blame and transparent about their own fallibility. Leaders must therefore:
- Invite dissent early: begin meetings with “What might we be overlooking?”
- Model vulnerability: share personal errors and how the system, not individuals, failed.
- Reward candor: recognize the engineer who halted production over a questionable trend.
Psychological safety converts silent observers into active risk sensors.
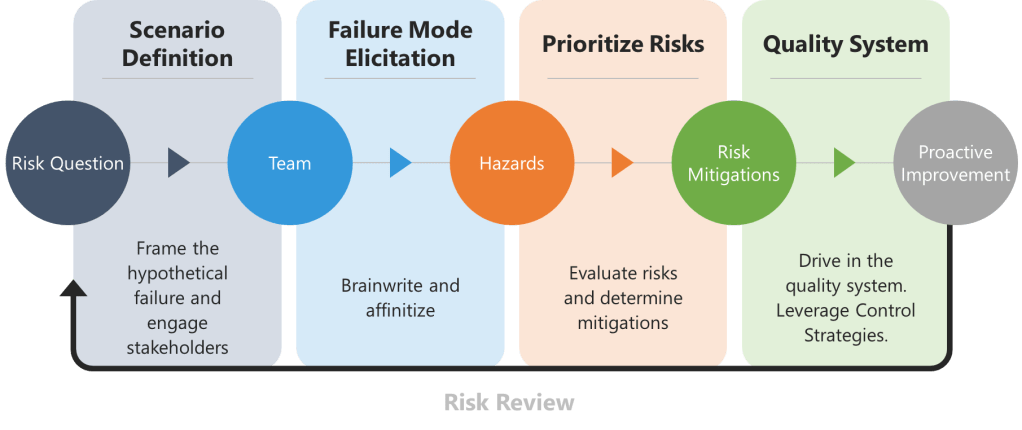
Choose Methods Last, After Understanding the Science
Excellent teams let the problem dictate the tool, not vice versa. They build a failure-tree or block diagram first, then decide whether FMEA, FTA or bow-tie analysis will illuminate the weak spot. If the team defaults to a method because “it’s in the SOP,” stop and reassess. Tool selection is a decision, not a reflex.
Provide Time and Resources Proportionate to Uncertainty
ICH Q9 asks decision-makers to ensure resources match the risk question. Complex, high-uncertainty topics demand longer workshops, more data and external review, while routine changes may only need a rapid check. Resist the urge to shoehorn every assessment into a one-hour meeting because calendars are overloaded.
Institutionalize Learning Loops
Great teams treat every assessment as both analysis and experiment. They:
- Track prediction accuracy: did the “medium”-ranked hazard occur?
- Compare expected versus actual detectability: were controls as effective as assumed?
- Feed insights into updated templates and training so the next team starts smarter.
The loop closes when the knowledge base evolves at the same pace as the plant.
When to Escalate – The Abort-Mission Rule
If a risk scenario involves patient safety, novel technology and the molecule steward is unavailable, stop. The assessment waits until a proper team is in the room. Rushing ahead satisfies schedules, not safety.
Conclusion
Excellence in risk management is rarely about adding headcount; it is about curating brains with complementary lenses and giving them the culture, structure and time to think. Build that environment and the monsters stay on the storyboard, never in the plant.