
Best Practices for Managing the Life-Cycle of Single-Use Systems

Single-use systems (SUS) have become increasingly prevalent in biopharmaceutical manufacturing due to their flexibility, reduced contamination risk, and cost-effectiveness. The thing is, management of the life-cycle of single-use systems becomes critical and is an area organizations can truly screw up by cutting corners. To do it right requires careful collaboration between all stakeholders in the supply chain, from raw material suppliers to end users.

Design and Development

Apply Quality by Design (QbD) principles from the outset by focusing on process understanding and the design space to create controlled and consistent manufacturing processes that result in high-quality, efficacious products. This approach should be applied to SUS design.

ASTM E3051 “Standard guide for specification, design, verification, and application of SUS in pharmaceutical and biopharmaceutical manufacturing” provides an excellent framework for the design process.

Make sure to conduct thorough risk assessments, considering potential failure modes and effects throughout the SUS life-cycle.

Engage end-users early to understand their specific requirements and process constraints. A real mistake in organizations is not involving the end-users early enough. From the molecule steward to manufacturing these users are critical.

    Raw Material and Component Selection

    Carefully evaluate and qualify raw materials and components. Work closely with suppliers to understand material properties, extractables/leachables profiles, and manufacturing processes.

    Develop comprehensive specifications for critical materials and components. ASTM E3244 is handy place to look for guidance on raw material qualification for SUS.

    Manage the Supplier through Manufacturing and Assembly

    Implementing robust supplier qualification and auditing programs and establish change control agreements with suppliers to be notified of any changes that could impact SUS performance or quality. It is important the supplier have a robust quality management system and that they apply Good Manufacturing Practices (GMP) through their facilities. Ensure they have in place appropriate controls to

    • Validate sterilization processes
    • Conduct routine bioburden and endotoxin testing
    • Design packaging to protect SUS during transportation and storage. Shipping methods need to protect against physical damage and temperature excursions
    • Establish appropriate storage conditions and shelf-life based on stability studies
    • Provide appropriate labeling and traceability
    • Have appropriate inventory controls. Ideally select suppliers who understand the importance of working with you for collaborative planning, forecasting and replenishment (CPFR)

    Testing and Qualification

    Develop a comprehensive testing strategy, including integrity testing and conduct extractables and leachables studies following industry guidelines. Evaluate the suppliers shipping and transportation studies to evaluate SUS robustness and determine if you need additional studies.

      Implementation and Use

      End users should have appropriate and comprehensive documentation and training to end users on proper handling, installation, and use of SUS. These procedures should include how to perform pre-use integrity testing at the point of use as well as how to perform thorough in-process and final inspections.

      Consider implementing automated visual inspection systems and other appropriate monitoring.

      Implement appropriate environmental monitoring programs in SUS manufacturing areas. While the dream of manufacturing outdoors is a good one, chances are we aren’t even close yet. Don’t short this layer of control.

        Continuous Improvement

        Ensure you have appropriate mechanisms in place to gather data on SUS performance and any issues encountered during use. Share relevant information across the supply chain to drive improvements.

        Conduct periodic audits of suppliers and manufacturing facilities.

        Stay updated on evolving regulatory guidance and industry best practices. There is still a lot changing in this space.
        Health of the Validation Program

        In the Metrics Plan for Facility, Utility, System and Equipment that is being developed a focus is on effective commissioning, qualification, and validation processes.

        To demonstrate the success of a CQV program we might brainstorm the following metrics.

        Deviation and Non-Conformance Rates

        • Track the number and severity of deviations related to commissioned, qualified and validated processes and FUSE elements.
        • The effectiveness of CAPAs that involve CQV elements

        Change Control Effectiveness

        • Measure the number of successful changes implemented without issues
        • Track the time taken to implement and qualify validate changes

        Risk Reduction

        • Quantify the reduction in high and medium risks identified during risk assessments as a result of CQV activities
        • Monitor the effectiveness of risk mitigation strategies

        Training and Competency

        • Measure the percentage of personnel with up-to-date training on CQV procedures
        • Track competency assessment scores for key validation personnel

        Documentation Quality

        • Measure the number of validation discrepancies found during reviews
        • Track the time taken to approve validation documents

        Supplier Performance

        • Monitor supplier audit results related to validated systems or components
        • Track supplier-related deviations or non-conformances

        Regulatory Inspection Outcomes

        • Track the number and severity of validation-related observations during inspections
        • Measure the time taken to address and close out regulatory findings

        Cost and Efficiency Metrics

        • Measure the time and resources required to complete validation activities
        • Track cost savings achieved through optimized CQV approaches

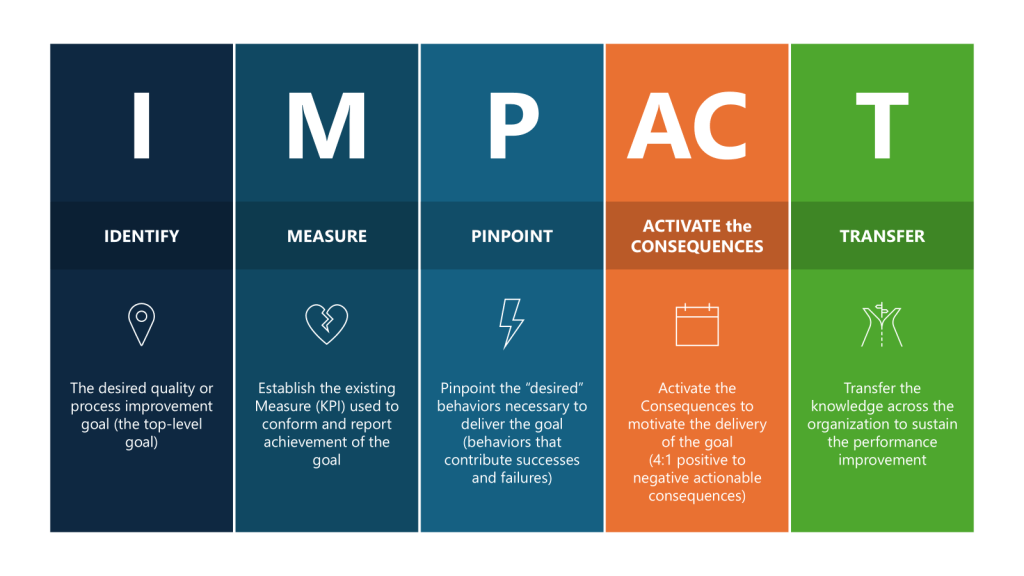
        By tracking these metrics, we might be able to demonstrate a comprehensive and effective CQV program that aligns with regulatory expectations. Or we might just spend time measuring stuff that may not be tailored to our individual company’s processes, products, and risk profile. And quite frankly, will they influence the system the way we want? It’s time to pull out an IMPACT key behavior analysis to help us tailor a right-sized set of metrics.

        The first thing to do is to go to first principles, to take a big step back and ask – what do I really want to improve?

        The purpose of a CQV program is to provide documented evidence that facilities, systems, equipment and processes have been designed, installed and operate in accordance with predetermined specifications and quality attributes:

        • To verify that critical aspects of a facility, utility system, equipment or process meet approved design specifications and quality attributes.
        • To demonstrate that processes, equipment and systems are fit for their intended use and perform as expected to consistently produce a product meeting its quality attributes.
        • To establish confidence that the manufacturing process is capable of consistently delivering quality product.
        • To identify and understand sources of variability in the process to better control it.
        • To detect potential problems early in development and prevent issues during routine production.

        The ultimate measure of success is demonstrating and maintaining a validated state that ensures consistent production of safe and effective products meeting all quality requirements. 

        Focusing on the Impact is important. What are we truly concerned about for our CQV program. Based on that we come up with two main factors:

        1. The level of deviations that stem from root causes associated with our CQV program
        2. The readiness of FUSE elements for use (project adherence)

        Reducing Deviations from CQV Activities

        First, we gather data, what deviations are we looking for? These are the types of root causes that we will evaluate. Of course, your use of the 7Ms may vary, this list is to start conversation.

          Means  Automation or Interface Design Inadequate/DefectiveValidated machine or computer system interface or automation failed to meet specification due to inadequate/defective design.
          Means  Preventative Maintenance InadequateThe preventive maintenance performed on the equipment was insufficient or not performed as required.
          MeansPreventative Maintenance Not DefinedNo preventive maintenance is defined for the equipment used.
          MeansEquipment Defective/Damaged/FailureThe equipment used was defective or a specific component failed to operate as intended.
          Means  Equipment IncorrectEquipment required for the task was set up or used incorrectly or the wrong equipment was used for the task.
          Means  Equipment Design Inadequate/DefectiveThe equipment was not designed or qualified to perform the task required or the equipment was defective, which prevented its normal operation.
        MediaFacility DesignImproper or inadequate layout or construction of facility, area, or work station.
          MethodsCalibration Frequency is Not Sufficient/DeficiencyCalibration interval is too long and/or calibration schedule is lacking.
          Methods  Calibration/Validation ProblemAn error occurred because of a data collection- related issue regarding calibration or validation.
        MethodsSystem / Process Not DefinedThe system/tool or the defined process to perform the task does not exist.

        Based on analysis of what is going on we can move into using a why-why technique to look at our layers.

        Why 1Why are deviations stemming from CQV events not at 0%
        Because unexpected issues or discrepancies arise after the commissioning, qualification, or validation processes

        Success factor needed for this step: Effectiveness of the CQV program

        Metric for this step: Adherence to CQV requirements
        Why 2 (a)Why are unexpected issues arising after CQV?
        Because of inadequate planning and resource constraints in the CQV process.

        Success Factor needed for this step: Appropriate project and resource planning

        Metric for this Step: Resource allocation
        Why 3 (a)Why are we not performing adequate resource planning?
        Because of the tight project timelines, and the involvement of multiple stakeholders with different areas of expertise

        Success Factor needed for this step: Cross-functional governance to implement risk methodologies to focus efforts on critical areas

        Metric for this Step: Risk Coverage Ratio measuring the percentage of identified critical risks that have been properly assessed and and mitigated through the cross-functional risk management process. This metric helps evaluate how effectively the governance structure is addressing the most important risks facing the organization.
        Why 2 (b)Why are unexpected issues arising after CQV?
        Because of poorly executed elements of the CQV process stemming from poorly written procedures and under-qualified staff.

        Success Factor needed for this step: Process Improvements and Training Qualification

        Metric for this Step: Performance to Maturity Plan

        There were somethings I definitely glossed over there, and forgive me for not providing numbers there, but I think you get the gist.

        So now I’ve identified the I – How do we improve reliability of our CQV program, measured by reducing deviations. Let’s break out the rest.

        ParametersExecuted for CQV
        IDENTIFYThe desired quality or process improvement goal (the top-level goal)Improve the effectiveness of the CQV program by taking actions to reduce deviations stemming from verification of FUSE and process.
        MEASUREEstablish the existing Measure (KPI) used to conform and report achievement of the goalSet a target reduction of deviations related to CQV activities.
        PinpointPinpoint the “desired” behaviors necessary to deliver the goal (behaviors that contribute successes and failures)Drive good project planning and project adherence.

        Promote and coach for enhanced attention to detail where “quality is everyone’s job.”

        Encourage a speak-up culture where concerns, issues or suggestions are shared in a timely manner in a neutral constructive forum.
        ACTIVATE the CONSEQUENCESActivate the Consequences to motivate the delivery of the goal
        (4:1 positive to negative actionable consequences)
        Organize team briefings on consequences

        Review outcomes of project health

        Senior leadership celebrate/acknowledge

        Acknowledge and recognize improvements

        Motivate the team through team awards

        Measure success on individual deliverables through a Rubric
        TRANSFERTransfer the knowledge across the organization to sustain the performance improvementCreate learning teams

        Lessons learned are documented and shared

        Lunch-and-learn sessions

        Create improvement case studies

        From these two exercises I’ve now identified my lagging and leading indicators at the KPI and the KBI level.

        Not all Equipment is Category 3 in GAMP5

        I think folks tend to fall into a trap when it comes to equipment and GAMP5, automatically assuming that because it is equipment it must be Category 3. Oh, how that can lead to problems.

        When thinking about equipment it is best to think in terms of “No Configuration” and ” Low Configuration” software. This terminology is used to describe software that requires little to no configuration or customization to meet the user’s needs.

        No Configuration(NoCo) aligns with GAMP 5 Category 3 software, which is described as “Non-Configured Products”. These are commercial off-the-shelf software applications that are used as-is, without any customization or with only minimal parameter settings. My microwave is NoCo.

        Low Configuration(LoCo) typically falls between Category 3 and Category 4 software. It refers to software that requires some configuration, but not to the extent of fully configurable systems. My PlayStation is LoCo.

        The distinction between these categories is important for determining the appropriate validation approach:

        • Category 3 (NoCo) software generally requires less extensive validation efforts, as it is used without significant modifications. Truly it can be implicit testing.
        • Software with low configuration may require a bit more scrutiny in validation, but still less than fully configurable or custom-developed systems.

        Remember that GAMP 5 emphasizes a continuum approach rather than strict categorization. The level of validation effort should be based on the system’s impact on patient safety, product quality, and data integrity, as well as the extent of configuration or customization.

        When is Something Low Configuration?

        Low Configuration refers to software that requires minimal setup or customization to meet user needs, falling between Category 3 (Non-Configured Products) and Category 4 (Configured Products) software. Here’s a breakdown of what counts as low configuration:

        1. Parameter settings: Software that allows basic parameter adjustments without altering core functionality.
        2. Limited customization: Applications that permit some tailoring to specific workflows, but not extensive modifications.
        3. Standard modules: Software that uses pre-built, configurable modules to adapt to business processes.
        4. Default configurations: Systems that can be used with supplier-provided default settings or with minor adjustments.
        5. Simple data input: Applications that allow input of specific data or ranges, such as electronic chart recorders with input ranges and alarm setpoints.
        6. Basic user interface customization: Software that allows minor changes to the user interface without altering underlying functionality.
        7. Report customization: Systems that permit basic report formatting or selection of data fields to display.
        8. Simple workflow adjustments: Applications that allow minor changes to predefined workflows without complex programming.

        It’s important to note that the distinction between low configuration and more extensive configuration (Category 4) can sometimes be subjective. The key is to assess the extent of configuration required and its impact on the system’s core functionality and GxP compliance. Organizations should document their rationale for categorization in system risk assessments or validation plans.

        AttributeCategory 3 (No Configuration)Low ConfigurationCategory 4
        Configuration LevelNo configurationMinimal configurationExtensive configuration
        Parameter SettingsFixed or minimalBasic adjustmentsComplex adjustments
        CustomizationNoneLimitedExtensive
        ModulesPre-built, non-configurableStandard, slightly configurableHighly configurable
        Default SettingsUsed as-isMinor adjustmentsSignificant modifications
        Data InputFixed formatSimple data/range inputComplex data structures
        User InterfaceFixedBasic customizationExtensive customization
        Workflow AdjustmentsNoneMinor changesSignificant alterations
        User Account ManagementBasic, often single-userLimited user roles and permissionsAdvanced user management with multiple roles and access levels
        Report CustomizationPre-defined reportsBasic formatting/field selectionAdvanced report design
        Example EquipmentpH meterElectronic chart recorderChromatography data system
        Validation EffortMinimalModerateExtensive
        Risk LevelLowLow to MediumMedium to High
        Supplier DocumentationHeavily relied uponPartially relied uponSupplemented with in-house testing

        Here’s the thing to be aware of, a lot of equipment these days is more category 4 than 3, as the manufacturers include all sorts of features, such as user account management and trending and configurable reports. And to be frank, I’ve seen too many situations where Programmable Logic Controllers (PLCs) didn’t take into account all that configuration from standard function libraries to control specific manufacturing processes.

        Your methodology needs to keep up with the technological growth curve.

        Risk Assessments as part of Design and Verification

        Facility design and manufacturing processes are complex, multi-stage operations, fraught with difficulty. Ensuring the facility meets Good Manufacturing Practice (GMP) standards and other regulatory requirements is a major challenge. The complex regulations around biomanufacturing facilities require careful planning and documentation from the earliest design stages. 

        Which is why consensus standards like ASTM E2500 exist.

        Central to these approaches are risk assessment, to which there are three primary components:

        • An understanding of the uncertainties in the design (which includes materials, processing, equipment, personnel, environment, detection systems, feedback control)
        • An identification of the hazards and failure mechanisms
        • An estimation of the risks associated with each hazard and failure

        Folks often get tied up on what tool to use. Frankly, this is a phase approach. We start with a PHA for design, an FMEA for verification and a HACCP/Layers of Control Analysis for Acceptance. Throughout we use a bow-tie for communication.

        AspectBow-TiePHA (Preliminary Hazard Analysis)FMEA (Failure Mode and Effects Analysis)HACCP (Hazard Analysis and Critical Control Points)
        Primary FocusVisualizing risk pathwaysEarly hazard identificationPotential failure modesSystematically identify, evaluate, and control hazards that could compromise product safety
        Timing in ProcessAny stageEarly developmentAny stage, often designThroughout production
        ApproachCombines causes and consequencesTop-downBottom-upSystematic prevention
        ComplexityModerateLow to moderateHighModerate
        Visual RepresentationCentral event with causes and consequencesTabular formatTabular formatFlow diagram with CCPs
        Risk QuantificationCan include, not requiredBasic risk estimationRisk Priority Number (RPN)Not typically quantified
        Regulatory AlignmentLess common in pharmaAligns with ISO 14971Widely accepted in pharmaLess common in pharma
        Critical PointsIdentifies barriersDoes not specifyIdentifies critical failure modesIdentifies Critical Control Points (CCPs)
        ScopeSpecific hazardous eventSystem-level hazardsComponent or process-level failuresProcess-specific hazards
        Team RequirementsCross-functionalLess detailed knowledge neededDetailed system knowledgeFood safety expertise
        Ongoing ManagementCan be used for monitoringOften updated periodicallyRegularly updatedContinuous monitoring of CCPs
        OutputVisual risk scenarioList of hazards and initial risk levelsPrioritized list of failure modesHACCP plan with CCPs
        Typical Use in PharmaRisk communicationEarly risk identificationDetailed risk analysisProduct Safety/Contamination Control

        At BOSCON this year I’ll be talking about this fascinating detail, perhaps too much detail.

        Retrospective Validation Doesn’t Really Exist

        A recent FDA Warning Letter really drove home a good point about the perils of ‘retrospective validation’ and how that normally doesn’t mean what folks want it to mean.

        “In lieu of process validation studies, you attempted to retrospectively review past batches without scientifically establishing blend uniformity and other critical process performance indicators. You do not commit to conduct further process performance qualification studies that scientifically establish the ability of your manufacturing process to consistently yield finished products that meet their quality attributes.”

        The FDA’s response here is important for three truths:

        1. Validation needs to be done against critical quality attributes and critical process parameters to scientifically establish that the manufacturing process is consistent.
        2. Batch data on its own is rather useless.
        3. Validation is a continuous exercise, it is not once-and-done (or rather in most people’s view thrice-and-done).

        I don’t think the current GMPs really allow the concept of retrospective validation as most people want it to mean (including the recipient of that warning letter). It’s probably a term we should go into the big box of Nope.

        AI generated art

        Retrospective validation as most people mean it is a type of process validation that involves evaluating historical data and records to demonstrate that an existing process consistently produces products meeting predetermined specifications. As an approach retrospective validation involves evaluating historical data and records to demonstrate that an existing process consistently produces products meeting predetermined specifications. 

        The problem here is that this really just tells you what you were already hoping was true.

        Retrospective validation has some major flaws:

        1. Limited control over data quality and completeness: Since retrospective validation relies on historical data, there may be gaps or inconsistencies in the available information. The data may not have been collected with validation in mind, leading to missing critical parameters or measurements. It rather throws out most of the principles of science.
        2. Potential bias in existing data: Historical data may be biased or incomplete, as it was not collected specifically for validation purposes. This can make it difficult to draw reliable conclusions about process performance and consistency.
        3. Difficulty in identifying and addressing hidden flaws: Since the process has been in use for some time, there may be hidden flaws or issues that have not been identified or challenged. These could potentially lead to non-conforming products or hazardous operating conditions.
        4. Difficulty in recreating original process conditions: It may be challenging to accurately recreate or understand the original process conditions under which the historical data was generated, potentially limiting the validity of conclusions drawn from the data.

        What is truly called for is to perform concurrent validation.