PDCA and OODA

PDCA (and it’s variants) are a pretty tried and true model for process improvement. In the PDCA model a plan is structured in four steps: P (plan) D (do) C (check) A (act). The intention is create a structured cycle that allows the process to flow in accordance with the objectives to be achieved (P), execute what was planned (D), check whether the objectives were achieved with emphasis on the verification of what went right and what went wrong (C) and identify factors of success or failure to feed a new process of planning (A).

Conceptually, the organization will be a fast turning wheel of endlessly learning from mistakes and seeking to maximize processes in order to remain forever in pursuit of strategic objectives, endlessly searching for the maximum efficiency and effectiveness of the system.
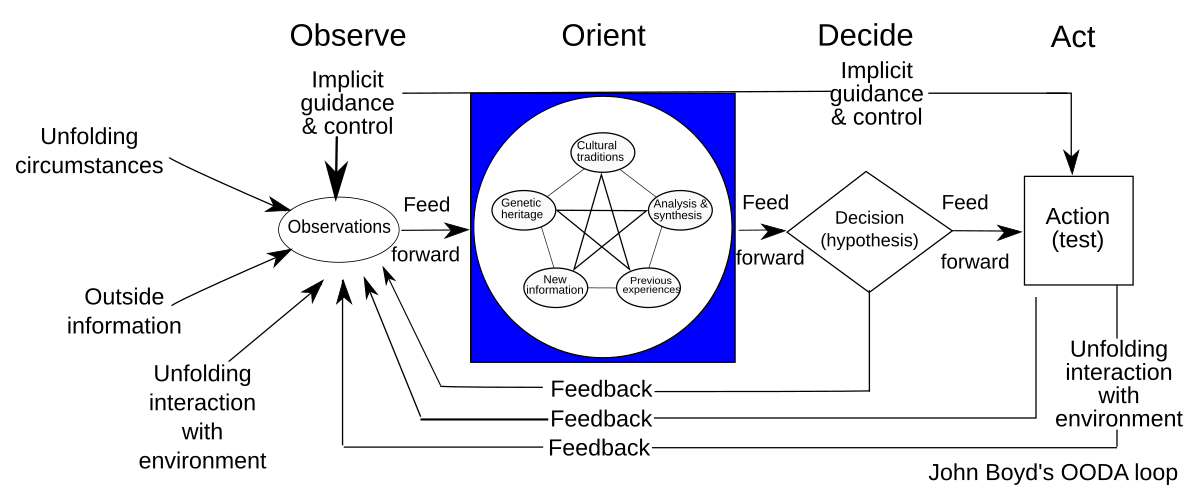
The OODA Loop

The OODA loop or cycle was designed by John R. Boyd and consists of a cycle of four phases:
Observe, Orient, Decide and Act (OODA).

  • Observe: Based on implicit guidance and control, observations are made regarding unfolding circumstances, outside information, and dynamic interaction with the environment (including the result of prior actions).
  • Orient: Observations from the prior stage are deconstructed into separate component
    pieces; then synthesized and analyzed in several contexts such as cultural traditions, genetic
    heritage, and previous experiences; and then combined together for the purposes of
    analysis and synthesis to inform the next phase.
  • Decide: In this phase, hypotheses are evaluated, and a decision is made.
  • Act: Based on the decision from the prior stage, action is taken to achieve a desired effect
    or result

While similar to the PDCA improvement of a known system making it more effective, efficient or effective (depending on the effect to be expected), the OODA strives to model a framework for situational awareness.

Boyd’s concentration on the specific set of circumstances relevant to military situations had for years meant the OODA loop has not received a lot of wide spread interest. I’ve been seeing a lot of recent adaptations of the OODA loop try to expand to address the needs of operating in volatile, uncertain, complex and ambiguous (VUCA) situations. I especially like seeing it as part of resilience and business continuity.

Enhanced Decision-Making Speed and Agility

    The OODA loop enables organizations to make faster, more informed decisions in rapidly changing environments. By continuously cycling through the observe-orient-decide-act process, organizations can respond more quickly to market crises, threats, and emerging opportunities.

    Improved Situational Awareness

      The observation and orientation phases help organizations maintain a comprehensive understanding of their operating environment. This enhanced situational awareness allows us to identify trends, threats, and opportunities more effectively.

      Better Adaptability to Change

        The iterative nature of the OODA loop promotes continuous learning and adaptation. This fosters a culture of flexibility and responsiveness, enabling organizations to adjust their strategies and operations as circumstances evolve.

        Enhanced Crisis Management

          In high-pressure situations or crises, the OODA loop provides a structured approach for rapid, effective decision-making. This can be invaluable for managing unexpected challenges or emergencies.

          Improved Team Coordination and Communication

            The OODA process encourages clear communication and coordination among team members as they move through each phase. This can lead to better team cohesion and more effective execution of strategies.

            Data-Driven Culture

              The OODA loop emphasizes the importance of observation and orientation based on current data. This promotes a data-driven culture where decisions are made based on real-time information rather than outdated assumptions.

              Continuous Improvement

                The cyclical nature of the OODA loop supports ongoing refinement of processes and strategies. Each iteration provides feedback that can be used to improve future observations, orientations, decisions, and actions.

                Complementary Perspectives

                PDCA is typically used for long-term, systematic improvement projects, while OODA is better suited for rapid decision-making in dynamic environments. Using both allows organizations to address both strategic and tactical needs.

                Integration Points

                1. Observation and Planning
                  • OODA’s “Observe” step can feed into PDCA’s “Plan” phase by providing real-time situational awareness.
                  • PDCA’s structured planning can enhance OODA’s orientation process.
                2. Execution
                  • PDCA’s “Do” phase can incorporate OODA loops for quick adjustments during implementation.
                  • OODA’s “Act” step can trigger a new PDCA cycle for more comprehensive improvements.
                3. Evaluation
                  • PDCA’s “Check” phase can use OODA’s observation techniques for more thorough assessment.
                  • OODA’s rapid decision-making can inform PDCA’s “Act” phase for faster course corrections.

                Pillars of Good Data

                One thing we should all agree with is that we need reliable reliable, accurate, and trustworthy data. Which is why we strive for the principles of data governance, data quality, and data integrity, three interconnected concepts that work together to create a robust data management framework.

                Overarching Framework: Data Governance

                Data governance serves as the overarching framework that establishes the policies, procedures, and standards for managing data within an organization. It provides the structure and guidance necessary for effective data management, including:

                • Defining roles and responsibilities for data management
                • Establishing data policies and standards
                • Creating processes for data handling and decision-making
                • Ensuring compliance with regulations and internal policies

                Data governance sets the stage for both data quality and data integrity initiatives by providing the necessary organizational structure and guidelines.

                Data Quality: Ensuring Fitness for Purpose

                Within the data governance framework, data quality focuses on ensuring that data is fit for its intended use. This involves:

                • Assessing data against specific quality dimensions (e.g., accuracy, completeness, consistency, validity, timeliness)
                • Implementing data cleansing and standardization processes
                • Monitoring and measuring data quality metrics
                • Continuously improving data quality through feedback loops and corrective actions

                Data quality initiatives are guided by the policies and standards set forth in the data governance framework, ensuring that quality efforts align with organizational goals and requirements.

                Data Integrity: Maintaining Trustworthiness

                Data integrity works in tandem with data quality to ensure that data remains accurate, complete, consistent, and reliable throughout its lifecycle. The ALCOA+ principles, widely used in regulated industries, provide a comprehensive framework for ensuring data integrity.

                ALCOA+ Principles

                Attributable: Ensuring that data can be traced back to its origin and the individual responsible for its creation or modification.

                Legible: Maintaining data in a clear, readable format that is easily understandable.

                Contemporaneous: Recording data at the time of the event or observation to ensure accuracy and prevent reliance on memory.

                Original: Preserving the original record or a certified true copy to maintain data authenticity.

                Accurate: Ensuring data correctness and freedom from errors.

                Complete: Capturing all necessary information without omissions.

                Consistent: Maintaining data coherence across different systems and over time.

                Enduring: Preserving data for the required retention period in a format that remains accessible.

                Available: Ensuring data is readily accessible when needed for review or inspection.

                Additional Data Integrity Measures

                Security Measures: Implementing robust security protocols to protect data from unauthorized access, modification, or deletion.

                Data Lineage Tracking: Establishing systems to monitor and document data transformations and origins throughout its lifecycle.

                Auditability: Ensuring data changes are traceable through comprehensive logging and change management processes.

                Data Consistency: Maintaining uniformity of data across various systems and databases.

                Data integrity measures are often defined and enforced through data governance policies, while also supporting data quality objectives by preserving the accuracy and reliability of data. By adhering to the ALCOA+ principles and implementing additional integrity measures, organizations can ensure their data remains trustworthy and compliant with regulatory requirements.

                Synergy in Action

                The collaboration between these three elements can be illustrated through a practical example:

                1. Data Governance Framework: An organization establishes a data governance committee that defines policies for GxP data management, including data quality standards and security requirements.
                2. Data Quality Initiative: Based on the governance policies, the organization implements data quality checks to ensure GxP information is accurate, complete, and up-to-date. This includes:
                  • Regular data profiling to identify quality issues
                  • Data cleansing processes to correct errors
                  • Validation rules to prevent the entry of incorrect data
                3. Data Integrity Measures: To maintain the trustworthiness of GxP data, the organization:
                  • Implements access controls to prevent unauthorized modifications
                  • Qualifies system to meet ALCOA+ requirements
                  • Establishes audit trails to track changes to GxP records

                By working together, these elements ensure that:

                • GxP data meets quality standards (data quality)
                • The data remains has a secure and unaltered lineage (data integrity)
                • All processes align with organizational policies and regulatory requirements (data governance)

                Continuous Improvement Cycle

                The relationship between data governance, quality, and integrity is not static but forms a continuous improvement cycle:

                1. Data governance policies inform data quality and integrity standards.
                2. Data quality assessments and integrity checks provide feedback on the effectiveness of governance policies.
                3. This feedback is used to refine and improve governance policies, which in turn enhance data quality and integrity practices.

                This ongoing cycle ensures that an organization’s data management practices evolve to meet changing business needs and technological advancements.

                Data governance, data quality, and data integrity work together as a cohesive system to ensure that an organization’s data is not only accurate and reliable but also properly managed, protected, and utilized in alignment with business objectives and regulatory requirements. This integrated approach is essential for organizations seeking to maximize the value of their data assets while minimizing risks associated with poor data management.

                A GMP Application based on ISA S88.01

                A great example of Data governance is applying ISA S88.01 to enhance batch control processes and improve overall manufacturing operations.

                Data Standardization and Structure

                ISA S88.01 provides a standardized framework for batch control, including models and terminology that define the physical, procedural, and recipe aspects of batch manufacturing. This standardization directly supports data governance efforts by:

                • Establishing a common language for batch processes across the organization
                • Defining consistent data structures and hierarchies
                • Facilitating clear communication between different departments and systems

                Improved Data Quality

                By following the ISA S88.01 standard, organizations can ensure higher data quality throughout the batch manufacturing process:

                • Consistent Data Collection: The standard defines specific data points to be collected at each stage of the batch process, ensuring comprehensive and uniform data capture.
                • Traceability: ISA S88.01 enables detailed tracking of each phase of the batch process, including raw materials used, process parameters, and quality data.
                • Data Integrity: The structured approach helps maintain data integrity by clearly defining data sources, formats, and relationships.

                Enhanced Data Management

                The ISA S88.01 model supports effective data management practices:

                • Modular Approach: The standard’s modular structure allows for easier management of data related to specific equipment, procedures, or recipes.
                • Scalability: As processes or equipment change, the modular nature of ISA S88.01 facilitates easier updates to data structures and governance policies.
                • Data Lifecycle Management: The standard’s clear delineation of process stages aids in managing data throughout its lifecycle, from creation to archival.

                Regulatory Compliance

                ISA S88.01 supports data governance efforts related to regulatory compliance:

                • Audit Trails: The standard’s emphasis on traceability aligns with regulatory requirements for maintaining detailed records of batch processes.
                • Consistent Documentation: Standardized terminology and structures facilitate the creation of consistent, compliant documentation.

                Decision Support and Analytics

                The structured data approach of ISA S88.01 enhances data governance initiatives aimed at improving decision-making:

                • Data Integration: The standard facilitates easier integration of batch data with other enterprise systems, supporting comprehensive analytics.
                • Performance Monitoring: Standardized data structures enable more effective monitoring and comparison of batch processes across different units or sites.

                Continuous Improvement

                Both data governance and ISA S88.01 support continuous improvement efforts:

                • Process Optimization: The structured data from ISA S88.01 compliant systems can be more easily analyzed to identify areas for process improvement.
                • Knowledge Management: The standard terminology and models facilitate better knowledge sharing and retention within the organization.

                By leveraging ISA S88.01 in conjunction with robust data governance practices, organizations can create a powerful framework for managing batch processes, ensuring data quality, and driving operational excellence in manufacturing environments.

                CRLs Should List the Third Party Manufacturer

                It probably is good for the public interest, and frankly for the manufacturing ecosystem, for the FDA to be directed (and given the authority) to disclose the third party whose “facility-related deficiencies” identified during a Current Good Manufacturing Practices (cGMP) results in a CRL.

                A little public shaming would probably help deal with widespread structural deficiencies amongst CDMOs.

                Something certainly needs to happen, this is happening way to often.

                Photo by Leah Newhouse on Pexels.com

                Risk Management for the 4 Levels of Controls for Product

                There are really 4 layers of protection for our pharmaceutical product.

                1. Process controls
                2. Equipment controls
                3. Operating procedure controls
                4. Production environment controls

                These individually and together are evaluated as part of the HACCP process, forming our layers of control analysis.

                Process Controls:

                  • Conduct a detailed hazard analysis for each step in the production process
                  • Identify critical control points (CCPs) where hazards can be prevented, eliminated or reduced
                  • Establish critical limits for each CCP (e.g. time/temperature parameters)
                  • Develop monitoring procedures to ensure critical limits are met
                  • Establish corrective actions if critical limits are not met
                  • Validate and verify the effectiveness of process controls

                  Equipment Controls:

                    • Evaluate equipment design and materials for hazards
                    • Establish preventive maintenance schedules
                    • Develop sanitation and cleaning procedures for equipment
                    • Calibrate equipment and instruments regularly
                    • Validate equipment performance for critical processes
                    • Establish equipment monitoring procedures

                    Operating Procedure Controls:

                      • Develop standard operating procedures (SOPs) for all key tasks
                      • Create good manufacturing practices (GMPs) for personnel
                      • Establish hygiene and sanitation procedures
                      • Implement employee training programs on contamination control
                      • Develop recordkeeping and documentation procedures
                      • Regularly review and update operating procedures

                      Production Environment Controls:

                        • Design facility layout to prevent cross-contamination
                        • Establish zoning and traffic patterns
                        • Implement pest control programs
                        • Develop air handling and filtration systems
                        • Create sanitation schedules for production areas
                        • Monitor environmental conditions (temperature, humidity, etc.)
                        • Conduct regular environmental testing

                        The key is to use a systematic, science-based approach to identify potential hazards at each layer and implement appropriate preventive controls. The controls should be validated, monitored, verified and documented as part of the overall contamination control strategy (system). Regular review and updates are needed to ensure the controls remain effective.

                        Health of the Validation Program

                        In the Metrics Plan for Facility, Utility, System and Equipment that is being developed a focus is on effective commissioning, qualification, and validation processes.

                        To demonstrate the success of a CQV program we might brainstorm the following metrics.

                        Deviation and Non-Conformance Rates

                        • Track the number and severity of deviations related to commissioned, qualified and validated processes and FUSE elements.
                        • The effectiveness of CAPAs that involve CQV elements

                        Change Control Effectiveness

                        • Measure the number of successful changes implemented without issues
                        • Track the time taken to implement and qualify validate changes

                        Risk Reduction

                        • Quantify the reduction in high and medium risks identified during risk assessments as a result of CQV activities
                        • Monitor the effectiveness of risk mitigation strategies

                        Training and Competency

                        • Measure the percentage of personnel with up-to-date training on CQV procedures
                        • Track competency assessment scores for key validation personnel

                        Documentation Quality

                        • Measure the number of validation discrepancies found during reviews
                        • Track the time taken to approve validation documents

                        Supplier Performance

                        • Monitor supplier audit results related to validated systems or components
                        • Track supplier-related deviations or non-conformances

                        Regulatory Inspection Outcomes

                        • Track the number and severity of validation-related observations during inspections
                        • Measure the time taken to address and close out regulatory findings

                        Cost and Efficiency Metrics

                        • Measure the time and resources required to complete validation activities
                        • Track cost savings achieved through optimized CQV approaches

                        By tracking these metrics, we might be able to demonstrate a comprehensive and effective CQV program that aligns with regulatory expectations. Or we might just spend time measuring stuff that may not be tailored to our individual company’s processes, products, and risk profile. And quite frankly, will they influence the system the way we want? It’s time to pull out an IMPACT key behavior analysis to help us tailor a right-sized set of metrics.

                        The first thing to do is to go to first principles, to take a big step back and ask – what do I really want to improve?

                        The purpose of a CQV program is to provide documented evidence that facilities, systems, equipment and processes have been designed, installed and operate in accordance with predetermined specifications and quality attributes:

                        • To verify that critical aspects of a facility, utility system, equipment or process meet approved design specifications and quality attributes.
                        • To demonstrate that processes, equipment and systems are fit for their intended use and perform as expected to consistently produce a product meeting its quality attributes.
                        • To establish confidence that the manufacturing process is capable of consistently delivering quality product.
                        • To identify and understand sources of variability in the process to better control it.
                        • To detect potential problems early in development and prevent issues during routine production.

                        The ultimate measure of success is demonstrating and maintaining a validated state that ensures consistent production of safe and effective products meeting all quality requirements. 

                        Focusing on the Impact is important. What are we truly concerned about for our CQV program. Based on that we come up with two main factors:

                        1. The level of deviations that stem from root causes associated with our CQV program
                        2. The readiness of FUSE elements for use (project adherence)

                        Reducing Deviations from CQV Activities

                        First, we gather data, what deviations are we looking for? These are the types of root causes that we will evaluate. Of course, your use of the 7Ms may vary, this list is to start conversation.

                          Means  Automation or Interface Design Inadequate/DefectiveValidated machine or computer system interface or automation failed to meet specification due to inadequate/defective design.
                          Means  Preventative Maintenance InadequateThe preventive maintenance performed on the equipment was insufficient or not performed as required.
                          MeansPreventative Maintenance Not DefinedNo preventive maintenance is defined for the equipment used.
                          MeansEquipment Defective/Damaged/FailureThe equipment used was defective or a specific component failed to operate as intended.
                          Means  Equipment IncorrectEquipment required for the task was set up or used incorrectly or the wrong equipment was used for the task.
                          Means  Equipment Design Inadequate/DefectiveThe equipment was not designed or qualified to perform the task required or the equipment was defective, which prevented its normal operation.
                        MediaFacility DesignImproper or inadequate layout or construction of facility, area, or work station.
                          MethodsCalibration Frequency is Not Sufficient/DeficiencyCalibration interval is too long and/or calibration schedule is lacking.
                          Methods  Calibration/Validation ProblemAn error occurred because of a data collection- related issue regarding calibration or validation.
                        MethodsSystem / Process Not DefinedThe system/tool or the defined process to perform the task does not exist.

                        Based on analysis of what is going on we can move into using a why-why technique to look at our layers.

                        Why 1Why are deviations stemming from CQV events not at 0%
                        Because unexpected issues or discrepancies arise after the commissioning, qualification, or validation processes

                        Success factor needed for this step: Effectiveness of the CQV program

                        Metric for this step: Adherence to CQV requirements
                        Why 2 (a)Why are unexpected issues arising after CQV?
                        Because of inadequate planning and resource constraints in the CQV process.

                        Success Factor needed for this step: Appropriate project and resource planning

                        Metric for this Step: Resource allocation
                        Why 3 (a)Why are we not performing adequate resource planning?
                        Because of the tight project timelines, and the involvement of multiple stakeholders with different areas of expertise

                        Success Factor needed for this step: Cross-functional governance to implement risk methodologies to focus efforts on critical areas

                        Metric for this Step: Risk Coverage Ratio measuring the percentage of identified critical risks that have been properly assessed and and mitigated through the cross-functional risk management process. This metric helps evaluate how effectively the governance structure is addressing the most important risks facing the organization.
                        Why 2 (b)Why are unexpected issues arising after CQV?
                        Because of poorly executed elements of the CQV process stemming from poorly written procedures and under-qualified staff.

                        Success Factor needed for this step: Process Improvements and Training Qualification

                        Metric for this Step: Performance to Maturity Plan

                        There were somethings I definitely glossed over there, and forgive me for not providing numbers there, but I think you get the gist.

                        So now I’ve identified the I – How do we improve reliability of our CQV program, measured by reducing deviations. Let’s break out the rest.

                        ParametersExecuted for CQV
                        IDENTIFYThe desired quality or process improvement goal (the top-level goal)Improve the effectiveness of the CQV program by taking actions to reduce deviations stemming from verification of FUSE and process.
                        MEASUREEstablish the existing Measure (KPI) used to conform and report achievement of the goalSet a target reduction of deviations related to CQV activities.
                        PinpointPinpoint the “desired” behaviors necessary to deliver the goal (behaviors that contribute successes and failures)Drive good project planning and project adherence.

                        Promote and coach for enhanced attention to detail where “quality is everyone’s job.”

                        Encourage a speak-up culture where concerns, issues or suggestions are shared in a timely manner in a neutral constructive forum.
                        ACTIVATE the CONSEQUENCESActivate the Consequences to motivate the delivery of the goal
                        (4:1 positive to negative actionable consequences)
                        Organize team briefings on consequences

                        Review outcomes of project health

                        Senior leadership celebrate/acknowledge

                        Acknowledge and recognize improvements

                        Motivate the team through team awards

                        Measure success on individual deliverables through a Rubric
                        TRANSFERTransfer the knowledge across the organization to sustain the performance improvementCreate learning teams

                        Lessons learned are documented and shared

                        Lunch-and-learn sessions

                        Create improvement case studies

                        From these two exercises I’ve now identified my lagging and leading indicators at the KPI and the KBI level.