/ Jef Akst for BioSpace
Cause-Consequence Analysis (CCA) is a versatile and comprehensive risk assessment technique that combines elements of fault tree analysis and event tree analysis. This powerful method allows analysts to examine both the causes and potential consequences of critical events, providing a holistic view of risk scenarios.
Cause-Consequence Analysis is a graphical method that integrates two key aspects of risk assessment:
The result is a comprehensive diagram that visually represents the relationships between causes, critical events, and their potential consequences.
CCA is particularly useful in the following situations:
Implementing CCA involves several key steps:
Start by selecting a critical event – an undesired occurrence that could lead to significant consequences. This event serves as the focal point of the analysis.
Working backwards from the critical event, develop a fault tree-like structure to identify and analyze the potential causes. This involves:
Moving forward from the critical event, create an event tree-like structure to map out potential consequences:
Combine the cause and consequence trees around the critical event to create a complete CCA diagram.
Calculate the probabilities of different outcome scenarios by combining the probabilities from both the cause and consequence portions of the diagram.
Assess the overall risk picture, identifying the most critical pathways and potential areas for risk reduction.
CCA offers several advantages:
While powerful, CCA does have some limitations to keep in mind:
Cause-Consequence Analysis is a valuable tool in the risk assessment toolkit, offering a comprehensive approach to understanding and managing risk. By integrating cause analysis with consequence evaluation, CCA provides decision-makers with a powerful means of visualizing risk scenarios and identifying critical areas for intervention. While it requires some expertise to implement effectively, the insights gained from CCA can be invaluable in developing robust risk management strategies across a wide range of industries and applications.
| Process Step | Potential Cause | Consequence | Mitigation Strategy |
|---|---|---|---|
| Upstream Bioreactor Operation | Leak in single-use bioreactor bag | Contamination risk, batch loss | Use reinforced bags with pressure sensors + secondary containment |
| Cell Culture | Failure to maintain pH/temperature | Reduced cell viability, lower mAb yield | Real-time monitoring with automated control systems |
| Harvest Clarification | Pump malfunction during depth filtration | Cell lysis releasing impurities | Redundant pumping systems + surge tanks |
| Protein A Chromatography | Loss of column integrity | Inefficient antibody capture | Regular integrity testing + parallel modular columns |
| Viral Filtration | Membrane fouling | Reduced throughput, extended processing time | Pre-filtration + optimized flow rates |
| Formulation | Improper mixing during buffer exchange | Product aggregation, inconsistent dosing | Automated mixing systems with density sensors |
| Aseptic Filling | Breach in sterile barrier | Microbial contamination | Closed system transfer devices (CSTDs) + PUPSIT testing |
| Cold Chain Storage | Temperature deviation during freezing | Protein denaturation | Controlled rate freeze-thaw systems + temperature loggers |
1. Contamination Cascade
Single-use system breaches can lead to:
2. Supply Chain Interdependencies
Delayed delivery of single-use components causes:
3. Environmental Tradeoffs
While reducing water/energy use by 30-40% vs stainless steel, single-use systems introduce:
| Control Measure | Risk Reduction (%) | Cost Impact |
|---|---|---|
| Automated monitoring systems | 45-60 | High initial investment |
| Redundant fluid paths | 30-40 | Moderate |
| Supplier qualification | 25-35 | Low |
| Staff training programs | 15-25 | Recurring |
This analysis demonstrates that single-use mAb manufacturing offers flexibility and contamination reduction benefits, but requires rigorous control of material properties, process parameters, and supply chain logistics. Modern solutions like closed-system automation and modular facility designs help mitigate key risks while maintaining the environmental advantages of single-use platforms.
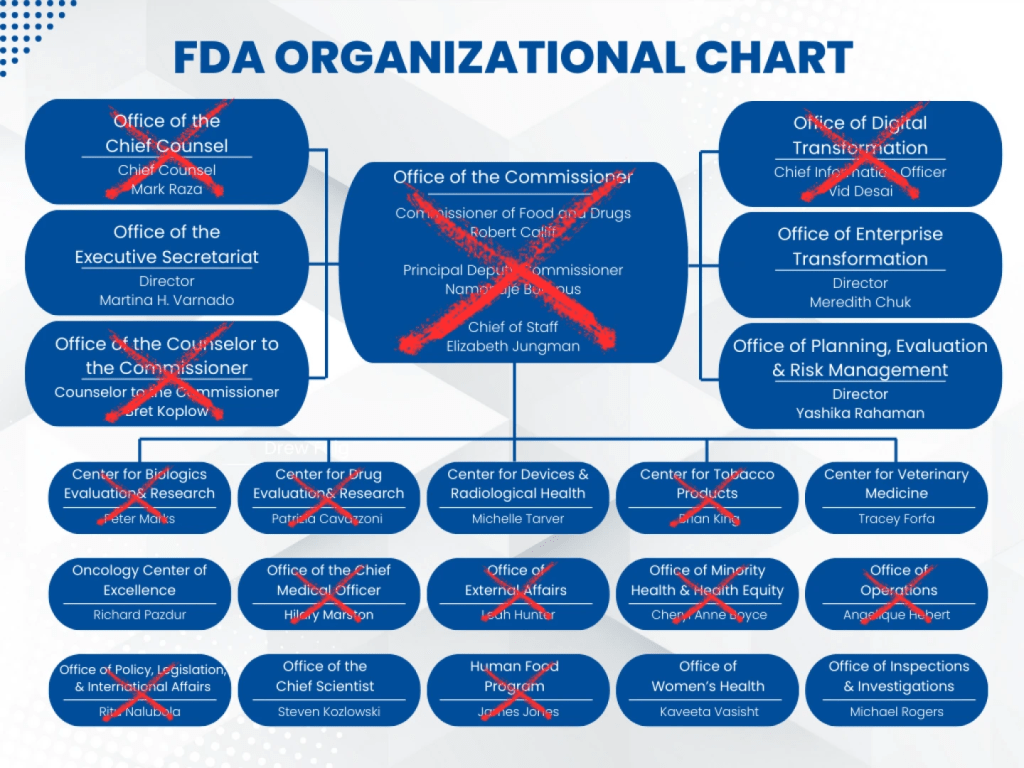
The ongoing destruction of the U.S. Food and Drug Administration (FDA) through politically driven firings mirrors one of the most catastrophic regulatory failures in modern American history: the 1981 mass termination of air traffic controllers under President Reagan. Like the Federal Aviation Administration (FAA) crisis—which left aviation safety systems crippled for nearly a decade—the FDA’s current Reduction in Force (RIF) has purged irreplaceable expertise, with devastating consequences for public health and institutional memory.
The FDA’s decimation began in January 2025 under HHS Secretary Robert F. Kennedy Jr., with these key terminations:
The FDA’s crisis parallels the FAA’s 1981 collapse, when Reagan fired 11,345 unionized air traffic controllers. The FAA required five years to restore baseline staffing and 15 years to rebuild institutional knowledge—a delay that contributed to near-misses and fatal crashes like the 1986 Cerritos mid-air collision. Similarly, the FDA now faces:
The Reagan-era FAA firings cost $1.3 billion in today’s dollars and required emergency military staffing. The FDA’s RIF—projected to delay drug approvals by 2-3 years—could inflict far greater harm:
The FDA’s expertise purge replicates the FAA’s darkest chapter—but with higher stakes. While the FAA’s recovery took 15 years, the FDA’s specialized work in gene therapies, pandemic preparedness, and AI-driven devices cannot withstand such a timeline without catastrophic public health consequences. Commissioner Marty Makary now presides over a skeleton crew ill-equipped to prevent the next opioid crisis, foodborne outbreak, or unsafe medical device. Without immediate congressional intervention to reverse these firings, Americans face a future where regulatory failures become routine, and trust in public health institutions joins aviation safety circa 1981 in the annals of preventable disasters.

Quality systems often focus on efficiency—doing things right—and effectiveness—doing the right things. However, as industries evolve and systems grow more complex, a third dimension is essential to achieving true excellence: elegance. Elegance in quality systems is not merely about simplicity but about creating solutions that are intuitive, sustainable, and seamlessly integrated into organizational workflows.
Elegance elevates quality systems by addressing complexity in a way that reduces friction while maintaining sophistication. It involves designing processes that are not only functional but also intuitive and visually appealing, encouraging engagement rather than resistance. For example, an elegant deviation management system might replace cumbersome, multi-step forms with guided tools that simplify root cause analysis while improving accuracy. By integrating such elements, organizations can achieve compliance with less effort and greater satisfaction among users.
When viewed through the lens of the Excellence Triad, elegance acts as a multiplier for both efficiency and effectiveness. Efficiency focuses on streamlining processes to save time and resources, while effectiveness ensures those processes align with organizational goals and regulatory requirements. Elegance bridges these two dimensions by creating systems that are not only efficient and effective but also enjoyable to use. For instance, a visually intuitive risk assessment matrix can enhance both the speed of decision-making (efficiency) and the accuracy of risk evaluations (effectiveness), all while fostering user engagement through its elegant design.
To imagine how elegance can be embedded into a quality system, consider this high-level example of an elegance-infused quality plan aimed at increasing maturity within 18 months. At its core, this plan emphasizes simplicity and sustainability while aligning with organizational objectives. The plan begins with a clear purpose: to prioritize patient safety through elegant simplicity. This guiding principle is operationalized through metrics such as limiting redundant documents and minimizing the steps required to report quality events.
The implementation framework includes cross-functional quality circles tasked with redesigning one process each quarter using visual heuristics like symmetry and closure. These teams also conduct retrospectives to evaluate the cognitive load of procedures and the aesthetic clarity of dashboards, ensuring that elegance remains a central focus. Documentation is treated as a living system, with cognitive learning driven and video micro-procedures replacing lengthy procedures and tools scoring documents to ensure they remain user-friendly.
The roadmap for maturity integrates elegance at every stage. At the standardized level, efficiency targets include achieving 95% on-time CAPA closures, while elegance milestones focus on reducing document complexity scores across SOPs. As the organization progresses to predictive maturity, AI-driven risk forecasts enhance efficiency, while staff adoption rates reflect the intuitive nature of the systems in place. Finally, at the optimizing stage, zero repeat audits signify peak efficiency and effectiveness, while voluntary adoption of quality tools by R&D teams underscores the system’s elegance.
To cultivate elegance within quality systems, organizations can adopt three key strategies. First, they should identify and eliminate sources of systemic friction by retiring outdated tools or processes. For example, replacing blame-centric forms with learning logs can transform near-miss reporting into an opportunity for growth rather than criticism. Second, aesthetic standards should be embedded into system design by adopting criteria such as efficacy, robustness, scalability, and maintainability. Training QA teams as system gardeners who can further enhance this approach. Finally, cross-pollination between departments can foster innovation; for instance, involving designers in QA processes can lead to more visually engaging outcomes.
By embedding elegance into their quality systems alongside efficiency and effectiveness, organizations can move from mere survival to thriving excellence. Compliance becomes an intuitive outcome of well-designed processes rather than a burdensome obligation. Innovation flourishes in frictionless environments where tools invite improvement rather than resistance. Organizations ready to embrace this transformative approach should begin by conducting an “Elegance Audit” of their most cumbersome processes to identify opportunities for improvement. Through these efforts, excellence becomes not just a goal but a natural state of being for the entire system.

Statistical Process Control (SPC) is both a standalone methodology and a critical component of broader quality management systems. Rooted in statistical principles, SPC enables organizations to monitor, control, and improve processes by distinguishing between inherent (common-cause) and assignable (special-cause) variation. This blog post explores SPC’s role in modern quality strategies, control charts as its primary tools, and practical steps for implementation, while emphasizing its integration into holistic frameworks like Six Sigma and Quality by Design (QbD).
SPC serves as a core methodology for achieving process stability through statistical tools, but its true value emerges when embedded within larger quality systems. For instance:
This integration ensures SPC is not just a technical tool but a strategic asset for continuous improvement and compliance.
SPC is most effective in environments where process stability and variability reduction are critical. Below are key scenarios for its application:
In industries like automotive or electronics, where thousands of units are produced daily, SPC identifies shifts in process mean or variability early. For example, control charts for variables data (e.g., X-bar/R charts) monitor dimensions of machined parts, ensuring consistency across high-volume production runs. The ASTM E2587 standard highlights that SPC is particularly valuable when subgroup data (e.g., 20–25 subgroups) are available to establish reliable control limits.
In pharmaceuticals or food production, batch processes require strict adherence to specifications. Attribute control charts (e.g., p-charts for defect rates) track deviations or OOS results, while individual/moving range (I-MR) charts monitor parameters.
Regulated industries (e.g., pharmaceutical, medical devices, aerospace) use SPC to meet standards like ISO 9001 or ICH Q10. For instance, SPC’s role in Continious Process Verification (CPV) ensures processes remain in a state of control post-validation. The FDA’s emphasis on data-driven decision-making aligns with SPC’s ability to provide evidence of process capability and stability.
SPC is indispensable in projects aimed at reducing waste and variation. By identifying special causes (e.g., equipment malfunctions, raw material inconsistencies), teams can implement corrective actions. Western Electric Rules applied to control charts detect subtle shifts, enabling root-cause analysis and preventive measures.
During process design, SPC helps characterize variability and set realistic tolerances. Exponentially Weighted Moving Average (EWMA) charts detect small shifts in pilot-scale batches, informing scale-up decisions. ASTM E2587 notes that SPC is equally applicable to both early-stage development and mature processes, provided rational subgrouping is used.
SPC extends beyond internal processes to supplier quality management. c-charts or u-charts monitor defect rates from suppliers, ensuring incoming materials meet specifications.
In all cases, SPC requires sufficient data (typically ≥20 subgroups) and a commitment to data-driven culture. It is less effective in one-off production or where measurement systems lack precision.
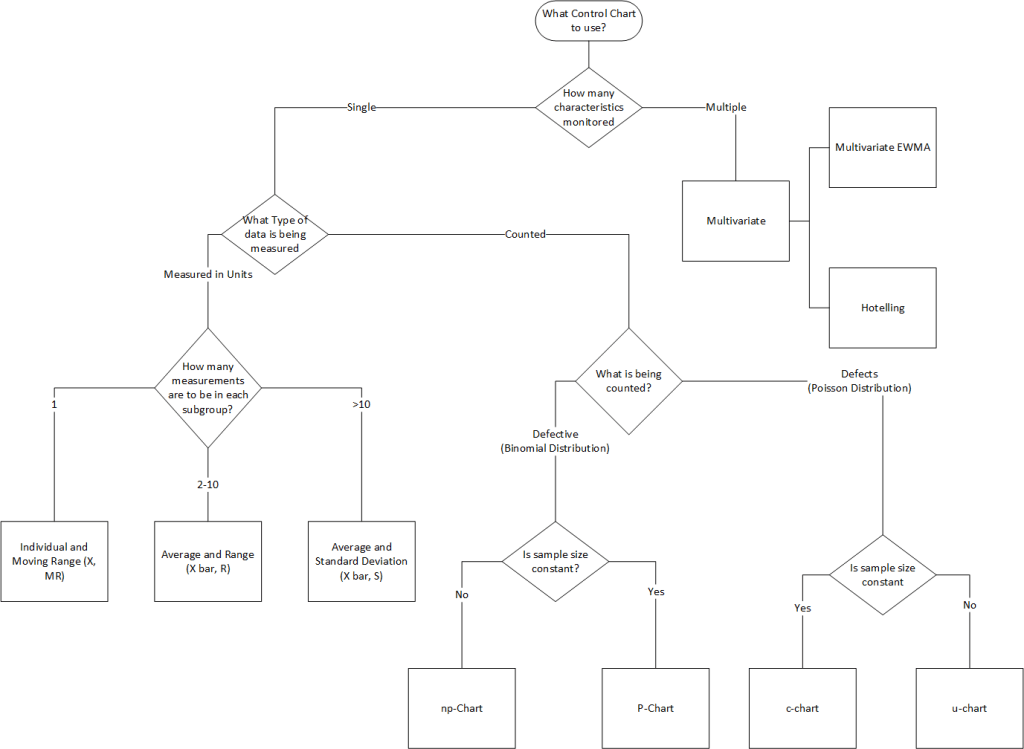
Control charts are graphical tools that plot process data over time against statistically derived control limits. They serve two purposes:
Control charts are categorized by data type:
| Data Type | Chart Type | Use Case |
|---|---|---|
| Variables (Continuous) | X-bar & R | Monitor process mean and variability (subgroups of 2–10). |
| X-bar & S | Similar to X-bar & R but uses standard deviation. | |
| Individual & Moving Range (I-MR) | For single measurements (e.g., batch processes). | |
| Attributes (Discrete) | p-chart | Proportion of defective units (variable subgroup size). |
| np-chart | Number of defective units (fixed subgroup size). | |
| c-chart | Count of defects per unit (fixed inspection interval). | |
| u-chart | Defects per unit (variable inspection interval). |
Control charts become actionable when paired with decision rules to identify non-random variation:
A process is out of control if:
Expands detection to include:
Note: Overusing rules increases false alarms; apply judiciously.
SPC is vital for maintaining validated states and continuous improvement:
SPC is a powerhouse methodology that thrives when embedded within broader quality systems. By aligning SPC with control strategies—through NORs, PARs, and structured trending—organizations achieve not just compliance, but excellence. Whether in pharmaceuticals, manufacturing, or beyond, SPC remains a timeless tool for mastering variability.
