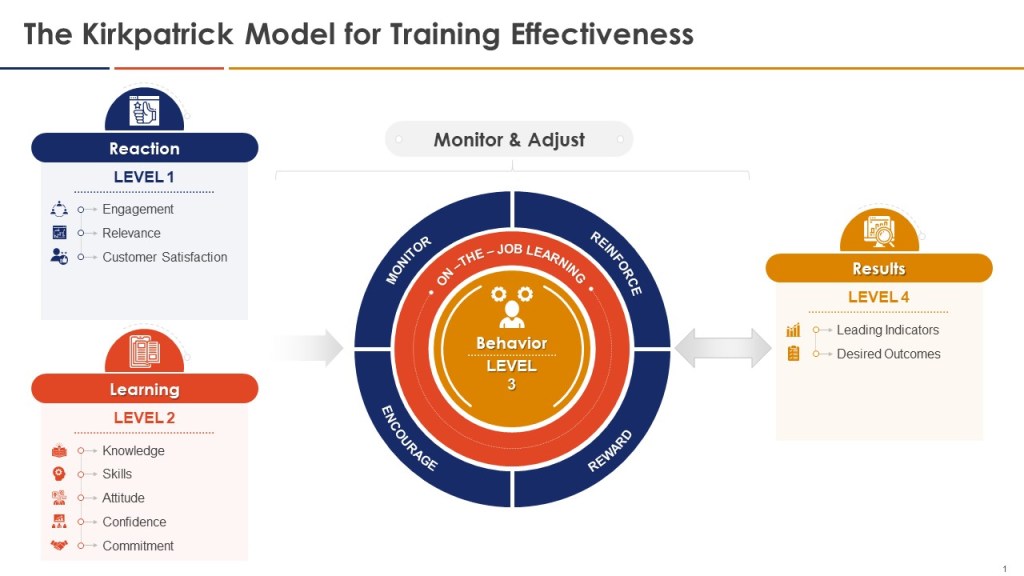
Effectiveness checks are a critical component of a robust change management system, as outlined in ICH Q10 and emphasized in the PIC/S guidance on risk-based change control. These checks serve to verify that implemented changes have achieved their intended objectives without introducing unintended consequences. The importance of effectiveness checks cannot be overstated, as they provide assurance that changes have been successful and that product quality and patient safety have been maintained or improved.
When designing effectiveness checks, organizations should consider the complexity and potential impact of the change. For low-risk changes, a simple review of relevant quality data may suffice. However, for more complex or high-risk changes, a comprehensive evaluation plan may be necessary, potentially including enhanced monitoring, additional testing, or even focused stability studies. The duration and scope of effectiveness checks should be commensurate with the nature of the change and the associated risks.
The PIC/S guidance emphasizes the need for a risk-based approach to change management, including effectiveness checks. This aligns well with the principles of ICH Q9 on quality risk management. By applying risk assessment techniques, companies can determine the appropriate level of scrutiny for each change and tailor their effectiveness checks accordingly. This risk-based approach ensures that resources are allocated efficiently while maintaining a high level of quality assurance.
An interesting question arises when considering the relationship between effectiveness checks and continuous process verification (CPV) as described in the FDA’s guidance on process validation. CPV involves ongoing monitoring and analysis of process performance and product quality data to ensure that a state of control is maintained over time. This approach provides a wealth of data that could potentially be leveraged for change control effectiveness checks.
While CPV does not eliminate the need for effectiveness checks in change control, it can certainly complement and enhance them. The robust data collection and analysis inherent in CPV can provide valuable insights into the impact of changes on process performance and product quality. This continuous stream of data can be particularly useful for detecting subtle shifts or trends that might not be apparent in short-term, targeted effectiveness checks.
To leverage CPV mechanisms for change control effectiveness checks, organizations should consider integrating change-specific monitoring parameters into their CPV plans when implementing significant changes. This could involve temporarily increasing the frequency of data collection for relevant parameters, adding new monitoring points, or implementing statistical tools specifically designed to detect the expected impacts of the change.
For example, if a change is made to improve the consistency of a critical quality attribute, the CPV plan could be updated to include more frequent testing of that attribute, along with statistical process control charts designed to detect the anticipated improvement. This approach allows for a seamless integration of change effectiveness monitoring into the ongoing CPV activities.
It’s important to note, however, that while CPV can provide valuable data for effectiveness checks, it should not completely replace targeted assessments. Some changes may require specific, time-bound evaluations that go beyond the scope of routine CPV. Additionally, the formal documentation of effectiveness check conclusions remains a crucial part of the change management process, even when leveraging CPV data.
In conclusion, while continuous process verification offers a powerful tool for monitoring process performance and product quality, it should be seen as complementary to, rather than a replacement for, traditional effectiveness checks in change control. By thoughtfully integrating CPV mechanisms into the change management process, organizations can create a more robust and data-driven approach to ensuring the effectiveness of changes while maintaining compliance with regulatory expectations. This integrated approach represents a best practice in modern pharmaceutical quality management, aligning with the principles of ICH Q10 and the latest regulatory guidance on risk-based change management.
Building a Good Effectiveness Check
To build a good effectiveness check for a change control, consider the following key elements:
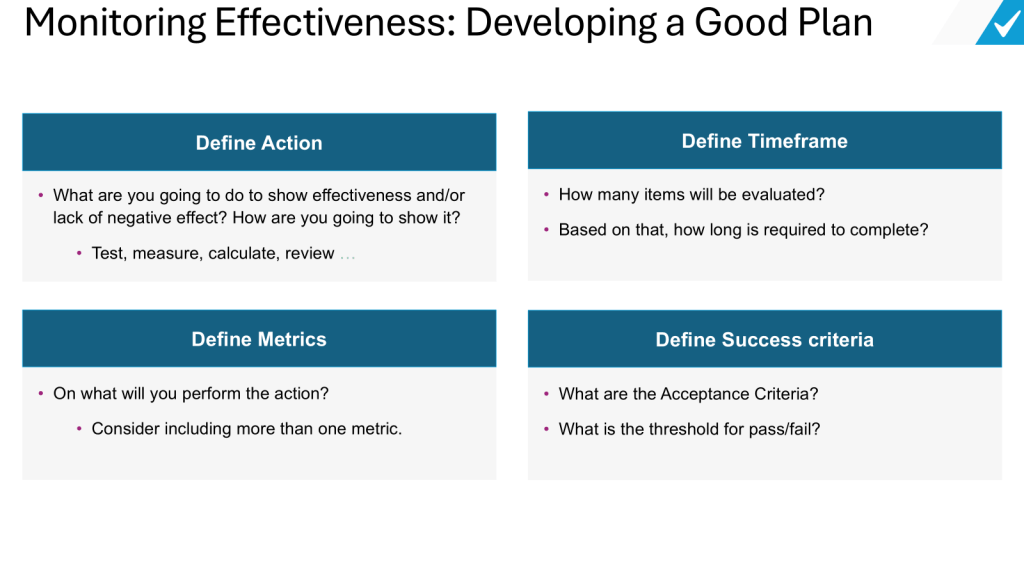
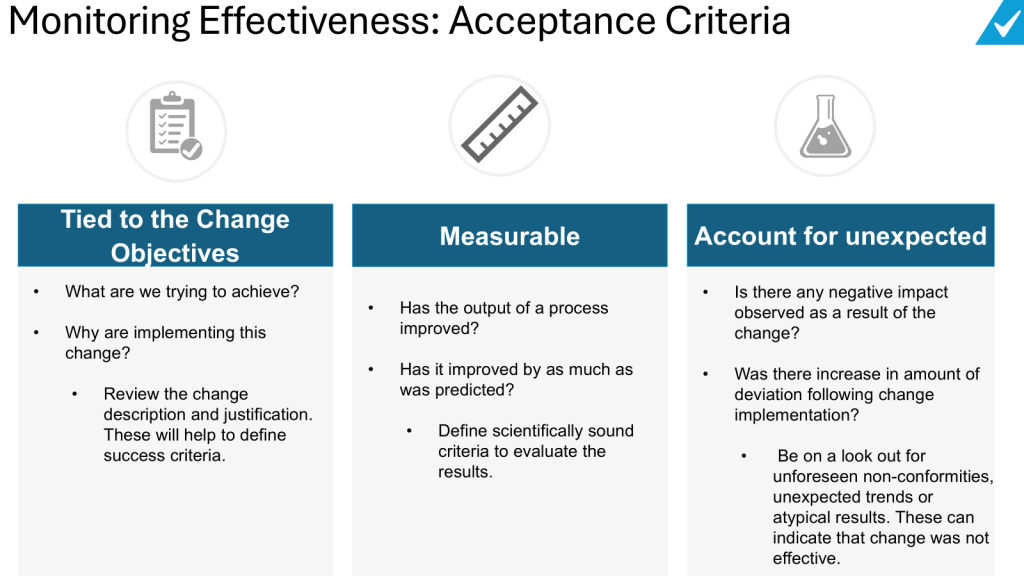
Define clear objectives: Clearly state what the change is intended to achieve. The effectiveness check should measure whether these specific objectives were met.
Establish measurable criteria: Develop quantitative and/or qualitative criteria that can be objectively assessed to determine if the change was effective. These could include metrics like reduced defect rates, improved yields, decreased cycle times, etc.
Set an appropriate timeframe: Allow sufficient time after implementation for the change to take effect and for meaningful data to be collected. This may range from a few weeks to several months depending on the nature of the change.
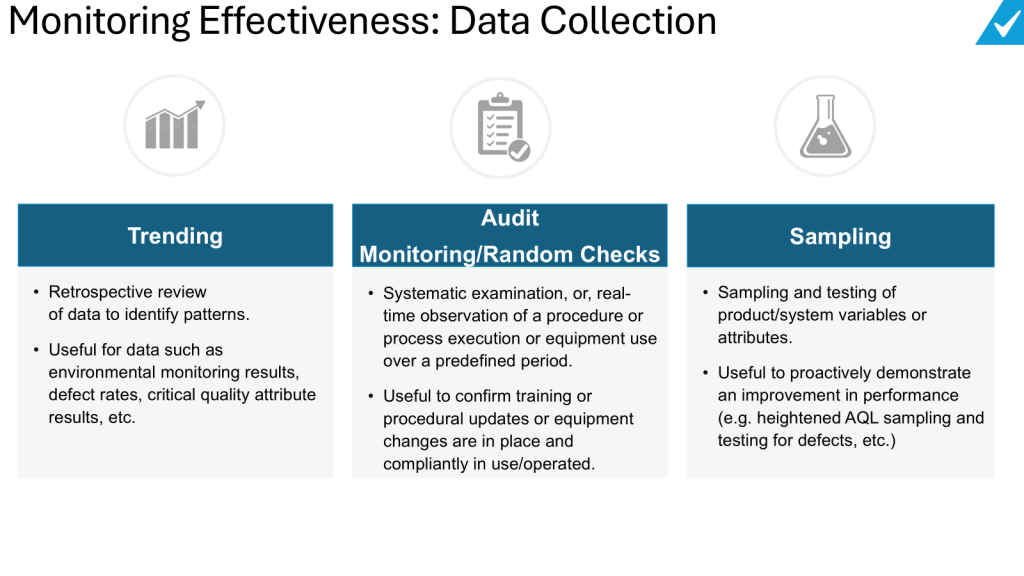
Use multiple data sources: Incorporate various relevant data sources to get a comprehensive view of effectiveness. This could include process data, quality metrics, customer feedback, employee input, etc.
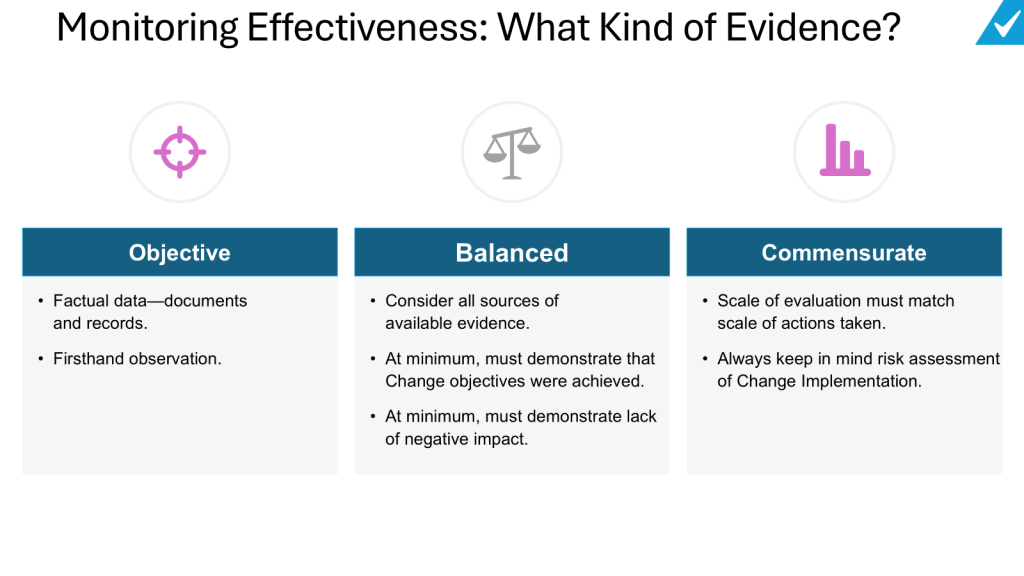
Data collection and data source selection. When collecting data to assess change effectiveness, it’s important to consider multiple relevant data sources that can provide objective evidence. This may include process data, quality metrics, customer feedback, employee input, and other key performance indicators related to the specific change. The data sources should be carefully selected to ensure they can meaningfully demonstrate whether the change objectives were achieved. Both quantitative and qualitative data should be considered. Quantitative data like process parameters, defect rates, or cycle times can provide concrete metrics, while qualitative data from stakeholder feedback can offer valuable context. The timeframe for data collection should be appropriate to allow the change to take effect and for meaningful trends to emerge. Where possible, comparing pre-change and post-change data can help illustrate the impact. Overall, a thoughtful approach to data collection and source selection is essential for conducting a comprehensive evaluation of change effectiveness.
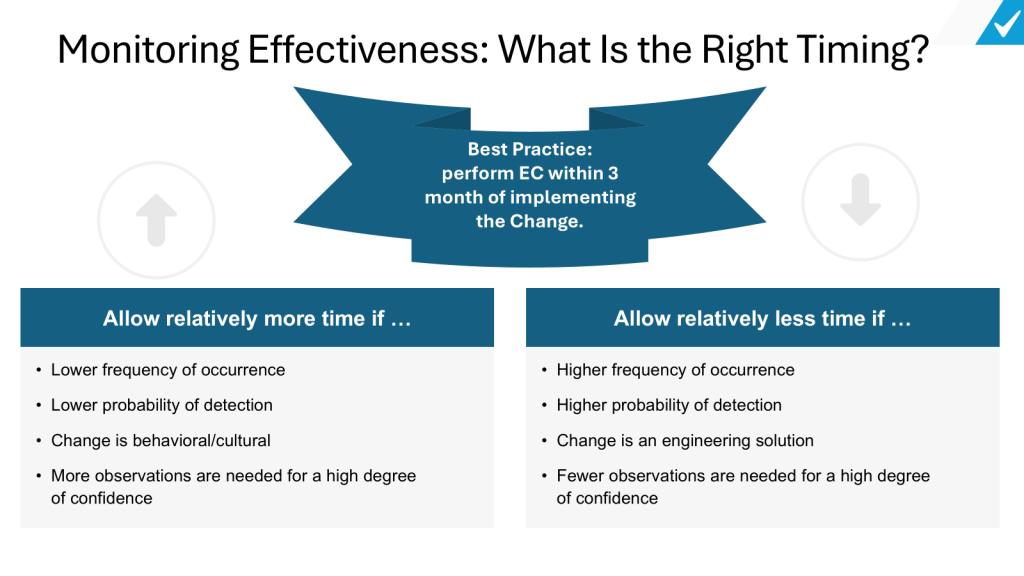
Determine the ideal timeframe. The appropriate duration should allow sufficient time for the change to be fully implemented and for its impacts to be observed, while still being timely enough to detect and address any issues. Generally, organizations should allow relatively more time for changes that have a lower frequency of occurrence, lower probability of detection, involve behavioral or cultural shifts, or require more observations to reach a high degree of confidence. Conversely, less time may be needed for changes with higher frequency, higher detectability, engineering-based solutions, or where fewer observations can provide sufficient confidence. As a best practice, many organizations aim to perform effectiveness checks within 3 months of implementing a change. However, the specific timeframe should be tailored to the nature and complexity of each individual change. The key is to strike a balance – allowing enough time to gather meaningful data on the change’s impact, while still enabling timely corrective actions if needed.
Compare pre- and post-change data: Analyze data from before and after the change implementation to demonstrate improvement.
Consider unintended consequences: Look for any negative impacts or unintended effects of the change, not just the intended benefits.
Involve relevant stakeholders: Get input from operators, quality personnel, and other impacted parties when designing and executing the effectiveness check.
Document the plan: Clearly document the effectiveness check plan, including what will be measured, how, when, and by whom. This should be approved with the change plan.
Define review and approval: Establish who will review the effectiveness check results and approve closure of the change.
Link to continuous improvement: Use the results to drive further improvements and inform future changes.
By incorporating these elements, you can build a robust effectiveness check that provides meaningful data on whether the change achieved its intended purpose without introducing new issues. The key is to make the effectiveness check specific to the change being implemented while keeping it practical to execute.
Determining the effectiveness of a change involves several key steps, as outlined in the provided document and aligned with best practices in change management:
What to Do If the Change Is Not Effective
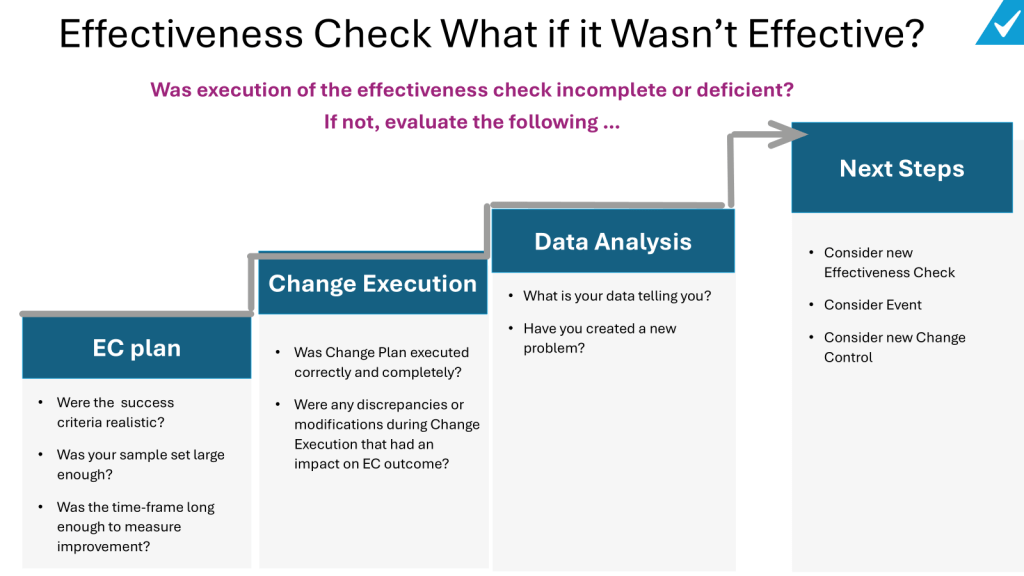
If the effectiveness check reveals that the change did not meet its objectives or introduced unintended consequences, several steps can be taken:
- Re-evaluate the Change Plan: Consider whether the change was executed as planned. Were there any discrepancies or modifications during execution that might have impacted the outcome?
- Assess Success Criteria: Reflect on whether the success criteria were realistic. Were they too ambitious or not aligned with the change’s potential impact?
- Consider Additional Data Collection: Determine if the sample size was adequate or if the timeframe for data collection was sufficient. Sometimes, more data or a longer observation period may be needed to accurately assess effectiveness.
- Identify New Problems: If the change introduced new issues, these should be documented and addressed. This might involve initiating new corrective actions or revising the change to mitigate these effects.
- Develop a New Effectiveness Check or Change Control: If the initial effectiveness check was incomplete or inadequate, consider developing a new plan. This might involve revising the metrics, data collection methods, or acceptance criteria to better assess the change’s impact.
- Document Lessons Learned: Regardless of the outcome, document the findings and any lessons learned. This information can be invaluable for improving future change management processes and ensuring that changes are more effective.
By following these steps, organizations can ensure that changes are thoroughly evaluated and that any issues are promptly addressed, ultimately leading to continuous improvement in their processes and products.