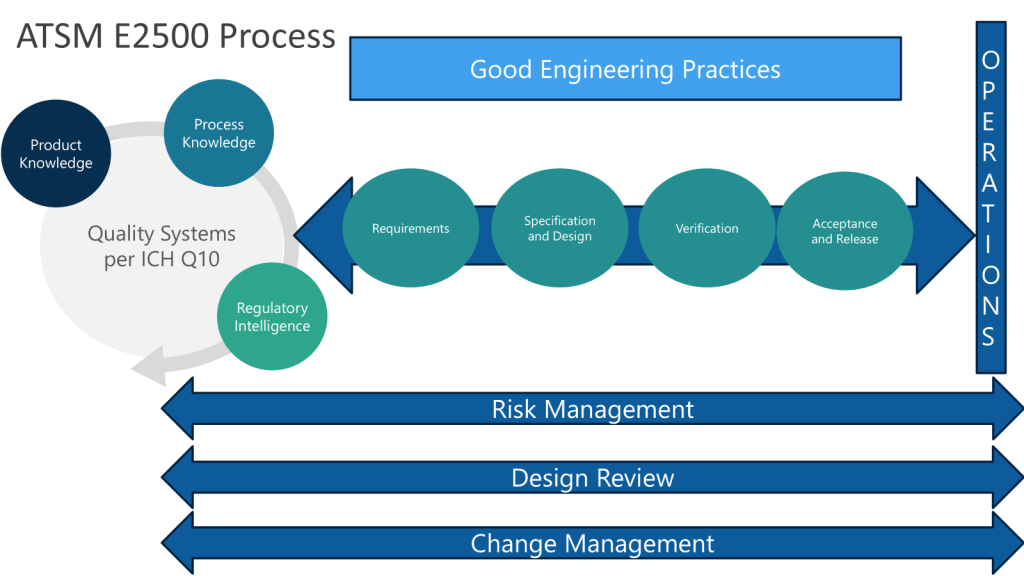
ASTM E2500 recognizes that Good Engineering Practices (GEP) are essential for pharmaceutical companies to ensure the consistent and reliable design, delivery, and operation of engineered systems in a manner suitable for their intended purpose.
Key Elements of Good Engineering Practices
Risk Management: Applying systematic processes to identify, assess, and control risks throughout the lifecycle of engineered systems. This includes quality risk management focused on product quality and patient safety.
Cost Management: Estimating, budgeting, monitoring and controlling costs for engineering projects and operations. This helps ensure projects deliver value and stay within budget constraints.
Organization and Control: Establishing clear organizational structures, roles and responsibilities for engineering activities. Implementing monitoring and control mechanisms to track performance.
Innovation and Continual Improvement: Fostering a culture of innovation and continuous improvement in engineering processes and systems.
Lifecycle Management: Applying consistent processes for change management, issue management, and document control throughout a system’s lifecycle from design to decommissioning.
Project Management: Following structured approaches for planning, executing and controlling engineering projects.
Design Practices: Applying systematic processes for requirements definition, design development, review and qualification.
Operational Support: Implementing asset management, calibration, maintenance and other practices to support systems during routine operations.
Key Steps for Implementation
Develop and document GEP policies, procedures and standards tailored to the company’s needs
Establish an Engineering Quality Process (EQP) to link GEP to the overall Pharmaceutical Quality System
Provide training on GEP principles and procedures to engineering staff
Implement risk-based approaches to focus efforts on critical systems and processes
Use structured project management methodologies for capital projects
Apply change control and issue management processes consistently
Maintain engineering documentation systems with appropriate controls
Conduct periodic audits and reviews of GEP implementation
Foster a culture of quality and continuous improvement in engineering
Ensure appropriate interfaces between engineering and quality/regulatory functions
The key is to develop a systematic, risk-based approach to GEP that is appropriate for the company’s size, products and operations. When properly implemented, GEP provides a foundation for regulatory compliance, operational efficiency and product quality in pharmaceutical manufacturing.
Invest in a Living, Breathing Engineering Quality Process (EQP)
The EQP establishes the formal connection between GEP and the Pharmaceutical Quality System it resides within, serving as the boundary between Quality oversight and engineering activities, particularly for implementing Quality Risk Management (QRM) based integrated Commissioning and Qualification (C&Q).
It should also provide an interface between engineering activities and other systems like business operations, health/safety/environment, or other site quality systems.
Based on the information provided in the document, here is a suggested table of contents for an Engineering Quality Process (EQP):
Table of Contents – Engineering Quality Process (EQP)
Application and Context 2.1 Relationship to Pharmaceutical Quality System (PQS) 2.2 Relationship to Good Engineering Practice (GEP) 2.3 Interface with Quality Risk Management (QRM)
EQP Elements 3.1 Policies and Procedures for the Asset Lifecycle and GEPs 3.2 Risk Assessment 3.3 Change Management 3.4 Document Control 3.5 Training 3.6 Auditing
Deliverables 4.1 GEP Documentation 4.2 Risk Assessments 4.3 Change Records 4.4 Training Records 4.5 Audit Reports
Roles and Responsibilities 5.1 Engineering 5.2 Quality 5.3 Operations 5.4 Other Stakeholders
EQP Implementation 6.1 Establishing the EQP 6.2 Maintaining the EQP 6.3 Continuous Improvement
Facility design and manufacturing processes are complex, multi-stage operations, fraught with difficulty. Ensuring the facility meets Good Manufacturing Practice (GMP) standards and other regulatory requirements is a major challenge. The complex regulations around biomanufacturing facilities require careful planning and documentation from the earliest design stages.
Which is why consensus standards like ASTM E2500 exist.
Central to these approaches are risk assessment, to which there are three primary components:
An understanding of the uncertainties in the design (which includes materials, processing, equipment, personnel, environment, detection systems, feedback control)
An identification of the hazards and failure mechanisms
An estimation of the risks associated with each hazard and failure
Folks often get tied up on what tool to use. Frankly, this is a phase approach. We start with a PHA for design, an FMEA for verification and a HACCP/Layers of Control Analysis for Acceptance. Throughout we use a bow-tie for communication.
Aspect
Bow-Tie
PHA (Preliminary Hazard Analysis)
FMEA (Failure Mode and Effects Analysis)
HACCP (Hazard Analysis and Critical Control Points)
Primary Focus
Visualizing risk pathways
Early hazard identification
Potential failure modes
Systematically identify, evaluate, and control hazards that could compromise product safety
Timing in Process
Any stage
Early development
Any stage, often design
Throughout production
Approach
Combines causes and consequences
Top-down
Bottom-up
Systematic prevention
Complexity
Moderate
Low to moderate
High
Moderate
Visual Representation
Central event with causes and consequences
Tabular format
Tabular format
Flow diagram with CCPs
Risk Quantification
Can include, not required
Basic risk estimation
Risk Priority Number (RPN)
Not typically quantified
Regulatory Alignment
Less common in pharma
Aligns with ISO 14971
Widely accepted in pharma
Less common in pharma
Critical Points
Identifies barriers
Does not specify
Identifies critical failure modes
Identifies Critical Control Points (CCPs)
Scope
Specific hazardous event
System-level hazards
Component or process-level failures
Process-specific hazards
Team Requirements
Cross-functional
Less detailed knowledge needed
Detailed system knowledge
Food safety expertise
Ongoing Management
Can be used for monitoring
Often updated periodically
Regularly updated
Continuous monitoring of CCPs
Output
Visual risk scenario
List of hazards and initial risk levels
Prioritized list of failure modes
HACCP plan with CCPs
Typical Use in Pharma
Risk communication
Early risk identification
Detailed risk analysis
Product Safety/Contamination Control
At BOSCON this year I’ll be talking about this fascinating detail, perhaps too much detail.
A key KPI for a FUSE program is Overall Equipment Effectiveness (OEE) which measures the efficiency and productivity of equipment and production processes.
Definition of OEE
OEE is a percentage that represents the proportion of truly productive manufacturing time. It takes into account three main factors:
Availability: The ratio of Run Time to Planned Production Time. It takes into account any events that stop planned production for an appreciable length of time.
Performance: Anything that causes the manufacturing process to run at less than the maximum possible efficiency when it is running.
Quality: Manufactured material that do not meet quality standards, including materialthat require rework and reprocessing.
The formula for calculating OEE is:
OEE = Availability × Performance × Quality
Components of OEE
Availability
Availability measures the percentage of scheduled time that the equipment is available to operate. It accounts for downtime losses.
Availability = Run Time / Planned Production Time
Performance
Performance compares the actual output of equipment to its theoretical maximum output at optimal speed.
Performance = (Ideal Cycle Time × Total Count) / Run Time
Quality
Quality represents the percentage of released material produced out of the total material produced.
Quality = Good Count / Total Count
Importance of OEE
OEE is crucial for several reasons:
It provides a comprehensive view of manufacturing productivity.
It helps identify losses and areas for improvement.
It serves as a benchmark for comparing performance across different equipment or production lines.
It supports continuous improvement initiatives.
Interpreting OEE Scores
While OEE scores can vary by industry, generally:
100% OEE is perfect production
85% is considered world-class
60% is fairly typical
40% is low but not uncommon for companies just starting to measure OEE
Benefits of Tracking OEE
Identifies hidden capacity in manufacturing operations
Reduces manufacturing costs
Improves quality control
Increases equipment longevity through better maintenance practices
Enhances decision-making with data-driven insights
By focusing on OEE, manufacturers can significantly enhance their productivity, reduce waste, and improve their bottom line. It’s a powerful metric that provides actionable insights for optimizing manufacturing processes.
How strongly does this metric connect to business objectives?
5
Empirically Direct – Data proves the metric directly supports at least one business objective – the ability to meet client requirements
Measurability
How much effort would it take to track this metric?
3
Medium – Data exists but in a variety of spreadsheets systems, minor collection or measurement challenges may exist. Will need to agree on what certain aspects of data means.
Precision
How often and by what margin does the metric change?
5
Once we agree on the metric and how to measure it, it should be Highly Predictable
Actionability
Can we clearly articulate actions we would take in response to this metric?
4
Some consensus on action, and capability currently exists to take action. This metric will be used to drive consensus.
Presence of Baseline
Does internal or external baseline data exist to indicate good/poor performance for this metric?
3
Baseline must be based on incomplete or directional data. Quite frankly, the site is just qualified and there will be a rough patch.
This tells me this is a strong metric that requires a fair amount of work to implement. It is certainly going into the Metrics Plan.
A Deeper Dive into Equipment Availability
Equipment availability metric measures the proportion of time a piece of equipment or machinery is operational and ready for production compared to the total planned production time. It is a key component of Overall Equipment Effectiveness (OEE), along with Performance and Quality.
This metric directly impacts production capacity and throughput with a high availability indicating efficient maintenance practices and equipment reliability. This metric helps identify areas for improvement in operations and maintenance.
Definition and Calculation
Equipment availability is expressed as a percentage and calculated using the following formula:
Availability (%) = (Actual Operation Time / Planned Production Time) × 100
Where:
Actual Operation Time = Planned Production Time – Total Downtime
Planned Production Time = Total Time – Planned Downtime
For example, if a machine is scheduled to run for 8 hours but experiences 1 hour of unplanned downtime:
To increase equipment availability, consider the following strategies:
Implement preventive and predictive maintenance programs.
Optimize changeover procedures and reduce setup times.
Enhance operator training to improve equipment handling and minor maintenance skills.
Use real-time monitoring systems to quickly identify and address issues.
Analyze root causes of downtime and implement targeted improvements.
Incorporate fault tolerance at the equipment design stage.
Create asset-specific maintenance programs.
Relationship to Other Metrics
Equipment availability is closely related to other important manufacturing metrics:
It’s one of the three components of OEE, alongside Performance and Quality.
It’s distinct from but related to equipment reliability, which measures the probability of failure-free operation.
It impacts overall plant efficiency and productivity.
By focusing on improving equipment availability, manufacturers can enhance their overall operational efficiency, reduce costs, and increase production capacity. Regular monitoring and analysis of this metric can provide valuable insights for continuous improvement initiatives in manufacturing processes.
To generate an equipment availability KPI in process manufacturing, you should follow these steps:
Calculate Equipment Availability
The basic formula for equipment availability is:
Availability = Run Time / Planned Production Time
Where:
Run Time = Planned Production Time – Downtime
Planned Production Time = Total Time – Planned Downtime
For example, if a machine is scheduled to run for 8 hours, but has 1 hour of unplanned downtime:
To calculate availability accurately, you need to track:
Total available time
Planned downtime (e.g. scheduled maintenance)
Unplanned downtime (e.g. breakdowns)
Actual production time
Implement Data Collection Systems
Use automated data collection systems like machine monitoring software or manufacturing execution systems (MES) to capture accurate, real-time data on equipment status and downtime.
Analyze Root Causes
Categorize and analyze causes of downtime to identify improvement opportunities. Common causes include:
Equipment failures
Changeovers/setups
Material shortages
Operator availability
Set Targets and Monitor Trends
Set realistic availability targets based on industry benchmarks and your current performance
Track availability over time to identify trends and measure improvement efforts
Compare availability across equipment and production lines
Take Action to Improve Availability
Implement preventive and predictive maintenance programs
Optimize changeover procedures
Improve operator training
Address chronic equipment issues
Use Digital Tools
Leverage technologies like IoT sensors, cloud analytics, and digital twins to gain deeper insights into equipment performance and predict potential failures.
Planned Production Time
Planned production time is the total amount of time scheduled for production activities, excluding planned downtime. It represents the time during which equipment or production lines are expected to be operational and producing goods. It can be rather tricky to agree on the exact meaning.
Calculation
The basic formula for planned production time is:
Planned Production Time = Total Time – Planned Downtime
Where:
Total Time is the entire time period being considered (e.g., a shift, day, week, or month)
Planned Downtime includes scheduled maintenance, changeovers, and other planned non-productive activities
Components of Planned Production Time
Total Time
This is the full duration of the period being analyzed, such as:
A single 8-hour shift
A 24-hour day
A 7-day week
A 30-day month
Planned Downtime
This includes all scheduled non-productive time, such as:
Preventive maintenance
Scheduled breaks
Shift changes
Planned changeovers between batches
Cleaning and sanitation procedures
Considerations for Batch Manufacturing
In batch production, several factors affect planned production time:
Batch Changeovers: Time allocated for switching between different product batches must be accounted for as planned downtime.
Equipment Setup: The time required to configure machinery for each new batch should be included in planned downtime.
Quality Checks: Time for quality control procedures between batches may be considered part of planned production time or planned downtime, depending on the specific process.
Cleaning Procedures: Time for cleaning equipment between batches is typically considered planned downtime.
Material Handling: Time for loading raw materials and unloading finished products between batches may be part of planned production time or downtime, based on the specific process.
Example Calculation
Let’s consider a single 8-hour shift in a batch manufacturing facility:
As October rolls around I am focusing on 3 things: finalizing a budget; organization design and talent management; and a 2025 metrics plan. One can expect those three things to be the focus of a lot of my blog posts in October.
Go and read my post on Metrics plans. Like many aspects of a quality management system we don’t spend nearly enough time planning for metrics.
So over the next month I’m going to develop the strategy for a metrics plan to ensure the optimal performance, safety, and compliance of our biotech manufacturing facility, with a focus on:
Facility and utility systems efficiency
Equipment reliability and performance
Effective commissioning, qualification, and validation processes
Robust quality risk management
Stringent contamination control measures
Following the recommended structure of a metrics plan, here is the plan:
Rationale and Desired Outcomes
Implementing this metrics plan will enable us to:
Improve overall facility performance and product quality
Reduce downtime and maintenance costs
Ensure regulatory compliance
Minimize contamination risks
Optimize resource allocation
Metrics Framework
Our metrics framework will be based on the following key areas:
Facility and Utility Systems
Equipment Performance
Commissioning, Qualification, and Validation (CQV)
Quality Risk Management (QRM)
Contamination Control
Success Criteria
Success will be measured by:
Reduction in facility downtime
Improved equipment reliability
Faster CQV processes
Decreased number of quality incidents
Reduced contamination events
Implementation Plan
Steps, Timelines & Milestones
Develop detailed metrics for each key area (Month 1)
Implement data collection systems (Month 2)
Train personnel on metrics collection and analysis (Month 3)
Begin data collection and initial analysis (Month 4)
Review and refine metrics (Month 9)
Full implementation and ongoing analysis (Month 12 onwards)
This plan gets me ready to evaluate these metrics as part of governance in January of next year.
In October I will breakdown some metrics, explaining them and provide the rationale, and demonstrate how to collect. I’ll be striving to break these metrics into key performance indicators (KPI), key behavior indicators (KBI) and key risk indicators (KRI).