Cause-Consequence Analysis (CCA) is a versatile and comprehensive risk assessment technique that combines elements of fault tree analysis and event tree analysis. This powerful method allows analysts to examine both the causes and potential consequences of critical events, providing a holistic view of risk scenarios.
What is Cause-Consequence Analysis?
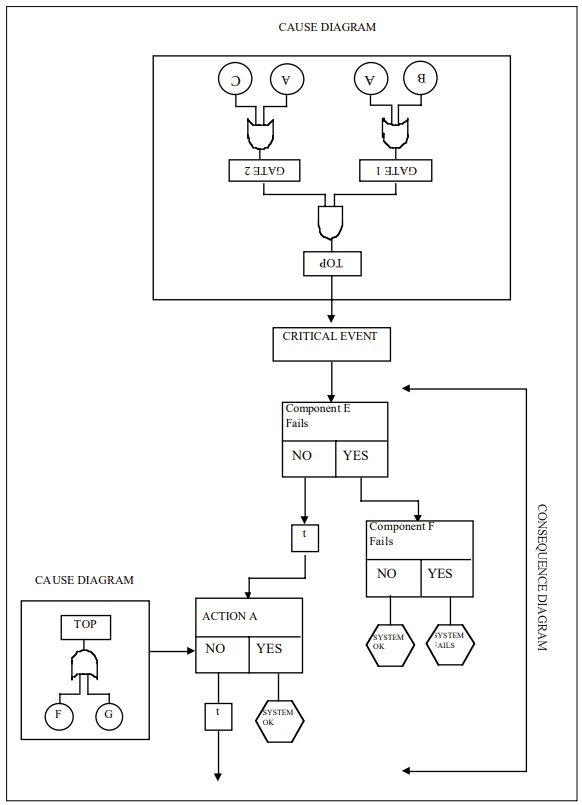
Cause-Consequence Analysis is a graphical method that integrates two key aspects of risk assessment:
Cause analysis: Identifying and analyzing the potential causes of a critical event using fault tree-like structures.
Consequence analysis: Evaluating the possible outcomes and their probabilities using event tree-like structures.
The result is a comprehensive diagram that visually represents the relationships between causes, critical events, and their potential consequences.
When to Use Cause-Consequence Analysis
CCA is particularly useful in the following situations:
Complex systems analysis: When dealing with intricate systems where multiple factors can interact to produce various outcomes.
Safety-critical industries: In sectors such as nuclear power, chemical processing, and aerospace, where understanding both causes and consequences is crucial.
Multiple outcome scenarios: When a critical event can lead to various consequences depending on the success or failure of safety systems or interventions.
Comprehensive risk assessment: When a thorough understanding of both the causes and potential impacts of risks is required.
Decision support: To aid in risk management decisions by providing a clear picture of risk pathways and potential outcomes.
How to Implement Cause-Consequence Analysis
Implementing CCA involves several key steps:
1. Identify the Critical Event
Start by selecting a critical event – an undesired occurrence that could lead to significant consequences. This event serves as the focal point of the analysis.
2. Construct the Cause Tree
Working backwards from the critical event, develop a fault tree-like structure to identify and analyze the potential causes. This involves:
Identifying primary, secondary, and root causes
Using logic gates (AND, OR) to show how causes combine
Assigning probabilities to basic events
3. Develop the Consequence Tree
Moving forward from the critical event, create an event tree-like structure to map out potential consequences:
Identify safety functions and barriers
Determine possible outcomes based on the success or failure of these functions
Include time delays where relevant
4. Integrate Cause and Consequence Trees
Combine the cause and consequence trees around the critical event to create a complete CCA diagram.
5. Analyze Probabilities
Calculate the probabilities of different outcome scenarios by combining the probabilities from both the cause and consequence portions of the diagram.
6. Evaluate and Interpret Results
Assess the overall risk picture, identifying the most critical pathways and potential areas for risk reduction.
Benefits of Cause-Consequence Analysis
CCA offers several advantages:
Comprehensive view: Provides a complete picture of risk scenarios from causes to consequences.
Flexibility: Can be applied to various types of systems and risk scenarios.
Visual representation: Offers a clear, graphical depiction of risk pathways.
Quantitative analysis: Allows for probability calculations and risk quantification.
Decision support: Helps identify critical areas for risk mitigation efforts.
Challenges and Considerations
While powerful, CCA does have some limitations to keep in mind:
Complexity: For large systems, CCA diagrams can become very complex and time-consuming to develop.
Expertise required: Proper implementation requires a good understanding of both fault tree and event tree analysis techniques.
Data needs: Accurate probability data for all events may not always be available.
Static representation: The basic CCA model doesn’t capture dynamic system behavior over time.
Cause-Consequence Analysis is a valuable tool in the risk assessment toolkit, offering a comprehensive approach to understanding and managing risk. By integrating cause analysis with consequence evaluation, CCA provides decision-makers with a powerful means of visualizing risk scenarios and identifying critical areas for intervention. While it requires some expertise to implement effectively, the insights gained from CCA can be invaluable in developing robust risk management strategies across a wide range of industries and applications.
Cause-Consequence Analysis Example
Process Step
Potential Cause
Consequence
Mitigation Strategy
Upstream Bioreactor Operation
Leak in single-use bioreactor bag
Contamination risk, batch loss
Use reinforced bags with pressure sensors + secondary containment
Cell Culture
Failure to maintain pH/temperature
Reduced cell viability, lower mAb yield
Real-time monitoring with automated control systems
Closed system transfer devices (CSTDs) + PUPSIT testing
Cold Chain Storage
Temperature deviation during freezing
Protein denaturation
Controlled rate freeze-thaw systems + temperature loggers
Key Risk Areas and Systemic Impacts
1. Contamination Cascade Single-use system breaches can lead to:
Direct product loss ($500k-$2M per batch)
Facility downtime for decontamination (2-4 weeks)
Regulatory audit triggers
2. Supply Chain Interdependencies Delayed delivery of single-use components causes:
Production schedule disruptions
Increased inventory carrying costs
Potential quality variability between suppliers
3. Environmental Tradeoffs While reducing water/energy use by 30-40% vs stainless steel, single-use systems introduce:
Plastic waste generation (300-500 kg/batch)
Supply chain carbon footprint from polymer production
Mitigation Effectiveness Analysis
Control Measure
Risk Reduction (%)
Cost Impact
Automated monitoring systems
45-60
High initial investment
Redundant fluid paths
30-40
Moderate
Supplier qualification
25-35
Low
Staff training programs
15-25
Recurring
This analysis demonstrates that single-use mAb manufacturing offers flexibility and contamination reduction benefits, but requires rigorous control of material properties, process parameters, and supply chain logistics. Modern solutions like closed-system automation and modular facility designs help mitigate key risks while maintaining the environmental advantages of single-use platforms.
Quality systems often focus on efficiency—doing things right—and effectiveness—doing the right things. However, as industries evolve and systems grow more complex, a third dimension is essential to achieving true excellence: elegance. Elegance in quality systems is not merely about simplicity but about creating solutions that are intuitive, sustainable, and seamlessly integrated into organizational workflows.
Elegance elevates quality systems by addressing complexity in a way that reduces friction while maintaining sophistication. It involves designing processes that are not only functional but also intuitive and visually appealing, encouraging engagement rather than resistance. For example, an elegant deviation management system might replace cumbersome, multi-step forms with guided tools that simplify root cause analysis while improving accuracy. By integrating such elements, organizations can achieve compliance with less effort and greater satisfaction among users.
When viewed through the lens of the Excellence Triad, elegance acts as a multiplier for both efficiency and effectiveness. Efficiency focuses on streamlining processes to save time and resources, while effectiveness ensures those processes align with organizational goals and regulatory requirements. Elegance bridges these two dimensions by creating systems that are not only efficient and effective but also enjoyable to use. For instance, a visually intuitive risk assessment matrix can enhance both the speed of decision-making (efficiency) and the accuracy of risk evaluations (effectiveness), all while fostering user engagement through its elegant design.
To imagine how elegance can be embedded into a quality system, consider this high-level example of an elegance-infused quality plan aimed at increasing maturity within 18 months. At its core, this plan emphasizes simplicity and sustainability while aligning with organizational objectives. The plan begins with a clear purpose: to prioritize patient safety through elegant simplicity. This guiding principle is operationalized through metrics such as limiting redundant documents and minimizing the steps required to report quality events.
The implementation framework includes cross-functional quality circles tasked with redesigning one process each quarter using visual heuristics like symmetry and closure. These teams also conduct retrospectives to evaluate the cognitive load of procedures and the aesthetic clarity of dashboards, ensuring that elegance remains a central focus. Documentation is treated as a living system, with cognitive learning driven and video micro-procedures replacing lengthy procedures and tools scoring documents to ensure they remain user-friendly.
The roadmap for maturity integrates elegance at every stage. At the standardized level, efficiency targets include achieving 95% on-time CAPA closures, while elegance milestones focus on reducing document complexity scores across SOPs. As the organization progresses to predictive maturity, AI-driven risk forecasts enhance efficiency, while staff adoption rates reflect the intuitive nature of the systems in place. Finally, at the optimizing stage, zero repeat audits signify peak efficiency and effectiveness, while voluntary adoption of quality tools by R&D teams underscores the system’s elegance.
To cultivate elegance within quality systems, organizations can adopt three key strategies. First, they should identify and eliminate sources of systemic friction by retiring outdated tools or processes. For example, replacing blame-centric forms with learning logs can transform near-miss reporting into an opportunity for growth rather than criticism. Second, aesthetic standards should be embedded into system design by adopting criteria such as efficacy, robustness, scalability, and maintainability. Training QA teams assystem gardenerswho can further enhance this approach. Finally, cross-pollination between departments can foster innovation; for instance, involving designers in QA processes can lead to more visually engaging outcomes.
By embedding elegance into their quality systems alongside efficiency and effectiveness, organizations can move from mere survival to thriving excellence. Compliance becomes an intuitive outcome of well-designed processes rather than a burdensome obligation. Innovation flourishes in frictionless environments where tools invite improvement rather than resistance. Organizations ready to embrace this transformative approach should begin by conducting an “Elegance Audit” of their most cumbersome processes to identify opportunities for improvement. Through these efforts, excellence becomes not just a goal but a natural state of being for the entire system.
A pre-mortem is a proactive risk management exercise that enables pharmaceutical teams to anticipate and mitigate failures before they occur. This tool can transform compliance from a reactive checklist into a strategic asset for safeguarding product quality.
Pre-Mortems in Pharmaceutical Quality Systems
In GMP environments, where deviations in drug substance purity or drug product stability can cascade into global recalls, pre-mortems provide a structured framework to challenge assumptions. For example, a team developing a monoclonal antibody might hypothesize that aggregation occurred during drug substance purification due to inadequate temperature control in bioreactors. By contrast, a tablet manufacturing team might explore why dissolution specifications failed because of inconsistent API particle size distribution. These exercises align with ICH Q9’s requirement for systematic hazard analysis and ICH Q10’s emphasis on knowledge management, forcing teams to document tacit insights about process boundaries and failure modes.
Pre-mortems excel at identifying “unknown unknowns” through creative thinking. Their value lies in uncovering risks traditional assessments miss. As a tool it can usually be strongly leveraged to identify areas for focus that may need a deeper tool, such as an FMEA. In practice, pre-mortems and FMEA are synergistic through a layered approach which satisfies ICH Q9’s requirement for both creative hazard identification and structured risk evaluation, turning hypothetical failures into validated control strategies.
By combining pre-mortems’ exploratory power with FMEA’s rigor, teams can address both systemic and technical risks, ensuring compliance while advancing operational resilience.
Implementing Pre-Mortems
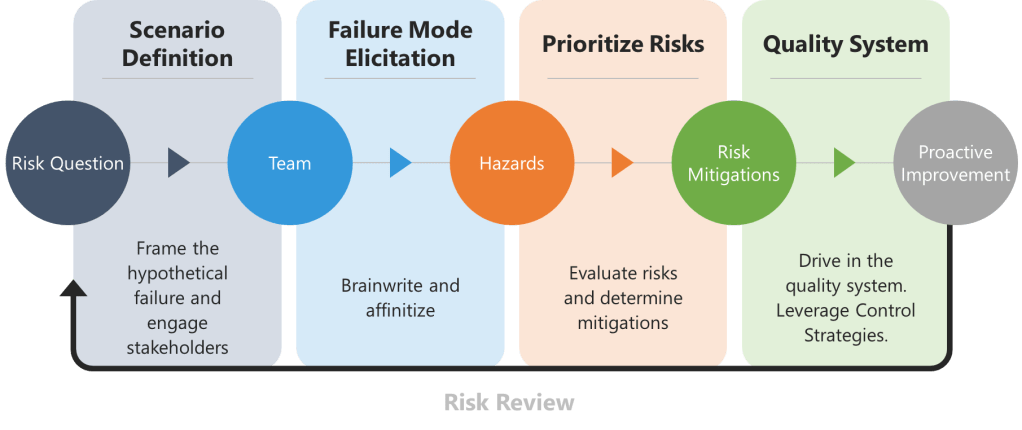
1. Scenario Definition and Stakeholder Engagement
Begin by framing the hypothetical failure, the risk question. For drug substances, this might involve declaring, “The API batch was rejected due to genotoxic impurity levels exceeding ICH M7 limits.” For drug products, consider, “Lyophilized vials failed sterility testing due to vial closure integrity breaches.” Assemble a team spanning technical operations, quality control, and regulatory affairs to ensure diverse viewpoints.
2. Failure Mode Elicitation
To overcome groupthink biases in traditional brainstorming, teams should begin with brainwriting—a silent, written idea-generation technique. The prompt is a request to list reasons behind the risk question, such as “List reasons why the API batch failed impurity specifications”. Participants anonymously write risks on structured templates for 10–15 minutes, ensuring all experts contribute equally.
The collected ideas are then synthesized into a fishbone (Ishikawa) diagram, categorizing causes relevant branches, using a 6 M technique.
This method ensures comprehensive risk identification while maintaining traceability for regulatory audits.
3. Risk Prioritization and Control Strategy Development
Risks identified during the pre-mortem are evaluated using a severity-probability-detectability matrix, structured similarly to Failure Mode and Effects Analysis (FMEA).
4. Integration into Pharmaceutical Quality Systems
Mitigation plans are formalized in in control strategies and other mechanisms.
Case Study: Preventing Drug Substance Oxidation in a Small Molecule API
A company developing an oxidation-prone API conducted a pre-mortem anticipating discoloration and potency loss. The exercise revealed:
Drug substance risk: Inadequate nitrogen sparging during final isolation led to residual oxygen in crystallization vessels.
Drug product risk: Blister packaging with insufficient moisture barrier exacerbated degradation.
Mitigations included installing dissolved oxygen probes in purification tanks and switching to aluminum-foil blisters with desiccants. Process validation batches showed a 90% reduction in oxidation byproducts, avoiding a potential FDA Postmarketing Commitment
Achieving maturity in commissioning, qualification, and validation (CQV) processes is vital for ensuring regulatory compliance, operational excellence, and product quality. However, advancing maturity requires more than adherence to protocols; it demands a learning culture that encourages reflection, adaptation, and innovation. Learning logs—structured tools for capturing experiences and insights—can play a transformative role in this journey. By introducing learning logs into CQV workflows, organizations can bridge the gap between compliance-driven processes and continuous improvement.
What Are Learning Logs?
A learning log is a reflective tool used to document key events, challenges, insights, and lessons learned during a specific activity or process. Unlike traditional record-keeping methods that focus on compliance or task completion, learning logs emphasize understanding and growth. They allow individuals or teams to capture their experiences in real time and revisit them later to extract deeper meaning. For example, a learning log might include the date of an event, the situation encountered, results achieved, insights gained, and next steps. Over time, these entries provide a rich repository of knowledge that can be leveraged for better decision-making.
The structure of a learning log can vary depending on the needs of the team or organization. Some may prefer simple spreadsheets to track entries by project or event type, while others might use visual tools like Miro boards for creative pattern recognition. Regardless of format, the key is to keep logs practical and focused on capturing meaningful “aha” moments rather than exhaustive details. Pairing learning logs with periodic team discussions—known as learning conversations—can amplify their impact by encouraging reflection and collaboration.
Learning logs are particularly effective because they combine assessment with reflection. They help individuals articulate what they’ve learned, identify areas for improvement, and plan future actions. This process fosters critical thinking and embeds continuous learning into daily workflows. In essence, learning logs are not just tools for documentation; they are catalysts for organizational growth.
Applying Learning Logs to CQV
In pharmaceutical CQV processes—where precision and compliance are paramount—learning logs can serve as powerful instruments for driving maturity. These processes often involve complex activities such as equipment commissioning, qualification (OQ), and product/process validation. Introducing learning logs into CQV workflows enables teams to capture insights that go beyond standard deviation reporting or audit trails.
During commissioning, for instance, engineers can use learning logs to document unexpected equipment behavior and the steps taken to resolve issues. These entries create a knowledge base that can inform future commissioning projects and reduce repeat errors. Similarly, in qualification phases, teams can reflect on deviations from expected outcomes and adjustments made to protocols. Validation activities benefit from logs that highlight inefficiencies or opportunities for optimization, ensuring long-term consistency in manufacturing processes.
By systematically capturing these reflections in learning logs, organizations can accelerate knowledge transfer across teams. Logs become living repositories of troubleshooting methods, risk scenarios, and process improvements that reduce redundancy in future projects. For example, if a team encounters calibration drift during equipment qualification and resolves it by updating SOPs, documenting this insight ensures that future teams can anticipate similar challenges.
Driving CQV Maturity Through Reflection
Learning logs also help close the loop between compliance-driven processes and innovation by emphasizing critical analysis. Reflective questions such as “What worked? What failed? What could we do differently?” uncover root causes of deviations that might otherwise remain unaddressed in traditional reporting systems. Logs can highlight overly complex steps in protocols or inefficiencies in workflows, enabling teams to streamline operations.
Moreover, integrating learning logs into change control processes ensures that past insights inform future decisions. When modifying validated systems or introducing new equipment, reviewing previous log entries helps predict risks and avoid repeating mistakes. This proactive approach aligns with the principles of continuous improvement embedded in GMP practices.
Cultivating a Learning Culture
To fully realize the benefits of learning logs in CQV workflows, organizations must foster a culture of reflection and collaboration. Leaders play a crucial role by modeling the use of learning logs during team meetings or retrospectives. Encouraging open discussions about log entries creates psychological safety where employees feel comfortable sharing challenges and ideas for improvement.
Gamification can further enhance engagement with learning logs by rewarding teams for actionable insights that optimize CQV timelines or reduce deviations. Linking log-derived improvements to KPIs—such as reductions in repeat deviations or faster protocol execution—demonstrates their tangible value to the organization.
The Future of CQV: Learning-Driven Excellence
As pharmaceutical manufacturing evolves with technologies like AI and digital twins, learning logs will become even more dynamic tools for driving CQV maturity. Machine learning algorithms could analyze log data to predict validation risks or identify recurring challenges across global sites. Real-time dashboards may visualize patterns from log entries to inform decision-making at scale.
By embedding learning logs into CQV workflows alongside compliance protocols, organizations can transform reactive processes into proactive systems of excellence. Teams don’t just meet regulatory requirements—they anticipate challenges, adapt seamlessly, and innovate continuously.
Next Step: Start small by introducing learning logs into one CQV process this month—perhaps equipment commissioning—and measure how insights shift team problem-solving approaches over time. Share your findings across departments to scale what works and build momentum toward maturity.
Continuous Process Verification (CPV) represents the final and most dynamic stage of the FDA’s process validation lifecycle, designed to ensure manufacturing processes remain validated during routine production. The methodology for CPV and the selection of appropriate tools are deeply rooted in the FDA’s 2011 guidance, Process Validation: General Principles and Practices, which emphasizes a science- and risk-based approach to quality assurance. This blog post examines how CPV methodologies align with regulatory frameworks and how tools are selected to meet compliance and operational objectives.
CPV Methodology: Anchored in the FDA’s Lifecycle Approach
The FDA’s process validation framework divides activities into three stages: Process Design (Stage 1), Process Qualification (Stage 2), and Continued Process Verification (Stage 3). CPV, as Stage 3, is not an isolated activity but a continuation of the knowledge gained in earlier stages. This lifecycle approach is our framework.
Stage 1: Process Design
During Stage 1, manufacturers define Critical Quality Attributes (CQAs) and Critical Process Parameters (CPPs) through risk assessments and experimental design. This phase establishes the scientific basis for monitoring and control strategies. For example, if a parameter’s variability is inherently low (e.g., clustering near the Limit of Quantification, or LOQ), this knowledge informs later decisions about CPV tools.
Stage 2: Process Qualification
Stage 2 confirms that the process, when operated within established parameters, consistently produces quality products. Data from this stage—such as process capability indices (Cpk/Ppk)—provide baseline metrics for CPV. For instance, a high Cpk (>2) for a parameter near LOQ signals that traditional control charts may be inappropriate due to limited variability.
Stage 3: Continued Process Verification
CPV methodology is defined by two pillars:
Ongoing Monitoring: Continuous collection and analysis of CPP/CQA data.
Adaptive Control: Adjustments to maintain process control, informed by statistical and risk-based insights.
Regulatory agencies require that CPV methodologies must be tailored to the process’s unique characteristics. For example, a parameter with data clustered near LOQ (as in the case study) demands a different approach than one with normal variability.
Selecting CPV Tools: Aligning with Data and Risk
The framework emphasizes that CPV tools must be scientifically justified, with selection criteria based on data suitability, risk criticality, and regulatory alignment.
Data Suitability Assessments
Data suitability assessments form the bedrock of effective Continuous Process Verification (CPV) programs, ensuring that monitoring tools align with the statistical and analytical realities of the process. These assessments are not merely technical exercises but strategic activities rooted in regulatory expectations, scientific rigor, and risk management. Below, we explore the three pillars of data suitability—distribution analysis, process capability evaluation, and analytical performance considerations—and their implications for CPV tool selection.
The foundation of any statistical monitoring system lies in understanding the distribution of the data being analyzed. Many traditional tools, such as control charts, assume that data follows a normal (Gaussian) distribution. This assumption underpins the calculation of control limits (e.g., ±3σ) and the interpretation of rule violations. To validate this assumption, manufacturers employ tests such as the Shapiro-Wilk test or Anderson-Darling test, which quantitatively assess normality. Visual tools like Q-Q plots or histograms complement these tests by providing intuitive insights into data skewness, kurtosis, or clustering.
When data deviates significantly from normality—common in parameters with values clustered near detection or quantification limits (e.g., LOQ)—the use of parametric tools like control charts becomes problematic. For instance, a parameter with 95% of its data below the LOQ may exhibit a left-skewed distribution, where the calculated mean and standard deviation are distorted by the analytical method’s noise rather than reflecting true process behavior. In such cases, traditional control charts generate misleading signals, such as Rule 1 violations (±3σ), which flag analytical variability rather than process shifts.
To address non-normal data, manufacturers must transition to non-parametric methods that do not rely on distributional assumptions. Tolerance intervals, which define ranges covering a specified proportion of the population with a given confidence level, are particularly useful for skewed datasets. For example, a 95/99 tolerance interval (95% of data within 99% confidence) can replace ±3σ limits for non-normal data, reducing false positives. Bootstrapping—a resampling technique—offers another alternative, enabling robust estimation of control limits without assuming normality.
Process Capability: Aligning Tools with Inherent Variability
Process capability indices, such as Cp and Cpk, quantify a parameter’s ability to meet specifications relative to its natural variability. A high Cp (>2) indicates that the process variability is small compared to the specification range, often resulting from tight manufacturing controls or robust product designs. While high capability is desirable for quality, it complicates CPV tool selection. For example, a parameter with a Cp of 3 and data clustered near the LOQ will exhibit minimal variability, rendering control charts ineffective. The narrow spread of data means that control limits shrink, increasing the likelihood of false alarms from minor analytical noise.
In such scenarios, traditional SPC tools like control charts lose their utility. Instead, manufacturers should adopt attribute-based monitoring or batch-wise trending. Attribute-based approaches classify results as pass/fail against predefined thresholds (e.g., LOQ breaches), simplifying signal interpretation. Batch-wise trending aggregates data across production lots, identifying shifts over time without overreacting to individual outliers. For instance, a manufacturer with a high-capability dissolution parameter might track the percentage of batches meeting dissolution criteria monthly, rather than plotting individual tablet results.
The FDA’s emphasis on risk-based monitoring further supports this shift. ICH Q9 guidelines encourage manufacturers to prioritize resources for high-risk parameters, allowing low-risk, high-capability parameters to be monitored with simpler tools. This approach reduces administrative burden while maintaining compliance.
Analytical Performance: Decoupling Noise from Process Signals
Parameters operating near analytical limits of detection (LOD) or quantification (LOQ) present unique challenges. At these extremes, measurement systems contribute significant variability, often overshadowing true process signals. For example, a purity assay with an LOQ of 0.1% may report values as “<0.1%” for 98% of batches, creating a dataset dominated by the analytical method’s imprecision. In such cases, failing to decouple analytical variability from process performance leads to misguided investigations and wasted resources.
To address this, manufacturers must isolate analytical variability through dedicated method monitoring programs. This involves:
Analytical Method Validation: Rigorous characterization of precision, accuracy, and detection capabilities (e.g., determining the Practical Quantitation Limit, or PQL, which reflects real-world method performance).
Separate Trending: Implementing control charts or capability analyses for the analytical method itself (e.g., monitoring LOQ stability across batches).
Threshold-Based Alerts: Replacing statistical rules with binary triggers (e.g., investigating only results above LOQ).
For example, a manufacturer analyzing residual solvents near the LOQ might use detection capability indices to set action limits. If the analytical method’s variability (e.g., ±0.02% at LOQ) exceeds the process variability, threshold alerts focused on detecting values above 0.1% + 3σ_analytical would provide more meaningful signals than traditional control charts.
Integration with Regulatory Expectations
Regulatory agencies, including the FDA and EMA, mandate that CPV methodologies be “scientifically sound” and “statistically valid” (FDA 2011 Guidance). This requires documented justification for tool selection, including:
Normality Testing: Evidence that data distribution aligns with tool assumptions (e.g., Shapiro-Wilk test results).
Capability Analysis: Cp/Cpk values demonstrating the rationale for simplified monitoring.
A 2024 FDA warning letter highlighted the consequences of neglecting these steps. A firm using control charts for non-normal dissolution data received a 483 observation for lacking statistical rationale, underscoring the need for rigor in data suitability assessments.
Case Study Application: A manufacturer monitoring a CQA with 98% of data below LOQ initially used control charts, triggering frequent Rule 1 violations (±3σ). These violations reflected analytical noise, not process shifts. Transitioning to threshold-based alerts (investigating only LOQ breaches) reduced false positives by 72% while maintaining compliance.
Risk-Based Tool Selection
The ICH Q9 Quality Risk Management (QRM) framework provides a structured methodology for identifying, assessing, and controlling risks to pharmaceutical product quality, with a strong emphasis on aligning tool selection with the parameter’s impact on patient safety and product efficacy. Central to this approach is the principle that the rigor of risk management activities—including the selection of tools—should be proportionate to the criticality of the parameter under evaluation. This ensures resources are allocated efficiently, focusing on high-impact risks while avoiding overburdening low-risk areas.
Prioritizing Tools Through the Lens of Risk Impact
The ICH Q9 framework categorizes risks based on their potential to compromise product quality, guided by factors such as severity, detectability, and probability. Parameters with a direct impact on critical quality attributes (CQAs)—such as potency, purity, or sterility—are classified as high-risk and demand robust analytical tools. Conversely, parameters with minimal impact may require simpler methods. For example:
High-Impact Parameters: Use Failure Mode and Effects Analysis (FMEA) or Fault Tree Analysis (FTA) to dissect failure modes, root causes, and mitigation strategies.
Medium-Impact Parameters: Apply a tool such as a PHA.
Low-Impact Parameters: Utilize checklists or flowcharts for basic risk identification.
This tiered approach ensures that the complexity of the tool matches the parameter’s risk profile.
Importance: The parameter’s criticality to patient safety or product efficacy.
Complexity: The interdependencies of the system or process being assessed.
Uncertainty: Gaps in knowledge about the parameter’s behavior or controls.
For instance, a high-purity active pharmaceutical ingredient (API) with narrow specification limits (high importance) and variable raw material inputs (high complexity) would necessitate FMEA to map failure modes across the supply chain. In contrast, a non-critical excipient with stable sourcing (low uncertainty) might only require a simplified risk ranking matrix.
Implementing a Risk-Based Approach
1. Assess Parameter Criticality
Begin by categorizing parameters based on their impact on CQAs, as defined during Stage 1 (Process Design) of the FDA’s validation lifecycle. Parameters are classified as:
Critical: Directly affecting safety/efficacy
Key: Influencing quality but not directly linked to safety
Non-Critical: No measurable impact on quality
This classification informs the depth of risk assessment and tool selection.
2. Select Tools Using the ICU Framework
Importance-Driven Tools: High-importance parameters warrant tools that quantify risk severity and detectability. FMEA is ideal for linking failure modes to patient harm, while Statistical Process Control (SPC) charts monitor real-time variability.
Complexity-Driven Tools: For multi-step processes (e.g., bioreactor operations), HACCP identifies critical control points, while Ishikawa diagrams map cause-effect relationships.
Uncertainty-Driven Tools: Parameters with limited historical data (e.g., novel drug formulations) benefit from Bayesian statistical models or Monte Carlo simulations to address knowledge gaps.
3. Document and Justify Tool Selection
Regulatory agencies require documented rationale for tool choices. For example, a firm using FMEA for a high-risk sterilization process must reference its ability to evaluate worst-case scenarios and prioritize mitigations. This documentation is typically embedded in Quality Risk Management (QRM) Plans or validation protocols.
Integration with Living Risk Assessments
Living risk assessments are dynamic, evolving documents that reflect real-time process knowledge and data. Unlike static, ad-hoc assessments, they are continually updated through:
1. Ongoing Data Integration
Data from Continual Process Verification (CPV)—such as trend analyses of CPPs/CQAs—feeds directly into living risk assessments. For example, shifts in fermentation yield detected via SPC charts trigger updates to bioreactor risk profiles, prompting tool adjustments (e.g., upgrading from checklists to FMEA).
2. Periodic Review Cycles
Living assessments undergo scheduled reviews (e.g., biannually) and event-driven updates (e.g., post-deviation). A QRM Master Plan, as outlined in ICH Q9(R1), orchestrates these reviews by mapping assessment frequencies to parameter criticality. High-impact parameters may be reviewed quarterly, while low-impact ones are assessed annually.
3. Cross-Functional Collaboration
Quality, manufacturing, and regulatory teams collaborate to interpret CPV data and update risk controls. For instance, a rise in particulate matter in vials (detected via CPV) prompts a joint review of filling line risk assessments, potentially revising tooling from HACCP to FMEA to address newly identified failure modes.
Regulatory Expectations and Compliance
Regulatory agencies requires documented justification for CPV tool selection, emphasizing:
Protocol Preapproval: CPV plans must be submitted during Stage 2, detailing tool selection criteria.
Change Control: Transitions between tools (e.g., SPC → thresholds) require risk assessments and documentation.
Training: Staff must be proficient in both traditional (e.g., Shewhart charts) and modern tools (e.g., AI).
A 2024 FDA warning letter cited a firm for using control charts on non-normal data without validation, underscoring the consequences of poor tool alignment.
A Framework for Adaptive Excellence
The FDA’s CPV framework is not prescriptive but principles-based, allowing flexibility in methodology and tool selection. Successful implementation hinges on:
Science-Driven Decisions: Align tools with data characteristics and process capability.
Risk-Based Prioritization: Focus resources on high-impact parameters.
Regulatory Agility: Justify tool choices through documented risk assessments and lifecycle data.
CPV is a living system that must evolve alongside processes, leveraging tools that balance compliance with operational pragmatism. By anchoring decisions in the FDA’s lifecycle approach, manufacturers can transform CPV from a regulatory obligation into a strategic asset for quality excellence.