The Deliberate Path: From Framework to Tool Selection in Quality Systems

Just as magpies are attracted to shiny objects, collecting them without purpose or pattern, professionals often find themselves drawn to the latest tools, techniques, or technologies that promise quick fixes or dramatic improvements. We attend conferences, read articles, participate in webinars, and invariably come away with new tools to add to our professional toolkit.

A picture of a magpie
https://commons.wikimedia.org/wiki/File:Common_magpie_(Pica_pica).jpg

This approach typically manifests in several recognizable patterns. You might see a quality professional enthusiastically implementing a fishbone diagram after attending a workshop, only to abandon it a month later for a new problem-solving methodology learned in a webinar. Or you’ve witnessed a manager who insists on using a particular project management tool simply because it worked well in their previous organization, regardless of its fit for current challenges. Even more common is the organization that accumulates a patchwork of disconnected tools over time – FMEA here, 5S there, with perhaps some Six Sigma tools sprinkled throughout – without a coherent strategy binding them together.

The consequences of this unsystematic approach are far-reaching. Teams become confused by constantly changing methodologies. Organizations waste resources on tools that don’t address fundamental needs and fail to build coherent quality systems that sustainably drive improvement. Instead, they create what might appear impressive on the surface but is fundamentally an incoherent collection of disconnected tools and techniques.

As I discussed in my recent post on methodologies, frameworks, and tools, this haphazard approach represents a fundamental misunderstanding of how effective quality systems function. The solution isn’t simply to stop acquiring new tools but to be deliberate and systematic in evaluating, selecting, and implementing them by starting with frameworks – the conceptual scaffolding that provides structure and guidance for our quality efforts – and working methodically toward appropriate tool selection.

I will outline a path from frameworks to tools in this post, utilizing the document pyramid as a structural guide. We’ll examine how the principles of sound systems design can inform this journey, how coherence emerges from thoughtful alignment of frameworks and tools, and how maturity models can help us track our progress. By the end, you’ll have a clear roadmap for transforming your organization’s approach to tool selection from random collection to strategic implementation.

Understanding the Hierarchy: Frameworks, Methodologies, and Tools

Here is a brief refresher:

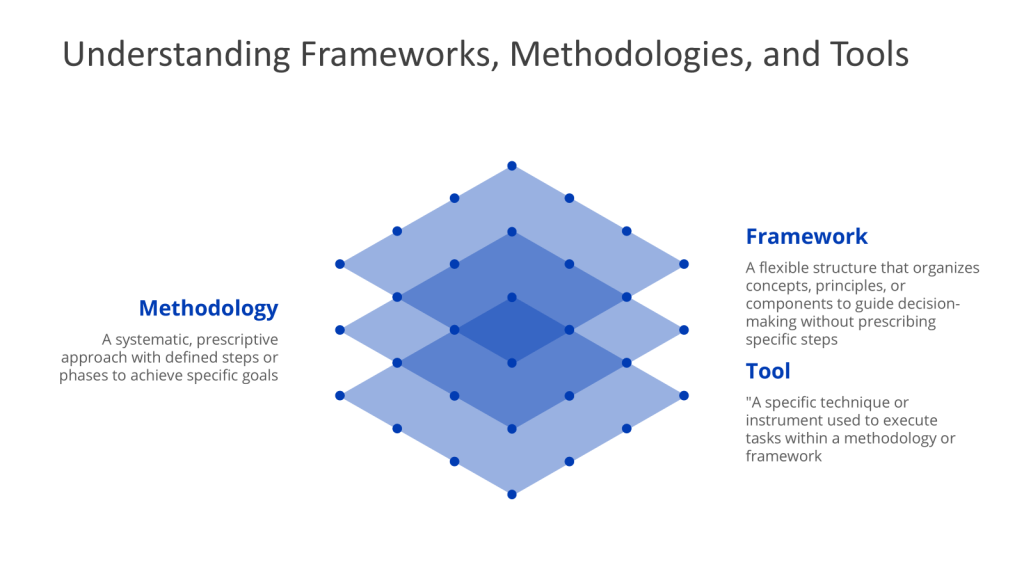
  • A framework provides a flexible structure that organizes concepts, principles, and practices to guide decision-making. Unlike methodologies, frameworks are not rigidly sequential; they provide a mental model or lens through which problems can be analyzed. Frameworks emphasize what needs to be addressed rather than how to address it.
  • A methodology is a systematic, step-by-step approach to solving problems or achieving objectives. It provides a structured sequence of actions, often grounded in theoretical principles, and defines how tasks should be executed. Methodologies are prescriptive, offering clear guidelines to ensure consistency and repeatability.
  • A tool is a specific technique, model, or instrument used to execute tasks within a methodology or framework. Tools are action-oriented and often designed for a singular purpose, such as data collection, analysis, or visualization.

How They Interrelate: Building a Cohesive Strategy

The relationship between frameworks, methodologies, and tools is not merely hierarchical but interconnected and synergistic. A framework provides the conceptual structure for understanding a problem, the methodology defines the execution plan, and tools enable practical implementation.

To illustrate this integration, consider how these elements work together in various contexts:

In Systems Thinking:

  • Framework: Systems theory identifies inputs, processes, outputs, and feedback loops
  • Methodology: A 5-phase approach (problem structuring, dynamic modeling, scenario planning) guides analysis
  • Tools: Causal loop diagrams map relationships; simulation software models system behavior

In Quality by Design (QbD):

  • Framework: The ICH Q8 guideline outlines quality objectives
  • Methodology: Define QTPP → Identify Critical Quality Attributes → Design experiments
  • Tools: Design of Experiments (DoE) optimizes process parameters

Without frameworks, methodologies lack context and direction. Without methodologies, frameworks remain theoretical abstractions. Without tools, methodologies cannot be operationalized. The coherence and effectiveness of a quality management system depend on the proper alignment and integration of all three elements.

Understanding this hierarchy and interconnection is essential as we move toward establishing a deliberate path from frameworks to tools using the document pyramid structure.

The Document Pyramid: A Structure for Implementation

The document pyramid represents a hierarchical approach to organizing quality management documentation, which provides an excellent structure for mapping the path from frameworks to tools. In traditional quality systems, this pyramid typically consists of four levels: policies, procedures, work instructions, and records. However, I’ve found that adding an intermediate “program” level between policies and procedures creates a more effective bridge between high-level requirements and operational implementation.

Traditional Document Hierarchy in Quality Systems

Before examining the enhanced pyramid, let’s understand the traditional structure:

Policy Level: At the apex of the pyramid, policies establish the “what” – the requirements that must be met. They articulate the organization’s intentions, direction, and commitments regarding quality. Policies are typically broad, principle-based statements that apply across the organization.

Procedure Level: Procedures define the “who, what, when” of activities. They outline the sequence of steps, responsibilities, and timing for key processes. Procedures are more specific than policies but still focus on process flow rather than detailed execution.

Work Instruction Level: Work instructions provide the “how” – detailed steps for performing specific tasks. They offer step-by-step guidance for executing activities and are typically used by frontline staff directly performing the work.

Records Level: At the base of the pyramid, records provide evidence that work was performed according to requirements. They document the results of activities and serve as proof of compliance.

This structure establishes a logical flow from high-level requirements to detailed execution and documentation. However, in complex environments where requirements must be interpreted in various ways for different contexts, a gap often emerges between policies and procedures.

The Enhanced Pyramid: Adding the Program Level

To address this gap, I propose adding a “program” level between policies and procedures. The program level serves as a mapping requirement that shows the various ways to interpret high-level requirements for specific needs.

The beauty of the program document is that it helps translate from requirements (both internal and external) to processes and procedures. It explains how they interact and how they’re supported by technical assessments, risk management, and other control activities. Think of it as the design document and the connective tissue of your quality system.

With this enhanced structure, the document pyramid now consists of five levels:

  1. Policy Level (frameworks): Establishes what must be done
  2. Program Level (methodologies): Translates requirements into systems design
  3. Procedure Level: Defines who, what, when of activities
  4. Work Instruction Level (tools): Provides detailed how-to guidance
  5. Records Level: Evidences that activities were performed

This enhanced pyramid provides a clear structure for mapping our journey from frameworks to tools.

The image depicts a "Quality Management Pyramid," which is a hierarchical representation of quality management elements. The pyramid is divided into six levels from top to bottom, with corresponding labels:

Quality Manual (top tier, dark gray): Represents the "Vision" of quality management.

Policy (second tier, light blue): Represents "Strategy."

Program (third tier, teal): Represents "Strategy."

Process (fourth tier, orange-brown): Includes Standard Operating Procedures (SOPs) and Analytical Methods, representing "Tactics."

Procedure (fifth tier, dark blue): Includes Work Instructions, digital execution systems, and job aids as tools, representing "Tactics."

Reports and Records (bottom tier, yellow): Represents "Results."

Each level is accompanied by icons symbolizing its content and purpose. The pyramid visually organizes the hierarchy of documents and actions in quality management from high-level vision to actionable results.

Mapping Frameworks, Methodologies, and Tools to the Document Pyramid

When we overlay our hierarchy of frameworks, methodologies, and tools onto the document pyramid, we can see the natural alignment:

Frameworks operate at the Policy Level. They establish the conceptual structure and principles that guide the entire quality system. Policies articulate the “what” of quality management, just as frameworks define the “what” that needs to be addressed.

Methodologies align with the Program Level. They translate the conceptual guidance of frameworks into systematic approaches for implementation. The program level provides the connective tissue between high-level requirements and operational processes, similar to how methodologies bridge conceptual frameworks and practical tools.

Tools correspond to the Work Instruction Level. They provide specific techniques for executing tasks, just as work instructions detail exactly how to perform activities. Both are concerned with practical, hands-on implementation.

The Procedure Level sits between methodologies and tools, providing the organizational structure and process flow that guide tool selection and application. Procedures define who will use which tools, when they will be used, and in what sequence.

Finally, Records provide evidence of proper tool application and effectiveness. They document the results achieved through the application of tools within the context of methodologies and frameworks.

This mapping provides a structural framework for our journey from high-level concepts to practical implementation. It helps ensure that tool selection is not arbitrary but rather guided by and aligned with the organization’s overall quality framework and methodology.

Systems Thinking as a Meta-Framework

To guide our journey from frameworks to tools, we need a meta-framework that provides overarching principles for system design and evaluation. Systems thinking offers such a meta-framework, and I believe we can apply eight key principles that can be applied across the document pyramid to ensure coherence and effectiveness in our quality management system.

The Eight Principles of Good Systems

These eight principles form the foundation of effective system design, regardless of the specific framework, methodology, or tools employed:

Balance

Definition: The system creates value for multiple stakeholders. While the ideal is to develop a design that maximizes value for all key stakeholders, designers often must compromise and balance the needs of various stakeholders.

Application across the pyramid:

  • At the Policy/Framework level, balance ensures that quality objectives serve multiple organizational goals (compliance, customer satisfaction, operational efficiency)
  • At the Program/Methodology level, balance guides the design of systems that address diverse stakeholder needs
  • At the Work Instruction/Tool level, balance influences tool selection to ensure all stakeholder perspectives are considered

Congruence

Definition: The degree to which system components are aligned and consistent with each other and with other organizational systems, culture, plans, processes, information, resource decisions, and actions.

Application across the pyramid:

  • At the Policy/Framework level, congruence ensures alignment between quality frameworks and organizational strategy
  • At the Program/Methodology level, congruence guides the development of methodologies that integrate with existing systems
  • At the Work Instruction/Tool level, congruence ensures selected tools complement rather than contradict each other

Convenience

Definition: The system is designed to be as convenient as possible for participants to implement (a.k.a. user-friendly). The system includes specific processes, procedures, and controls only when necessary.

Application across the pyramid:

  • At the Policy/Framework level, convenience influences the selection of frameworks that suit organizational culture
  • At the Program/Methodology level, convenience shapes methodologies to be practical and accessible
  • At the Work Instruction/Tool level, convenience drives the selection of tools that users can easily adopt and apply

Coordination

Definition: System components are interconnected and harmonized with other (internal and external) components, systems, plans, processes, information, and resource decisions toward common action or effort. This goes beyond congruence and is achieved when individual components operate as a fully interconnected unit.

Application across the pyramid:

  • At the Policy/Framework level, coordination ensures frameworks complement each other
  • At the Program/Methodology level, coordination guides the development of methodologies that work together as an integrated system
  • At the Work Instruction/Tool level, coordination ensures tools are compatible and support each other

Elegance

Definition: Complexity vs. benefit — the system includes only enough complexity as necessary to meet stakeholders’ needs. In other words, keep the design as simple as possible but no simpler while delivering the desired benefits.

Application across the pyramid:

  • At the Policy/Framework level, elegance guides the selection of frameworks that provide sufficient but not excessive structure
  • At the Program/Methodology level, elegance shapes methodologies to include only necessary steps
  • At the Work Instruction/Tool level, elegance influences the selection of tools that solve problems without introducing unnecessary complexity

Human-Centered

Definition: Participants in the system are able to find joy, purpose, and meaning in their work.

Application across the pyramid:

  • At the Policy/Framework level, human-centeredness ensures frameworks consider human factors
  • At the Program/Methodology level, human-centeredness shapes methodologies to engage and empower participants
  • At the Work Instruction/Tool level, human-centeredness drives the selection of tools that enhance rather than diminish human capabilities

Learning

Definition: Knowledge management, with opportunities for reflection and learning (learning loops), is designed into the system. Reflection and learning are built into the system at key points to encourage single- and double-loop learning from experience.

Application across the pyramid:

  • At the Policy/Framework level, learning influences the selection of frameworks that promote improvement
  • At the Program/Methodology level, learning shapes methodologies to include feedback mechanisms
  • At the Work Instruction/Tool level, learning drives the selection of tools that generate insights and promote knowledge creation

Sustainability

Definition: The system effectively meets the near- and long-term needs of current stakeholders without compromising the ability of future generations of stakeholders to meet their own needs.

Application across the pyramid:

  • At the Policy/Framework level, sustainability ensures frameworks consider long-term viability
  • At the Program/Methodology level, sustainability shapes methodologies to create lasting value
  • At the Work Instruction/Tool level, sustainability influences the selection of tools that provide enduring benefits

These eight principles serve as evaluation criteria throughout our journey from frameworks to tools. They help ensure that each level of the document pyramid contributes to a coherent, effective, and sustainable quality system.

Systems Thinking and the Five Key Questions

In addition to these eight principles, systems thinking guides us to ask five key questions that apply across the document pyramid:

  1. What is the purpose of the system? What happens in the system?
  2. What is the system? What’s inside? What’s outside? Set the boundaries, the internal elements, and elements of the system’s environment.
  3. What are the internal structure and dependencies?
  4. How does the system behave? What are the system’s emergent behaviors, and do we understand their causes and dynamics?
  5. What is the context? Usually in terms of bigger systems and interacting systems.

Answering these questions at each level of the document pyramid helps ensure alignment and coherence. For example:

  • At the Policy/Framework level, we ask about the overall purpose of our quality system, its boundaries, and its context within the broader organization
  • At the Program/Methodology level, we define the internal structure and dependencies of specific quality initiatives
  • At the Work Instruction/Tool level, we examine how individual tools contribute to system behavior and objectives

By applying systems thinking principles and questions throughout our journey from frameworks to tools, we create a coherent quality system rather than a collection of disconnected elements.

Coherence in Quality Systems

Coherence goes beyond mere alignment or consistency. While alignment ensures that different elements point in the same direction, coherence creates a deeper harmony where components work together to produce emergent properties that transcend their individual contributions.

In quality systems, coherence means that our frameworks, methodologies, and tools don’t merely align on paper but actually work together organically to produce desired outcomes. The parts reinforce each other, creating a whole that is greater than the sum of its parts.

Building Coherence Through the Document Pyramid

The enhanced document pyramid provides an excellent structure for building coherence in quality systems. Each level must not only align with those above and below it but also contribute to the emergent properties of the whole system.

At the Policy/Framework level, coherence begins with selecting frameworks that complement each other and align with organizational context. For example, combining systems thinking with Quality by Design creates a more coherent foundation than either framework alone.

At the Program/Methodology level, coherence develops through methodologies that translate framework principles into practical approaches while maintaining their essential character. The program level is where we design systems that build order through their function rather than through rigid control.

At the Procedure level, coherence requires processes that flow naturally from methodologies while addressing practical organizational needs. Procedures should feel like natural expressions of higher-level principles rather than arbitrary rules.

At the Work Instruction/Tool level, coherence depends on selecting tools that embody the principles of chosen frameworks and methodologies. Tools should not merely execute tasks but reinforce the underlying philosophy of the quality system.

Throughout the pyramid, coherence is enhanced by using similar building blocks across systems. Risk management, data integrity, and knowledge management can serve as common elements that create consistency while allowing for adaptation to specific contexts.

The Framework-to-Tool Path: A Structured Approach

Building on the foundations we’ve established – the hierarchy of frameworks, methodologies, and tools; the enhanced document pyramid; systems thinking principles; and coherence concepts – we can now outline a structured approach for moving from frameworks to tools in a deliberate and coherent manner.

Step 1: Framework Selection Based on System Needs

The journey begins at the Policy level with the selection of appropriate frameworks. This selection should be guided by organizational context, strategic objectives, and the nature of the challenges being addressed.

Key considerations in framework selection include:

  • System Purpose: What are we trying to achieve? Different frameworks emphasize different aspects of quality (e.g., risk reduction, customer satisfaction, operational excellence).
  • System Context: What is our operating environment? Regulatory requirements, industry standards, and market conditions all influence framework selection.
  • Stakeholder Needs: Whose interests must be served? Frameworks should balance the needs of various stakeholders, from customers and employees to regulators and shareholders.
  • Organizational Culture: What approaches will resonate with our people? Frameworks should align with organizational values and ways of working.

Examples of quality frameworks include Systems Thinking, Quality by Design (QbD), Total Quality Management (TQM), and various ISO standards. Organizations often adopt multiple complementary frameworks to address different aspects of their quality system.

The output of this step is a clear articulation of the selected frameworks in policy documents that establish the conceptual foundation for all subsequent quality efforts.

Step 2: Translating Frameworks to Methodologies

At the Program level, we translate the selected frameworks into methodologies that provide systematic approaches for implementation. This translation occurs through program documents that serve as connective tissue between high-level principles and operational procedures.

Key activities in this step include:

  • Framework Interpretation: How do our chosen frameworks apply to our specific context? Program documents explain how framework principles translate into organizational approaches.
  • Methodology Selection: What systematic approaches will implement our frameworks? Examples include Six Sigma (DMAIC), 8D problem-solving, and various risk management methodologies.
  • System Design: How will our methodologies work together as a coherent system? Program documents outline the interconnections and dependencies between different methodologies.
  • Resource Allocation: What resources are needed to support these methodologies? Program documents identify the people, time, and tools required for successful implementation.

The output of this step is a set of program documents that define the methodologies to be employed across the organization, explaining how they embody the chosen frameworks and how they work together as a coherent system.

Step 3: The Document Pyramid as Implementation Structure

With frameworks translated into methodologies, we use the document pyramid to structure their implementation throughout the organization. This involves creating procedures, work instructions, and records that bring methodologies to life in day-to-day operations.

Key aspects of this step include:

  • Procedure Development: At the Procedure level, we define who does what, when, and in what sequence. Procedures establish the process flows that implement methodologies without specifying detailed steps.
  • Work Instruction Creation: At the Work Instruction level, we provide detailed guidance on how to perform specific tasks. Work instructions translate methodological steps into practical actions.
  • Record Definition: At the Records level, we establish what evidence will be collected to demonstrate that processes are working as intended. Records provide feedback for evaluation and improvement.

The document pyramid ensures that there’s a clear line of sight from high-level frameworks to day-to-day activities, with each level providing appropriate detail for its intended audience and purpose.

Step 4: Tool Selection Criteria Derived from Higher Levels

With the structure in place, we can now establish criteria for tool selection that ensure alignment with frameworks and methodologies. These criteria are derived from the higher levels of the document pyramid, ensuring that tool selection serves overall system objectives.

Key criteria for tool selection include:

  • Framework Alignment: Does the tool embody the principles of our chosen frameworks? Tools should reinforce rather than contradict the conceptual foundation of the quality system.
  • Methodological Fit: Does the tool support the systematic approach defined in our methodologies? Tools should be appropriate for the specific methodology they’re implementing.
  • System Integration: Does the tool integrate with other tools and systems? Tools should contribute to overall system coherence rather than creating silos.
  • User Needs: Does the tool address the needs and capabilities of its users? Tools should be accessible and valuable to the people who will use them.
  • Value Contribution: Does the tool provide value that justifies its cost and complexity? Tools should deliver benefits that outweigh their implementation and maintenance costs.

These criteria ensure that tool selection is guided by frameworks and methodologies rather than by trends or personal preferences.

Step 5: Evaluating Tools Against Framework Principles

Finally, we evaluate specific tools against our selection criteria and the principles of good systems design. This evaluation ensures that the tools we choose not only fulfill specific functions but also contribute to the coherence and effectiveness of the overall quality system.

For each tool under consideration, we ask:

  • Balance: Does this tool address the needs of multiple stakeholders, or does it serve only limited interests?
  • Congruence: Is this tool aligned with our frameworks, methodologies, and other tools?
  • Convenience: Is this tool user-friendly and practical for regular use?
  • Coordination: Does this tool work harmoniously with other components of our system?
  • Elegance: Does this tool provide sufficient functionality without unnecessary complexity?
  • Human-Centered: Does this tool enhance rather than diminish the human experience?
  • Learning: Does this tool provide opportunities for reflection and improvement?
  • Sustainability: Will this tool provide lasting value, or will it quickly become obsolete?

Tools that score well across these dimensions are more likely to contribute to a coherent and effective quality system than those that excel in only one or two areas.

The result of this structured approach is a deliberate path from frameworks to tools that ensures coherence, effectiveness, and sustainability in the quality system. Each tool is selected not in isolation but as part of a coherent whole, guided by frameworks and methodologies that provide context and direction.

Maturity Models: Tracking Implementation Progress

As organizations implement the framework-to-tool path, they need ways to assess their progress and identify areas for improvement. Maturity models provide structured frameworks for this assessment, helping organizations benchmark their current state and plan their development journey.

Understanding Maturity Models as Assessment Frameworks

Maturity models are structured frameworks used to assess the effectiveness, efficiency, and adaptability of an organization’s processes. They provide a systematic methodology for evaluating current capabilities and guiding continuous improvement efforts.

Key characteristics of maturity models include:

  • Assessment and Classification: Maturity models help organizations understand their current process maturity level and identify areas for improvement.
  • Guiding Principles: These models emphasize a process-centric approach focused on continuous improvement, aligning improvements with business goals, standardization, measurement, stakeholder involvement, documentation, training, technology enablement, and governance.
  • Incremental Levels: Maturity models typically define a progression through distinct levels, each building on the capabilities of previous levels.

The Business Process Maturity Model (BPMM)

The Business Process Maturity Model is a structured framework for assessing and improving the maturity of an organization’s business processes. It provides a systematic methodology to evaluate the effectiveness, efficiency, and adaptability of processes within an organization, guiding continuous improvement efforts.

The BPMM typically consists of five incremental levels, each building on the previous one:

Initial Level: Ad-hoc Tool Selection

At this level, tool selection is chaotic and unplanned. Organizations exhibit these characteristics:

  • Tools are selected arbitrarily without connection to frameworks or methodologies
  • Different departments use different tools for similar purposes
  • There’s limited understanding of the relationship between frameworks, methodologies, and tools
  • Documentation is inconsistent and often incomplete
  • The “magpie syndrome” is in full effect, with tools collected based on current trends or personal preferences

Managed Level: Consistent but Localized Selection

At this level, some structure emerges, but it remains limited in scope:

  • Basic processes for tool selection are established but may not fully align with organizational frameworks
  • Some risk assessment is used in tool selection, but not consistently
  • Subject matter experts are involved in selection, but their roles are unclear
  • There’s increased awareness of the need for justification in tool selection
  • Tools may be selected consistently within departments but vary across the organization

Standardized Level: Organization-wide Approach

At this level, a consistent approach to tool selection is implemented across the organization:

  • Tool selection processes are standardized and align with organizational frameworks
  • Risk-based approaches are consistently used to determine tool requirements and priorities
  • Subject matter experts are systematically involved in the selection process
  • The concept of the framework-to-tool path is understood and applied
  • The document pyramid is used to structure implementation
  • Quality management principles guide tool selection criteria

Predictable Level: Data-Driven Tool Selection

At this level, quantitative measures are used to guide and evaluate tool selection:

  • Key Performance Indicators (KPIs) for tool effectiveness are established and regularly monitored
  • Data-driven decision-making is used to continually improve tool selection processes
  • Advanced risk management techniques predict and mitigate potential issues with tool implementation
  • There’s a strong focus on leveraging supplier documentation and expertise to streamline tool selection
  • Engineering procedures for quality activities are formalized and consistently applied
  • Return on investment calculations guide tool selection decisions

Optimizing Level: Continuous Improvement in Selection Process

At the highest level, the organization continuously refines its approach to tool selection:

  • There’s a culture of continuous improvement in tool selection processes
  • Innovation in selection approaches is encouraged while maintaining alignment with frameworks
  • The organization actively contributes to developing industry best practices in tool selection
  • Tool selection activities are seamlessly integrated with other quality management systems
  • Advanced technologies may be leveraged to enhance selection strategies
  • The organization regularly reassesses its frameworks and methodologies, adjusting tool selection accordingly

Applying Maturity Models to Tool Selection Processes

To effectively apply these maturity models to the framework-to-tool path, organizations should:

  1. Assess Current State: Evaluate your current tool selection practices against the maturity model levels. Identify your organization’s position on each dimension.
  2. Identify Gaps: Determine the gap between your current state and desired future state. Prioritize areas for improvement based on strategic objectives and available resources.
  3. Develop Improvement Plan: Create a roadmap for advancing to higher maturity levels. Define specific actions, responsibilities, and timelines.
  4. Implement Changes: Execute the improvement plan, monitoring progress and adjusting as needed.
  5. Reassess Regularly: Periodically reassess maturity levels to track progress and identify new improvement opportunities.

By using maturity models to guide the evolution of their framework-to-tool path, organizations can move systematically from ad-hoc tool selection to a mature, deliberate approach that ensures coherence and effectiveness in their quality systems.

Practical Implementation Strategy

Translating the framework-to-tool path from theory to practice requires a structured implementation strategy. This section outlines a practical approach for organizations at any stage of maturity, from those just beginning their journey to those refining mature systems.

Assessing Current State of Tool Selection Practices

Before implementing changes, organizations must understand their current approach to tool selection. This assessment should examine:

Documentation Structure: Does your organization have a defined document pyramid? Are there clear policies, programs, procedures, work instructions, and records?

Framework Clarity: Have you explicitly defined the frameworks that guide your quality efforts? Are these frameworks documented and understood by key stakeholders?

Selection Processes: How are tools currently selected? Who makes these decisions, and what criteria do they use?

Coherence Evaluation: To what extent do your current tools work together as a coherent system rather than a collection of individual instruments?

Maturity Level: Sssess your organization’s current maturity in tool selection practices.

This assessment provides a baseline from which to measure progress and identify priority areas for improvement. It should involve stakeholders from across the organization to ensure a comprehensive understanding of current practices.

Identifying Framework Gaps and Misalignments

With a clear understanding of current state, the next step is to identify gaps and misalignments in your framework-to-tool path:

Framework Definition Gaps: Are there areas where frameworks are undefined or unclear? Do stakeholders have a shared understanding of guiding principles?

Translation Breaks: Are frameworks effectively translated into methodologies through program-level documents? Is there a clear connection between high-level principles and operational approaches?

Procedure Inconsistencies: Do procedures align with defined methodologies? Do they provide clear guidance on who, what, and when without overspecifying how?

Tool-Framework Misalignments: Do current tools align with and support organizational frameworks? Are there tools that contradict or undermine framework principles?

Document Hierarchy Gaps: Are there missing or inconsistent elements in your document pyramid? Are connections between levels clearly established?

These gaps and misalignments highlight areas where the framework-to-tool path needs strengthening. They become the focus of your implementation strategy.

Documenting the Selection Process Through the Document Pyramid

With gaps identified, the next step is to document a structured approach to tool selection using the document pyramid:

Policy Level: Develop policy documents that clearly articulate your chosen frameworks and their guiding principles. These documents should establish the “what” of your quality system without specifying the “how”.

Program Level: Create program documents that translate frameworks into methodologies. These documents should serve as connective tissue, showing how frameworks are implemented through systematic approaches.

Procedure Level: Establish procedures for tool selection that define roles, responsibilities, and process flow. These procedures should outline who is involved in selection decisions, what criteria they use, and when these decisions occur.

Work Instruction Level: Develop detailed work instructions for tool evaluation and implementation. These should provide step-by-step guidance for assessing tools against selection criteria and implementing them effectively.

Records Level: Define the records to be maintained throughout the tool selection process. These provide evidence that the process is being followed and create a knowledge base for future decisions.

This documentation creates a structured framework-to-tool path that guides all future tool selection decisions.

Creating Tool Selection Criteria Based on Framework Principles

With the process documented, the next step is to develop specific criteria for evaluating potential tools:

Framework Alignment: How well does the tool embody and support your chosen frameworks? Does it contradict any framework principles?

Methodological Fit: Is the tool appropriate for your defined methodologies? Does it support the systematic approaches outlined in your program documents?

Systems Principles Application: How does the tool perform against the eight principles of good systems (Balance, Congruence, Convenience, Coordination, Elegance, Human-Centered, Learning, Sustainability)?

Integration Capability: How well does the tool integrate with existing systems and other tools? Does it contribute to system coherence or create silos?

User Experience: Is the tool accessible and valuable to its intended users? Does it enhance rather than complicate their work?

Value Proposition: Does the tool provide value that justifies its cost and complexity? What specific benefits does it deliver, and how do these align with organizational objectives?

These criteria should be documented in your procedures and work instructions, providing a consistent framework for evaluating all potential tools.

Implementing Review Processes for Tool Efficacy

Once tools are selected and implemented, ongoing review ensures they continue to deliver value and remain aligned with frameworks:

Regular Assessments: Establish a schedule for reviewing existing tools against framework principles and selection criteria. This might occur annually or when significant changes in context occur.

Performance Metrics: Define and track metrics that measure each tool’s effectiveness and contribution to system objectives. These metrics should align with the specific value proposition identified during selection.

User Feedback Mechanisms: Create channels for users to provide feedback on tool effectiveness and usability. This feedback is invaluable for identifying improvement opportunities.

Improvement Planning: Develop processes for addressing identified issues, whether through tool modifications, additional training, or tool replacement.

These review processes ensure that the framework-to-tool path remains effective over time, adapting to changing needs and contexts.

Tracking Maturity Development Using Appropriate Models

Finally, organizations should track their progress in implementing the framework-to-tool path using maturity models:

Maturity Assessment: Regularly assess your organization’s maturity using the BPMM, PEMM, or similar models. Document current levels across all dimensions.

Gap Analysis: Identify gaps between current and desired maturity levels. Prioritize these gaps based on strategic importance and feasibility.

Improvement Roadmap: Develop a roadmap for advancing to higher maturity levels. This roadmap should include specific initiatives, timelines, and responsibilities.

Progress Tracking: Monitor implementation of the roadmap, tracking progress toward higher maturity levels. Adjust strategies as needed based on results and changing circumstances.

By systematically tracking maturity development, organizations can ensure continuous improvement in their framework-to-tool path, gradually moving from ad-hoc selection to a fully optimized approach.

This practical implementation strategy provides a structured approach to establishing and refining the framework-to-tool path. By following these steps, organizations at any maturity level can improve the coherence and effectiveness of their tool selection processes.

Common Pitfalls and How to Avoid Them

While implementing the framework-to-tool path, organizations often encounter several common pitfalls that can undermine their efforts. Understanding these challenges and how to address them is essential for successful implementation.

The Technology-First Trap

Pitfall: One of the most common errors is selecting tools based on technological appeal rather than alignment with frameworks and methodologies. This “technology-first” approach is the essence of the magpie syndrome, where organizations are attracted to shiny new tools without considering their fit within the broader system.

Signs you’ve fallen into this trap:

  • Tools are selected primarily based on features and capabilities
  • Framework and methodology considerations come after tool selection
  • Selection decisions are driven by technical teams without broader input
  • New tools are implemented because they’re trendy, not because they address specific needs

How to avoid it:

  • Always start with frameworks and methodologies, not tools
  • Establish clear selection criteria based on framework principles
  • Involve diverse stakeholders in selection decisions, not just technical experts
  • Require explicit alignment with frameworks for all tool selections
  • Use the five key questions of system design to evaluate any new technology

Ignoring the Human Element in Tool Selection

Pitfall: Tools are ultimately used by people, yet many organizations neglect the human element in selection decisions. Tools that are technically powerful but difficult to use or that undermine human capabilities often fail to deliver expected benefits.

Signs you’ve fallen into this trap:

  • User experience is considered secondary to technical capabilities
  • Training and change management are afterthoughts
  • Tools require extensive workarounds in practice
  • Users develop “shadow systems” to circumvent official tools
  • High resistance to adoption despite technical superiority

How to avoid it:

  • Include users in the selection process from the beginning
  • Evaluate tools against the “Human” principle of good systems
  • Consider the full user journey, not just isolated tasks
  • Prioritize adoption and usability alongside technical capabilities
  • Be empathetic with users, understanding their situation and feelings
  • Implement appropriate training and support mechanisms
  • Balance standardization with flexibility to accommodate user needs

Inconsistency Between Framework and Tools

Pitfall: Even when organizations start with frameworks, they often select tools that contradict framework principles or undermine methodological approaches. This inconsistency creates confusion and reduces effectiveness.

Signs you’ve fallen into this trap:

  • Tools enforce processes that conflict with stated methodologies
  • Multiple tools implement different approaches to the same task
  • Framework principles are not reflected in daily operations
  • Disconnection between policy statements and operational reality
  • Confusion among staff about “the right way” to approach tasks

How to avoid it:

  • Explicitly map tool capabilities to framework principles during selection
  • Use the program level of the document pyramid to ensure proper translation from frameworks to tools
  • Create clear traceability from frameworks to methodologies to tools
  • Regularly audit tools for alignment with frameworks
  • Address inconsistencies promptly through reconfiguration, replacement, or reconciliation
  • Ensure selection criteria prioritize framework alignment

Misalignment Between Different System Levels

Pitfall: Without proper coordination, different levels of the quality system can become misaligned. Policies may say one thing, procedures another, and tools may enforce yet a third approach.

Signs you’ve fallen into this trap:

  • Procedures don’t reflect policy requirements
  • Tools enforce processes different from documented procedures
  • Records don’t provide evidence of policy compliance
  • Different departments interpret frameworks differently
  • Audit findings frequently identify inconsistencies between levels

How to avoid it:

  • Use the enhanced document pyramid to create clear connections between levels
  • Ensure each level properly translates requirements from the level above
  • Review all system levels together when making changes
  • Establish governance mechanisms that ensure alignment
  • Create visual mappings that show relationships between levels
  • Implement regular cross-level reviews
  • Use the “Congruence” and “Coordination” principles to evaluate alignment

Lack of Documentation and Institutional Memory

Pitfall: Many organizations fail to document their framework-to-tool path adequately, leading to loss of institutional memory when key personnel leave. Without documentation, decisions seem arbitrary and inconsistent over time.

Signs you’ve fallen into this trap:

  • Selection decisions are not documented with clear rationales
  • Framework principles exist but are not formally recorded
  • Tool implementations vary based on who led the project
  • Tribal knowledge dominates over documented processes
  • New staff struggle to understand the logic behind existing systems

How to avoid it:

  • Document all elements of the framework-to-tool path in the document pyramid
  • Record selection decisions with explicit rationales
  • Create and maintain framework and methodology documentation
  • Establish knowledge management practices for preserving insights
  • Use the “Learning” principle to build reflection and documentation into processes
  • Implement succession planning for key roles
  • Create orientation materials that explain frameworks and their relationship to tools

Failure to Adapt: The Static System Problem

Pitfall: Some organizations successfully implement a framework-to-tool path but then treat it as static, failing to adapt to changing contexts and requirements. This rigidity eventually leads to irrelevance and bypassing of formal systems.

Signs you’ve fallen into this trap:

  • Frameworks haven’t been revisited in years despite changing context
  • Tools are maintained long after they’ve become obsolete
  • Increasing use of “exceptions” and workarounds
  • Growing gap between formal processes and actual work
  • Resistance to new approaches because “that’s not how we do things”

How to avoid it:

  • Schedule regular reviews of frameworks and methodologies
  • Use the “Learning” and “Sustainability” principles to build adaptation into systems2
  • Establish processes for evaluating and incorporating new approaches
  • Monitor external developments in frameworks, methodologies, and tools
  • Create feedback mechanisms that capture changing needs
  • Develop change management capabilities for system evolution
  • Use maturity models to guide continuous improvement

By recognizing and addressing these common pitfalls, organizations can increase the effectiveness of their framework-to-tool path implementation. The key is maintaining vigilance against these tendencies and establishing practices that reinforce the principles of good system design.

Case Studies: Success Through Deliberate Selection

To illustrate the practical application of the framework-to-tool path, let’s examine three case studies from different industries. These examples demonstrate how organizations have successfully implemented deliberate tool selection guided by frameworks, with measurable benefits to their quality systems.

Case Study 1: Pharmaceutical Manufacturing Quality System Redesign

Organization: A mid-sized pharmaceutical manufacturer facing increasing regulatory scrutiny and operational inefficiencies.

Initial Situation: The company had accumulated dozens of quality tools over the years, with minimal coordination between them. Documentation was extensive but inconsistent, and staff complained about “check-box compliance” that added little value. Different departments used different approaches to similar problems, and there was no clear alignment between high-level quality objectives and daily operations.

Framework-to-Tool Path Implementation:

  1. Framework Selection: The organization adopted a dual framework approach combining ICH Q10 (Pharmaceutical Quality System) with Systems Thinking principles. These frameworks were documented in updated quality policies that emphasized a holistic approach to quality.
  2. Methodology Translation: At the program level, they developed a Quality System Master Plan that translated these frameworks into specific methodologies, including risk-based decision-making, knowledge management, and continuous improvement. This document served as connective tissue between frameworks and operational procedures.
  3. Procedure Development: Procedures were redesigned to align with the selected methodologies, clearly defining roles, responsibilities, and processes. These procedures emphasized what needed to be done and by whom without overspecifying how tasks should be performed.
  4. Tool Selection: Tools were evaluated against criteria derived from the frameworks and methodologies. This evaluation led to the elimination of redundant tools, reconfiguration of others, and the addition of new tools where gaps existed. Each tool was documented in work instructions that connected it to higher-level requirements.
  5. Maturity Tracking: The organization used PEMM to assess their initial maturity and track progress over time, developing a roadmap for advancing from P-2 (basic standardization) to P-4 (optimization).

Results: Two years after implementation, the organization achieved:

  • 30% decrease in deviation investigations through improved root cause analysis
  • Successful regulatory inspections with zero findings
  • Improved staff engagement in quality activities
  • Advancement from P-2 to P-3 on the PEMM maturity scale

Key Lessons:

  • The program-level documentation was crucial for translating frameworks into operational practices
  • The deliberate evaluation of tools against framework principles eliminated many inefficiencies
  • Maturity modeling provided a structured approach to continuous improvement
  • Executive sponsorship and cross-functional involvement were essential for success

Case Study 2: Medical Device Design Transfer Process

Organization: A growing medical device company struggling with inconsistent design transfer from R&D to manufacturing.

Initial Situation: The design transfer process involved multiple departments using different tools and approaches, resulting in delays, quality issues, and frequent rework. Teams had independently selected tools based on familiarity rather than appropriateness, creating communication barriers and inconsistent outputs.

Framework-to-Tool Path Implementation:

  1. Framework Selection: The organization adopted the Quality by Design (QbD) framework integrated with Design Controls requirements from 21 CFR 820.30. These frameworks were documented in a new Design Transfer Policy that established principles for knowledge-based transfer.
  2. Methodology Translation: A Design Transfer Program document was created to translate these frameworks into methodologies, specifically Stage-Gate processes, Risk-Based Design Transfer, and Knowledge Management methodologies. This document mapped how different approaches would work together across the product lifecycle.
  3. Procedure Development: Cross-functional procedures defined responsibilities across departments and established standardized transfer points with clear entrance and exit criteria. These procedures created alignment without dictating specific technical approaches.
  4. Tool Selection: Tools were evaluated against framework principles and methodological requirements. This led to standardization on a core set of tools, including Design Failure Mode Effects Analysis (DFMEA), Process Failure Mode Effects Analysis (PFMEA), Design of Experiments (DoE), and Statistical Process Control (SPC). Each tool was documented with clear connections to higher-level requirements.
  5. Maturity Tracking: The organization used BPMM to assess and track their maturity in the design transfer process, initially identifying themselves at Level 2 (Managed) with a goal of reaching Level 4 (Predictable).

Results: 18 months after implementation, the organization achieved:

  • 50% reduction in design transfer cycle time
  • 60% reduction in manufacturing defects related to design transfer issues
  • Improved first-time-right performance in initial production runs
  • Better cross-functional collaboration and communication
  • Advancement from Level 2 to Level 3+ on the BPMM scale

Key Lessons:

  • The QbD framework provided a powerful foundation for selecting appropriate tools
  • Standardizing on a core toolset improved cross-functional communication
  • The program document was essential for creating a coherent approach
  • Regular maturity assessments helped maintain momentum for improvement

Lessons Learned from Successful Implementations

Across these diverse case studies, several common factors emerge as critical for successful implementation of the framework-to-tool path:

  1. Executive Sponsorship: In all cases, senior leadership commitment was essential for establishing frameworks and providing resources for implementation.
  2. Cross-Functional Involvement: Successful implementations involved stakeholders from multiple departments to ensure comprehensive perspective and buy-in.
  3. Program-Level Documentation: The program level of the document pyramid consistently proved crucial for translating frameworks into operational approaches.
  4. Deliberate Tool Evaluation: Taking the time to systematically evaluate tools against framework principles and methodological requirements led to more coherent and effective toolsets.
  5. Maturity Modeling: Using maturity models to assess current state, set targets, and track progress provided structure and momentum for continuous improvement.
  6. Balanced Standardization: Successful implementations balanced the need for standardization with appropriate flexibility for different contexts.
  7. Clear Documentation: Comprehensive documentation of the framework-to-tool path created transparency and institutional memory.
  8. Continuous Assessment: Regular evaluation of tool effectiveness against framework principles ensured ongoing alignment and adaptation.

These lessons provide valuable guidance for organizations embarking on their own journey from frameworks to tools. By following these principles and adapting them to their specific context, organizations can achieve similar benefits in quality, efficiency, and effectiveness.

Summary of Key Principles

Several fundamental principles emerge as essential for establishing an effective framework-to-tool path:

  1. Start with Frameworks: Begin with the conceptual foundations that provide structure and guidance for your quality system. Frameworks establish the “what” and “why” before addressing the “how”.
  2. Use the Document Pyramid: The enhanced document pyramid – with policies, programs, procedures, work instructions, and records – provides a coherent structure for implementing your framework-to-tool path.
  3. Apply Systems Thinking: The eight principles of good systems (Balance, Congruence, Convenience, Coordination, Elegance, Human-Centered, Learning, Sustainability) serve as evaluation criteria throughout the journey.
  4. Build Coherence: True coherence goes beyond alignment, creating systems that build order through their function rather than through rigid control.
  5. Think Before Implementing: Understand system purpose, structure, behavior, and context – rather than simply implementing technology.
  6. Follow a Structured Approach: The five-step approach (Framework Selection → Methodology Translation → Document Pyramid Implementation → Tool Selection Criteria → Tool Evaluation) provides a systematic path from concepts to implementation.
  7. Track Maturity: Maturity models help assess current state and guide continuous improvement in your framework-to-tool path.

These principles provide a foundation for transforming tool selection from a haphazard collection of shiny objects to a deliberate implementation of coherent strategy.

The Value of Deliberate Selection in Professional Practice

The deliberate selection of tools based on frameworks offers numerous benefits over the “magpie” approach:

Coherence: Tools work together as an integrated system rather than a collection of disconnected parts.

Effectiveness: Tools directly support strategic objectives and methodological approaches.

Efficiency: Redundancies are eliminated, and resources are focused on tools that provide the greatest value.

Sustainability: The system adapts and evolves while maintaining its essential character and purpose.

Engagement: Staff understand the “why” behind tools, increasing buy-in and proper utilization.

Learning: The system incorporates feedback and continuously improves based on experience.

These benefits translate into tangible outcomes: better quality, lower costs, improved regulatory compliance, enhanced customer satisfaction, and increased organizational capability.

Next Steps for Implementing in Your Organization

If you’re ready to implement the framework-to-tool path in your organization, consider these practical next steps:

  1. Assess Current State: Evaluate your current approach to tool selection using the maturity models described earlier. Identify your organization’s maturity level and key areas for improvement.
  2. Document Existing Frameworks: Identify and document the frameworks that currently guide your quality efforts, whether explicit or implicit. These form the foundation for your path.
  3. Enhance Your Document Pyramid: Review your documentation structure to ensure it includes all necessary levels, particularly the crucial program level that connects frameworks to operational practices.
  4. Develop Selection Criteria: Based on your frameworks and the principles of good systems, create explicit criteria for tool selection and document these criteria in your procedures.
  5. Evaluate Current Tools: Assess your existing toolset against these criteria, identifying gaps, redundancies, and misalignments. Based on this evaluation, develop an improvement plan.
  6. Create a Maturity Roadmap: Develop a roadmap for advancing your organization’s maturity in tool selection. Define specific initiatives, timelines, and responsibilities.
  7. Implement and Monitor: Execute your improvement plan, tracking progress against your maturity roadmap. Adjust strategies based on results and changing circumstances.

These steps will help you establish a deliberate path from frameworks to tools that enhances the coherence and effectiveness of your quality system.

The journey from frameworks to tools represents a fundamental shift from the “magpie syndrome” of haphazard tool collection to a deliberate approach that creates coherent, effective quality systems. Organizations can transform their tool selection processes by following the principles and techniques outlined here and significantly improve quality, efficiency, and effectiveness. The document pyramid provides the structure, maturity models track the progress, and systems thinking principles guide the journey. The result is better tool selection and a truly integrated quality system that delivers sustainable value.

Methodologies, Frameworks, and Tools in Systems Thinking and Quality by Design

We often encounter three fundamental concepts in quality management: methodologies, frameworks, and tools. Despite their critical importance in shaping how we approach challenges, these terms are frequently unclear. It is pretty easy to confuse these concepts, using them interchangeably or misapplying them in practice.

This confusion is not merely a matter of semantics. Misunderstandings or misapplications of methodologies, frameworks, and tools can lead to ineffective problem-solving, misaligned strategies, and suboptimal outcomes. When we fail to distinguish between a methodology’s structured approach, a framework’s flexible guidance, and a tool’s specific function, we risk applying the wrong solution to our challenges or missing out on creative opportunities from their proper use.

In this blog post, I will provide clear definitions, illustrate their interrelationships, and demonstrate their real-world application. By doing so, we will clarify these often-confused terms and show how their proper understanding and application can significantly enhance our approach to quality management and other critical business processes.

Framework: The Conceptual Scaffolding

A framework is a flexible structure that organizes concepts, principles, and practices to guide decision-making. Unlike methodologies, frameworks are not rigidly sequential; they provide a mental model or lens through which problems can be analyzed. Frameworks emphasize what needs to be addressed rather than how to address it.

For example:

  • Systems Thinking Frameworks conceptualize problems as interconnected components (e.g., inputs, processes, outputs).
  • QbD Frameworks outline elements like Quality Target Product Profiles (QTPP) and Critical Process Parameters (CPPs) to embed quality into product design.

Frameworks enable adaptability, allowing practitioners to tailor approaches to specific contexts while maintaining alignment with overarching goals.

Methodology: The Structured Pathway

A methodology is a systematic, step-by-step approach to solving problems or achieving objectives. It provides a structured sequence of actions, often grounded in theoretical principles, and defines how tasks should be executed. Methodologies are prescriptive, offering clear guidelines to ensure consistency and repeatability.

For example:

  • Six Sigma follows the DMAIC (Define, Measure, Analyze, Improve, Control) methodology to reduce process variation.
  • 8D (Eight Disciplines) is a problem-solving methodology with steps like containment, root cause analysis, and preventive action.

Methodologies act as “recipes” that standardize processes across teams, making them ideal for regulated industries (e.g., pharmaceuticals) where auditability and compliance are critical.

Tool: The Tactical Instrument

A tool is a specific technique, model, or instrument used to execute tasks within a methodology or framework. Tools are action-oriented and often designed for a singular purpose, such as data collection, analysis, or visualization.

For example:

  • Root Cause Analysis Tools: Fishbone diagrams, Why-Why, and Pareto charts.
  • Process Validation Tools: Statistical Process Control (SPC) charts, Failure Mode Effects Analysis (FMEA).

Tools are the “nuts and bolts” that operationalize methodologies and frameworks, converting theory into actionable insights.

How They Interrelate: Building a Cohesive Strategy

Methodologies, frameworks, and tools are interdependent. A framework provides the conceptual structure for understanding a problem, the methodology defines the execution plan, and tools enable practical implementation.

Example in Systems Thinking:

  1. Framework: Systems theory identifies inputs, processes, outputs, and feedback loops.
  2. Methodology: A 5-phase approach (problem structuring, dynamic modeling, scenario planning) guides analysis.
  3. Tools: Causal loop diagrams map relationships; simulation software models system behavior.

In QbD:

  1. Framework: The ICH Q8 guideline outlines quality objectives.
  2. Methodology: Define QTPP → Identify Critical Quality Attributes → Design experiments.
  3. Tools: Design of Experiments (DoE) optimizes process parameters.

In Commissioning, Qualification, and Validation (CQV)

  1. Framework: Regulatory guidelines (e.g., FDA’s Process Validation Lifecycle) define stages (Commissioning → Qualification → Validation).
  2. Methodology:
    • Commissioning: Factory Acceptance Testing (FAT) ensures equipment meets design specs.
    • Qualification: Installation/Operational/Performance Qualification (IQ/OQ/PQ) methodologies verify functionality.
    • Validation: Ongoing process verification ensures consistent quality.
  3. Tools: Checklists (IQ), stress testing (OQ), and Process Analytical Technology (PAT) for real-time monitoring.

Without frameworks, methodologies lack context; without tools, methodologies remain theoretical.

Quality Management in the Model

Quality management is not inherently a framework, but rather an overarching concept that can be implemented through various frameworks, methodologies, and tools.

Quality management encompasses a broad range of activities aimed at ensuring products, services, and processes meet consistent quality standards. It can be implemented using different approaches:

  1. Quality Management Frameworks: These provide structured systems for managing quality, such as:
    • ISO 9001: A set of guidelines for quality management systems
    • Total Quality Management (TQM): An integrative system focusing on customer satisfaction and continuous improvement
    • Pharmaceutical Quality System: As defined by ICH Q10 and other regulations and guidance
  2. Quality Management Methodologies: These offer systematic approaches to quality management, including:
    • Six Sigma: A data-driven methodology for eliminating defects
    • Lean: A methodology focused on minimizing waste while maximizing customer value
  3. Quality Management Tools: There are too many tools to count (okay I have a few books on my shelf that try) but tools are usually built to meet the core elements that make up quality management practices:
    • Quality Planning
    • Quality Assurance
    • Quality Control
    • Quality Improvement

In essence, quality management is a comprehensive approach that can be structured and implemented using various frameworks, but it is not itself a framework.

Root Cause Analysis (RCA): Framework or Methodology?

Root cause analysis (RCA) functions as both a framework and a methodology, depending on its application and implementation.

Root Cause Analysis as a Framework

RCA serves as a framework when it provides a conceptual structure for organizing causal analysis without prescribing rigid steps. It offers:

  • Guiding principles: Focus on systemic causes over symptoms, emphasis on evidence-based analysis.
  • Flexible structure: Adaptable to diverse industries (e.g., healthcare, manufacturing) and problem types.
  • Tool integration: Accommodates methods like 5 Whys, Fishbone diagrams, and Fault Tree Analysis.

Root Cause Analysis as a Methodology

RCA becomes a methodology when applied as a systematic process with defined steps:

  1. Problem definition: Quantify symptoms and impacts.
  2. Data collection: Gather evidence through interviews, logs, or process maps.
  3. Causal analysis: Use tools like 5 Whys or Fishbone diagrams to trace root causes.
  4. Solution implementation: Design corrective actions targeting systemic gaps.
ApproachClassificationKey Characteristics
Six SigmaMethodology (DMAIC/DMADV)Structured phases (Define, Measure, Analyze, Improve, Control) for defect reduction.
8DMethodologyEight disciplines for containment, root cause analysis, and preventive action.
RCA ToolsTools (e.g., 5 Whys, Fishbone)Tactical instruments used within methodologies.
  • RCA is a framework when providing a scaffold for causal analysis (e.g., categorizing causes into human/process/systemic factors).
  • RCA becomes a methodology when systematized into phases (e.g., 5 Whys) or integrated into broader methodologies like Six Sigma.
  • Six Sigma and 8D are methodologies, not frameworks, due to their prescriptive, phase-based structures.

This duality allows RCA to adapt to contexts ranging from incident reviews to engineering failure analysis, making it a versatile approach for systemic problem-solving.

Synergy for Systemic Excellence

Methodologies provide the roadmap, frameworks offer the map, and tools equip the journey. In systems thinking and QbD, their integration ensures holistic problem-solving—whether optimizing manufacturing validation (CQV) or eliminating defects (Six Sigma). By anchoring these elements in process thinking, organizations transform isolated actions into coherent, quality-driven systems. Clarity on these distinctions isn’t academic; it’s the foundation of sustainable excellence.

AspectFrameworkMethodology
StructureFlexible, conceptualRigid, step-by-step
ApplicationGuides analysisPrescribes execution

Understanding the Differences Between Group, Family, and Bracket Approaches in CQV Activities

Strategic approaches like grouping, family classification, and bracketing are invaluable tools in the validation professional’s toolkit. While these terms are sometimes used interchangeably, they represent distinct strategies with specific applications and regulatory considerations.

Grouping, Family and Bracket

Equipment Grouping – The Broader Approach

Equipment grouping (sometimes called matrixing) represents a broad risk-based approach where multiple equipment items are considered equivalent for validation purposes. This strategy allows companies to optimize validation efforts by categorizing equipment based on design, functionality, and risk profiles. The key principle behind grouping is that equipment with similar characteristics can be validated using a common approach, reducing redundancy in testing and documentation.

Example – Manufacturing

Equipment grouping might apply to multiple buffer preparation tanks that share fundamental design characteristics but differ in volume or specific features. For example, a facility might have six 500L buffer preparation tanks from the same manufacturer, used for various buffer preparations throughout the purification process. These tanks might have identical mixing technologies, materials of construction, and cleaning processes.

Under a grouping approach, the manufacturer could develop one validation plan covering all six tanks. This plan would outline the overall validation strategy, including the rationale for grouping, the specific tests to be performed, and how results will be evaluated across the group. The plan might specify that while all tanks will undergo full Installation Qualification (IQ) to verify proper installation and utility connections, certain Operational Qualification (OQ) and Performance Qualification (PQ) tests can be consolidated.

The mixing efficiency test might be performed on only two tanks (e.g., the first and last installed), with results extrapolated to the entire group. However, critical parameters like temperature control accuracy would still be tested individually for each tank. The grouping approach would also allow for the application of the same cleaning validation protocol across all tanks, with appropriate justification. This might involve developing a worst-case scenario for cleaning validation based on the most challenging buffer compositions and applying the results across all tanks in the group.

Examples – QC

In the QC laboratory setting, equipment grouping might involve multiple identical analytical instruments such as HPLCs used for release testing. For instance, five HPLC systems of the same model, configured with identical detectors and software versions, might be grouped for qualification purposes.

The QC group could justify standardized qualification protocols across all five systems. This would involve developing a comprehensive protocol that covers all aspects of HPLC qualification but allows for efficient execution across the group. For example, software validation might be performed once and applied to all systems, given that they use identical software versions and configurations.

Consolidated performance testing could be implemented where appropriate. This might involve running system suitability tests on a representative sample of HPLCs rather than exhaustively on each system. However, critical performance parameters like detector linearity would still be verified individually for each HPLC to ensure consistency across the group.

Uniform maintenance and calibration schedules could be established for the entire group, simplifying ongoing management and reducing the risk of overlooking maintenance tasks for individual units. This approach ensures consistent performance across all grouped HPLCs while optimizing resource utilization.

Equipment grouping provides broad flexibility but requires careful consideration of which validation elements truly can be shared versus those that must remain equipment-specific. The key to successful grouping lies in thorough risk assessment and scientific justification for any shared validation elements.

Family Approach: Categorizing Based on Common Characteristics

The family approach represents a more structured categorization methodology where equipment is grouped based on specific common characteristics including identical risk classification, common intended purpose, and shared design and manufacturing processes. Family grouping typically applies to equipment from the same manufacturer with minor permissible variations. This approach recognizes that while equipment within a family may not be identical, their core functionalities and critical quality attributes are sufficiently similar to justify a common validation approach with specific considerations for individual variations.

Example – Manufacturing

A family approach might apply to chromatography skids designed for different purification steps but sharing the same basic architecture. For example, three chromatography systems from the same manufacturer might have different column sizes and flow rates but identical control systems, valve technologies, and sensor types.

Under a family approach, base qualification protocols would be identical for all three systems. This core protocol would cover common elements such as control system functionality, alarm systems, and basic operational parameters. Each system would undergo full IQ verification to ensure proper installation, utility connections, and compliance with design specifications. This individual IQ is crucial as it accounts for the specific installation environment and configuration of each unit.

OQ testing would focus on the specific operating parameters for each unit while leveraging a common testing framework. All systems might undergo the same sequence of tests (e.g., flow rate accuracy, pressure control, UV detection linearity), but the acceptance criteria and specific test conditions would be tailored to each system’s operational range. This approach ensures that while the overall qualification strategy is consistent, each system is verified to perform within its specific design parameters.

Shared control system validation could be leveraged across the family. Given that all three systems use identical control software and hardware, a single comprehensive software validation could be performed and applied to all units. This might include validation of user access controls, data integrity features, and critical control algorithms. However, system-specific configuration settings would still need to be verified individually.

Example – QC

In QC testing, a family approach could apply to dissolution testers that serve the same fundamental purpose but have different configurations. For instance, four dissolution testers might have the same underlying technology and control systems but different numbers of vessels or sampling configurations.

The qualification strategy could include common template protocols with configuration-specific appendices. This approach allows for a standardized core qualification process while accommodating the unique features of each unit. The core protocol might cover elements common to all units, such as temperature control accuracy, stirring speed precision, and basic software functionality.

Full mechanical verification would be performed for each unit to account for the specific configuration of vessels and sampling systems. This ensures that despite being part of the same family, each unit’s unique physical setup is thoroughly qualified.

A shared software validation approach could be implemented, focusing on the common control software used across all units. This might involve validating core software functions, data processing algorithms, and report generation features. However, configuration-specific software settings and any unique features would require individual verification.

Configuration-specific performance testing would be conducted to address the unique aspects of each unit. For example, a dissolution tester with automated sampling would undergo additional qualification of its sampling system, while units with different numbers of vessels might require specific testing to ensure uniform performance across all vessels.

The family approach provides a middle ground, recognizing fundamental similarities while still acknowledging equipment-specific variations that must be qualified independently. This strategy is particularly useful in biologics manufacturing and QC, where equipment often shares core technologies but may have variations to accommodate different product types or analytical methods.

Bracketing Approach: Strategic Testing Reduction

Bracketing represents the most targeted approach, involving the selective testing of representative examples from a group of identical equipment to reduce the overall validation burden. This approach requires rigorous scientific justification and risk assessment to demonstrate that the selected “brackets” truly represent the performance of all units. Bracketing is based on the principle that if the extreme cases (brackets) meet acceptance criteria, units falling within these extremes can be assumed to comply as well.

Example – Manufacturing

Bracketing might apply to multiple identical bioreactors. For example, a facility might have six 2000L single-use bioreactors of identical design, from the same manufacturing lot, installed in similar environments, and operated by the same control system.

Under a bracketing approach, all bioreactors would undergo basic installation verification to ensure proper setup and connection to utilities. This step is crucial to confirm that each unit is correctly installed and ready for operation, regardless of its inclusion in comprehensive testing.

Only two bioreactors (typically the minimum and maximum in the installation sequence) might undergo comprehensive OQ testing. This could include detailed evaluation of temperature control systems, agitation performance, gas flow accuracy, and pH/DO sensor functionality. The justification for this approach would be based on the identical design and manufacturing of the units, with the assumption that any variation due to manufacturing or installation would be most likely to manifest in the first or last installed unit.

Temperature mapping might be performed on only two units with justification that these represent “worst-case” positions. For instance, the units closest to and farthest from the HVAC outlets might be selected for comprehensive temperature mapping studies. These studies would involve placing multiple temperature probes throughout the bioreactor vessel and running temperature cycles to verify uniform temperature distribution and control.

Process performance qualification might be performed on a subset of reactors. This could involve running actual production processes (or close simulations) on perhaps three of the six reactors – for example, the first installed, the middle unit, and the last installed. These runs would evaluate critical process parameters and quality attributes to demonstrate consistent performance across the bracketed group.

Example – QC

Bracketing might apply to a set of identical incubators used for microbial testing. For example, eight identical incubators might be installed in the same laboratory environment.

The bracketing strategy could include full IQ documentation for all units to ensure proper installation and basic functionality. This step verifies that each incubator is correctly set up, connected to appropriate utilities, and passes basic operational checks.

Comprehensive temperature mapping would be performed for only the first and last installed units. This intensive study would involve placing calibrated temperature probes throughout the incubator chamber and running various temperature cycles to verify uniform heat distribution and precise temperature control. The selection of the first and last units is based on the assumption that any variations due to manufacturing or installation would be most likely to appear in these extreme cases.

Challenge testing on a subset representing different locations in the laboratory might be conducted. This could involve selecting incubators from different areas of the lab (e.g., near windows, doors, or HVAC vents) for more rigorous performance testing. These tests might include recovery time studies after door openings, evaluation of temperature stability under various load conditions, and assessment of humidity control (if applicable).

Ongoing monitoring that continuously verifies the validity of the bracketing approach would be implemented. This might involve rotating additional performance tests among all units over time or implementing a program of periodic reassessment to confirm that the bracketed approach remains valid. For instance, annual temperature distribution studies might be rotated among all incubators, with any significant deviations triggering a reevaluation of the bracketing strategy.

Key Differences and Selection Criteria

The primary differences between these approaches can be summarized in several key areas:

Scope and Application

Grouping is the broadest approach, applicable to equipment with similar functionality but potential design variations. This strategy is most useful when dealing with a wide range of equipment that serves similar purposes but may have different manufacturers or specific features. For example, in a large biologics facility, grouping might be applied to various types of pumps used throughout the manufacturing process. While these pumps may have different flow rates or pressure capabilities, they could be grouped based on their common function of fluid transfer and similar cleaning requirements.

The Family approach is an intermediate strategy, applicable to equipment with common design principles and minor variations. This is particularly useful for equipment from the same manufacturer or product line, where core technologies are shared but specific configurations may differ. In a QC laboratory, a family approach might be applied to a range of spectrophotometers from the same manufacturer. These instruments might share the same fundamental optical design and software platform but differ in features like sample capacity or specific wavelength ranges.

Bracketing is the most focused approach, applicable only to identical equipment with strong scientific justification. This strategy is best suited for situations where multiple units of the exact same equipment model are installed under similar conditions. For example, in a fill-finish operation, bracketing might be applied to a set of identical lyophilizers installed in the same clean room environment.

Testing Requirements

In a Grouping approach, each piece typically requires individual testing, but with standardized protocols. This means that while the overall validation strategy is consistent across the group, specific tests are still performed on each unit to account for potential variations. For instance, in a group of buffer preparation tanks, each tank would undergo individual testing for critical parameters like temperature control and mixing efficiency, but using a standardized testing protocol developed for the entire group.

The Family approach involves core testing that is standardized, with variations to address equipment-specific features. This allows for a more efficient validation process where common elements are tested uniformly across the family, while specific features of each unit are addressed separately. In the case of a family of chromatography systems, core functions like pump operation and detector performance might be tested using identical protocols, while specific column compatibility or specialized detection modes would be validated individually for units that possess these features.

Bracketing involves selective testing of representative units with extrapolation to the remaining units. This approach significantly reduces the overall testing burden but requires robust justification. For example, in a set of identical bioreactors, comprehensive performance testing might be conducted on only the first and last installed units, with results extrapolated to the units in between. However, this approach necessitates ongoing monitoring to ensure the continued validity of the extrapolation.

Documentation Needs

Grouping requires individual documentation with cross-referencing to shared elements. Each piece of equipment within the group would have its own validation report, but these reports would reference a common validation master plan and shared testing protocols. This approach ensures that while each unit is individually accounted for, the efficiency gains of the grouping strategy are reflected in the documentation.

The Family approach typically involves standardized core documentation with equipment-specific supplements. This might manifest as a master validation report for the entire family, with appendices or addenda addressing the specific features or configurations of individual units. This structure allows for efficient document management while still providing a complete record for each piece of equipment.

Bracketing necessitates a comprehensive justification document plus detailed documentation for tested units. This approach requires the most rigorous upfront documentation to justify the bracketing strategy, including risk assessments and scientific rationale. The validation reports for the tested “bracket” units would be extremely detailed, as they serve as the basis for qualifying the entire set of equipment.

Risk Assessment

In a Grouping approach, the risk assessment is focused on demonstrating equivalence for specific validation purposes. This involves a detailed analysis of how variations within the group might impact critical quality attributes or process parameters. The risk assessment must justify why certain tests can be standardized across the group and identify any equipment-specific risks that need individual attention.

For the Family approach, risk assessment is centered on evaluating permissible variations within the family. This involves a thorough analysis of how differences in specific features or configurations might impact equipment performance or product quality. The risk assessment must clearly delineate which aspects of validation can be shared across the family and which require individual consideration.

Bracketing requires the most rigorous risk assessment to justify the extrapolation of results from tested units to non-tested units. This involves a comprehensive evaluation of potential sources of variation between units, including manufacturing tolerances, installation conditions, and operational factors. The risk assessment must provide a strong scientific basis

Criteria Group Approach Family Approach Bracket Approach
Scope and Application Broadest approach. Applicable to equipment with similar functionality but potential design variations. Intermediate approach. Applicable to equipment with common design principles and minor variations. Most focused approach. Applicable only to identical equipment with strong scientific justification.
Equipment Similarity Similar functionality, potentially different manufacturers or features. Same manufacturer or product line, core technologies shared, specific configurations may differ. Identical equipment models installed under similar conditions.
Testing Requirements Each piece requires individual testing, but with standardized protocols. Core testing is standardized, with variations to address equipment-specific features. Selective testing of representative units with extrapolation to the remaining units.
Documentation Needs Individual documentation with cross-referencing to shared elements. Standardized core documentation with equipment-specific supplements. Comprehensive justification document plus detailed documentation for tested units.
Risk Assessment Focus Demonstrating equivalence for specific validation purposes. Evaluating permissible variations within the family. Most rigorous assessment to justify extrapolation of results.
Flexibility High flexibility to accommodate various equipment types. Moderate flexibility within a defined family of equipment. Low flexibility, requires high degree of equipment similarity.
Resource Efficiency Moderate efficiency gains through standardized protocols. High efficiency for core validation elements, with specific testing as needed. Highest potential for efficiency, but requires strong justification.
Regulatory Considerations Generally accepted with proper justification. Well-established approach, often preferred for equipment from same manufacturer. Requires most robust scientific rationale and ongoing verification.
Ideal Use Case Large facilities with diverse equipment serving similar functions. Product lines with common core technology but varying features. Multiple identical units in same facility or laboratory.

Beyond Documents: Embracing Data-Centric Thinking

We live in a fascinating inflection point in quality management, caught between traditional document-centric approaches and the emerging imperative for data-centricity needed to fully realize the potential of digital transformation. For several decades, we’ve been in a process that continues to accelerate through a technology transition that will deliver dramatic improvements in operations and quality. This transformation is driven by three interconnected trends: Pharma 4.0, the Rise of AI, and the shift from Documents to Data.

The History and Evolution of Documents in Quality Management

The history of document management can be traced back to the introduction of the file cabinet in the late 1800s, providing a structured way to organize paper records. Quality management systems have even deeper roots, extending back to medieval Europe when craftsman guilds developed strict guidelines for product inspection. These early approaches established the document as the fundamental unit of quality management—a paradigm that persisted through industrialization and into the modern era.

The document landscape took a dramatic turn in the 1980s with the increasing availability of computer technology. The development of servers allowed organizations to store documents electronically in centralized mainframes, marking the beginning of electronic document management systems (eDMS). Meanwhile, scanners enabled conversion of paper documents to digital format, and the rise of personal computers gave businesses the ability to create and store documents directly in digital form.

In traditional quality systems, documents serve as the backbone of quality operations and fall into three primary categories: functional documents (providing instructions), records (providing evidence), and reports (providing specific information). This document trinity has established our fundamental conception of what a quality system is and how it operates—a conception deeply influenced by the physical limitations of paper.

Photo by Andrea Piacquadio on Pexels.com

Breaking the Paper Paradigm: Limitations of Document-Centric Thinking

The Paper-on-Glass Dilemma

The maturation path for quality systems typically progresses mainly from paper execution to paper-on-glass to end-to-end integration and execution. However, most life sciences organizations remain stuck in the paper-on-glass phase of their digital evolution. They still rely on the paper-on-glass data capture method, where digital records are generated that closely resemble the structure and layout of a paper-based workflow. In general, the wider industry is still reluctant to transition away from paper-like records out of process familiarity and uncertainty of regulatory scrutiny.

Paper-on-glass systems present several specific limitations that hamper digital transformation:

  1. Constrained design flexibility: Data capture is limited by the digital record’s design, which often mimics previous paper formats rather than leveraging digital capabilities. A pharmaceutical batch record system that meticulously replicates its paper predecessor inherently limits the system’s ability to analyze data across batches or integrate with other quality processes.
  2. Manual data extraction requirements: When data is trapped in digital documents structured like paper forms, it remains difficult to extract. This means data from paper-on-glass records typically requires manual intervention, substantially reducing data utilization effectiveness.
  3. Elevated error rates: Many paper-on-glass implementations lack sufficient logic and controls to prevent avoidable data capture errors that would be eliminated in truly digital systems. Without data validation rules built into the capture process, quality systems continue to allow errors that must be caught through manual review.
  4. Unnecessary artifacts: These approaches generate records with inflated sizes and unnecessary elements, such as cover pages that serve no functional purpose in a digital environment but persist because they were needed in paper systems.
  5. Cumbersome validation: Content must be fully controlled and managed manually, with none of the advantages gained from data-centric validation approaches.

Broader Digital Transformation Struggles

Pharmaceutical and medical device companies must navigate complex regulatory requirements while implementing new digital systems, leading to stalling initiatives. Regulatory agencies have historically relied on document-based submissions and evidence, reinforcing document-centric mindsets even as technology evolves.

Beyond Paper-on-Glass: What Comes Next?

What comes after paper-on-glass? The natural evolution leads to end-to-end integration and execution systems that transcend document limitations and focus on data as the primary asset. This evolution isn’t merely about eliminating paper—it’s about reconceptualizing how we think about the information that drives quality management.

In fully integrated execution systems, functional documents and records become unified. Instead of having separate systems for managing SOPs and for capturing execution data, these systems bring process definitions and execution together. This approach drives up reliability and drives out error, but requires fundamentally different thinking about how we structure information.

A prime example of moving beyond paper-on-glass can be seen in advanced Manufacturing Execution Systems (MES) for pharmaceutical production. Rather than simply digitizing batch records, modern MES platforms incorporate AI, IIoT, and Pharma 4.0 principles to provide the right data, at the right time, to the right team. These systems deliver meaningful and actionable information, moving from merely connecting devices to optimizing manufacturing and quality processes.

AI-Powered Documentation: Breaking Through with Intelligent Systems

A dramatic example of breaking free from document constraints comes from Novo Nordisk’s use of AI to draft clinical study reports. The company has taken a leap forward in pharmaceutical documentation, putting AI to work where human writers once toiled for weeks. The Danish pharmaceutical company is using Claude, an AI model by Anthropic, to draft clinical study reports—documents that can stretch hundreds of pages.

This represents a fundamental shift in how we think about documents. Rather than having humans arrange data into documents manually, we can now use AI to generate high-quality documents directly from structured data sources. The document becomes an output—a view of the underlying data—rather than the primary artifact of the quality system.

Data Requirements: The Foundation of Modern Quality Systems in Life Sciences

Shifting from document-centric to data-centric thinking requires understanding that documents are merely vessels for data—and it’s the data that delivers value. When we focus on data requirements instead of document types, we unlock new possibilities for quality management in regulated environments.

At its core, any quality process is a way to realize a set of requirements. These requirements come from external sources (regulations, standards) and internal needs (efficiency, business objectives). Meeting these requirements involves integrating people, procedures, principles, and technology. By focusing on the underlying data requirements rather than the documents that traditionally housed them, life sciences organizations can create more flexible, responsive quality systems.

ICH Q9(R1) emphasizes that knowledge is fundamental to effective risk management, stating that “QRM is part of building knowledge and understanding risk scenarios, so that appropriate risk control can be decided upon for use during the commercial manufacturing phase.” We need to recognize the inverse relationship between knowledge and uncertainty in risk assessment. As ICH Q9(R1) notes, uncertainty may be reduced “via effective knowledge management, which enables accumulated and new information (both internal and external) to be used to support risk-based decisions throughout the product lifecycle.”

This approach helps us ensure that our tools take into account that our processes are living and breathing, our tools should take that into account. This is all about moving to a process repository and away from a document mindset.

Documents as Data Views: Transforming Quality System Architecture

When we shift our paradigm to view documents as outputs of data rather than primary artifacts, we fundamentally transform how quality systems operate. This perspective enables a more dynamic, interconnected approach to quality management that transcends the limitations of traditional document-centric systems.

Breaking the Document-Data Paradigm

Traditionally, life sciences organizations have thought of documents as containers that hold data. This subtle but profound perspective has shaped how we design quality systems, leading to siloed applications and fragmented information. When we invert this relationship—seeing data as the foundation and documents as configurable views of that data—we unlock powerful capabilities that better serve the needs of modern life sciences organizations.

The Benefits of Data-First, Document-Second Architecture

When documents become outputs—dynamic views of underlying data—rather than the primary focus of quality systems, several transformative benefits emerge.

First, data becomes reusable across multiple contexts. The same underlying data can generate different documents for different audiences or purposes without duplication or inconsistency. For example, clinical trial data might generate regulatory submission documents, internal analysis reports, and patient communications—all from a single source of truth.

Second, changes to data automatically propagate to all relevant documents. In a document-first system, updating information requires manually changing each affected document, creating opportunities for errors and inconsistencies. In a data-first system, updating the central data repository automatically refreshes all document views, ensuring consistency across the quality ecosystem.

Third, this approach enables more sophisticated analytics and insights. When data exists independently of documents, it can be more easily aggregated, analyzed, and visualized across processes.

In this architecture, quality management systems must be designed with robust data models at their core, with document generation capabilities built on top. This might include:

  1. A unified data layer that captures all quality-related information
  2. Flexible document templates that can be populated with data from this layer
  3. Dynamic relationships between data entities that reflect real-world connections between quality processes
  4. Powerful query capabilities that enable users to create custom views of data based on specific needs

The resulting system treats documents as what they truly are: snapshots of data formatted for human consumption at specific moments in time, rather than the authoritative system of record.

Electronic Quality Management Systems (eQMS): Beyond Paper-on-Glass

Electronic Quality Management Systems have been adopted widely across life sciences, but many implementations fail to realize their full potential due to document-centric thinking. When implementing an eQMS, organizations often attempt to replicate their existing document-based processes in digital form rather than reconceptualizing their approach around data.

Current Limitations of eQMS Implementations

Document-centric eQMS systems treat functional documents as discrete objects, much as they were conceived decades ago. They still think it terms of SOPs being discrete documents. They structure workflows, such as non-conformances, CAPAs, change controls, and design controls, with artificial gaps between these interconnected processes. When a manufacturing non-conformance impacts a design control, which then requires a change control, the connections between these events often remain manual and error-prone.

This approach leads to compartmentalized technology solutions. Organizations believe they can solve quality challenges through single applications: an eQMS will solve problems in quality events, a LIMS for the lab, an MES for manufacturing. These isolated systems may digitize documents but fail to integrate the underlying data.

Data-Centric eQMS Approaches

We are in the process of reimagining eQMS as data platforms rather than document repositories. A data-centric eQMS connects quality events, training records, change controls, and other quality processes through a unified data model. This approach enables more effective risk management, root cause analysis, and continuous improvement.

For instance, when a deviation is recorded in a data-centric system, it automatically connects to relevant product specifications, equipment records, training data, and previous similar events. This comprehensive view enables more effective investigation and corrective action than reviewing isolated documents.

Looking ahead, AI-powered eQMS solutions will increasingly incorporate predictive analytics to identify potential quality issues before they occur. By analyzing patterns in historical quality data, these systems can alert quality teams to emerging risks and recommend preventive actions.

Manufacturing Execution Systems (MES): Breaking Down Production Data Silos

Manufacturing Execution Systems face similar challenges in breaking away from document-centric paradigms. Common MES implementation challenges highlight the limitations of traditional approaches and the potential benefits of data-centric thinking.

MES in the Pharmaceutical Industry

Manufacturing Execution Systems (MES) aggregate a number of the technologies deployed at the MOM level. MES as a technology has been successfully deployed within the pharmaceutical industry and the technology associated with MES has matured positively and is fast becoming a recognized best practice across all life science regulated industries. This is borne out by the fact that green-field manufacturing sites are starting with an MES in place—paperless manufacturing from day one.

The amount of IT applied to an MES project is dependent on business needs. At a minimum, an MES should strive to replace paper batch records with an Electronic Batch Record (EBR). Other functionality that can be applied includes automated material weighing and dispensing, and integration to ERP systems; therefore, helping the optimization of inventory levels and production planning.

Beyond Paper-on-Glass in Manufacturing

In pharmaceutical manufacturing, paper batch records have traditionally documented each step of the production process. Early electronic batch record systems simply digitized these paper forms, creating “paper-on-glass” implementations that failed to leverage the full potential of digital technology.

Advanced Manufacturing Execution Systems are moving beyond this limitation by focusing on data rather than documents. Rather than digitizing batch records, these systems capture manufacturing data directly, using sensors, automated equipment, and operator inputs. This approach enables real-time monitoring, statistical process control, and predictive quality management.

An example of a modern MES solution fully compliant with Pharma 4.0 principles is the Tempo platform developed by Apprentice. It is a complete manufacturing system designed for life sciences companies that leverages cloud technology to provide real-time visibility and control over production processes. The platform combines MES, EBR, LES (Laboratory Execution System), and AR (Augmented Reality) capabilities to create a comprehensive solution that supports complex manufacturing workflows.

Electronic Validation Management Systems (eVMS): Transforming Validation Practices

Validation represents a critical intersection of quality management and compliance in life sciences. The transition from document-centric to data-centric approaches is particularly challenging—and potentially rewarding—in this domain.

Current Validation Challenges

Traditional validation approaches face several limitations that highlight the problems with document-centric thinking:

  1. Integration Issues: Many Digital Validation Tools (DVTs) remain isolated from Enterprise Document Management Systems (eDMS). The eDMS system is typically the first step where vendor engineering data is imported into a client system. However, this data is rarely validated once—typically departments repeat this validation step multiple times, creating unnecessary duplication.
  2. Validation for AI Systems: Traditional validation approaches are inadequate for AI-enabled systems. Traditional validation processes are geared towards demonstrating that products and processes will always achieve expected results. However, in the digital “intellectual” eQMS world, organizations will, at some point, experience the unexpected.
  3. Continuous Compliance: A significant challenge is remaining in compliance continuously during any digital eQMS-initiated change because digital systems can update frequently and quickly. This rapid pace of change conflicts with traditional validation approaches that assume relative stability in systems once validated.

Data-Centric Validation Solutions

Modern electronic Validation Management Systems (eVMS) solutions exemplify the shift toward data-centric validation management. These platforms introduce AI capabilities that provide intelligent insights across validation activities to unlock unprecedented operational efficiency. Their risk-based approach promotes critical thinking, automates assurance activities, and fosters deeper regulatory alignment.

We need to strive to leverage the digitization and automation of pharmaceutical manufacturing to link real-time data with both the quality risk management system and control strategies. This connection enables continuous visibility into whether processes are in a state of control.

The 11 Axes of Quality 4.0

LNS Research has identified 11 key components or “axes” of the Quality 4.0 framework that organizations must understand to successfully implement modern quality management:

  1. Data: In the quality sphere, data has always been vital for improvement. However, most organizations still face lags in data collection, analysis, and decision-making processes. Quality 4.0 focuses on rapid, structured collection of data from various sources to enable informed and agile decision-making.
  2. Analytics: Traditional quality metrics are primarily descriptive. Quality 4.0 enhances these with predictive and prescriptive analytics that can anticipate quality issues before they occur and recommend optimal actions.
  3. Connectivity: Quality 4.0 emphasizes the connection between operating technology (OT) used in manufacturing environments and information technology (IT) systems including ERP, eQMS, and PLM. This connectivity enables real-time feedback loops that enhance quality processes.
  4. Collaboration: Breaking down silos between departments is essential for Quality 4.0. This requires not just technological integration but cultural changes that foster teamwork and shared quality ownership.
  5. App Development: Quality 4.0 leverages modern application development approaches, including cloud platforms, microservices, and low/no-code solutions to rapidly deploy and update quality applications.
  6. Scalability: Modern quality systems must scale efficiently across global operations while maintaining consistency and compliance.
  7. Management Systems: Quality 4.0 integrates with broader management systems to ensure quality is embedded throughout the organization.
  8. Compliance: While traditional quality focused on meeting minimum requirements, Quality 4.0 takes a risk-based approach to compliance that is more proactive and efficient.
  9. Culture: Quality 4.0 requires a cultural shift that embraces digital transformation, continuous improvement, and data-driven decision-making.
  10. Leadership: Executive support and vision are critical for successful Quality 4.0 implementation.
  11. Competency: New skills and capabilities are needed for Quality 4.0, requiring significant investment in training and workforce development.

The Future of Quality Management in Life Sciences

The evolution from document-centric to data-centric quality management represents a fundamental shift in how life sciences organizations approach quality. While documents will continue to play a role, their purpose and primacy are changing in an increasingly data-driven world.

By focusing on data requirements rather than document types, organizations can build more flexible, responsive, and effective quality systems that truly deliver on the promise of digital transformation. This approach enables life sciences companies to maintain compliance while improving efficiency, enhancing product quality, and ultimately delivering better outcomes for patients.

The journey from documents to data is not merely a technical transition but a strategic evolution that will define quality management for decades to come. As AI, machine learning, and process automation converge with quality management, the organizations that successfully embrace data-centricity will gain significant competitive advantages through improved agility, deeper insights, and more effective compliance in an increasingly complex regulatory landscape.

The paper may go, but the document—reimagined as structured data that enables insight and action—will continue to serve as the foundation of effective quality management. The key is recognizing that documents are vessels for data, and it’s the data that drives value in the organization.

Mechanistic Modeling in Model-Informed Drug Development: Regulatory Compliance Under ICH M15

We are at a fascinating and pivotal moment in standardizing Model-Informed Drug Development (MIDD) across the pharmaceutical industry. The recently released draft ICH M15 guideline, alongside the European Medicines Agency’s evolving framework for mechanistic models and the FDA’s draft guidance on artificial intelligence applications, establishes comprehensive expectations for implementing, evaluating, and documenting computational approaches in drug development. As these regulatory frameworks mature, understanding the nuanced requirements for mechanistic modeling becomes essential for successful drug development and regulatory acceptance.

The Spectrum of Mechanistic Models in Pharmaceutical Development

Mechanistic models represent a distinct category within the broader landscape of Model-Informed Drug Development, distinguished by their incorporation of underlying physiological, biological, or physical principles. Unlike purely empirical approaches that describe relationships within observed data without explaining causality, mechanistic models attempt to represent the actual processes driving those observations. These models facilitate extrapolation beyond observed data points and enable prediction across diverse scenarios that may not be directly observable in clinical studies.

Physiologically-Based Pharmacokinetic Models

Physiologically-based pharmacokinetic (PBPK) models incorporate anatomical, physiological, and biochemical information to simulate drug absorption, distribution, metabolism, and excretion processes. These models typically represent the body as a series of interconnected compartments corresponding to specific organs or tissues, with parameters reflecting physiological properties such as blood flow, tissue volumes, and enzyme expression levels. For example, a PBPK model might be used to predict the impact of hepatic impairment on drug clearance by adjusting liver blood flow and metabolic enzyme expression parameters to reflect pathophysiological changes. Such models are particularly valuable for predicting drug exposures in special populations (pediatric, geriatric, or disease states) where conducting extensive clinical trials might be challenging or ethically problematic.

Quantitative Systems Pharmacology Models

Quantitative systems pharmacology (QSP) models integrate pharmacokinetics with pharmacodynamic mechanisms at the systems level, incorporating feedback mechanisms and homeostatic controls. These models typically include detailed representations of biological pathways and drug-target interactions. For instance, a QSP model for an immunomodulatory agent might capture the complex interplay between different immune cell populations, cytokine signaling networks, and drug-target binding dynamics. This approach enables prediction of emergent properties that might not be apparent from simpler models, such as delayed treatment effects or rebound phenomena following drug discontinuation. The ICH M15 guideline specifically acknowledges the value of QSP models for integrating knowledge across different biological scales and predicting outcomes in scenarios where data are limited.

Agent-Based Models

Agent-based models simulate the actions and interactions of autonomous entities (agents) to assess their effects on the system as a whole. In pharmaceutical applications, these models are particularly useful for infectious disease modeling or immune system dynamics. For example, an agent-based model might represent individual immune cells and pathogens as distinct agents, each following programmed rules of behavior, to simulate the immune response to a vaccine. The emergent patterns from these individual interactions can provide insights into population-level responses that would be difficult to capture with more traditional modeling approaches5.

Disease Progression Models

Disease progression models mathematically represent the natural history of a disease and how interventions might modify its course. These models incorporate time-dependent changes in biomarkers or clinical endpoints related to the underlying pathophysiology. For instance, a disease progression model for Alzheimer’s disease might include parameters representing the accumulation of amyloid plaques, neurodegeneration rates, and cognitive decline, allowing simulation of how disease-modifying therapies might alter the trajectory of cognitive function over time. The ICH M15 guideline recognizes the value of these models for characterizing long-term treatment effects that may not be directly observable within the timeframe of clinical trials.

Applying the MIDD Evidence Assessment Framework to Mechanistic Models

The ICH M15 guideline introduces a structured framework for assessment of MIDD evidence, which applies across modeling methodologies but requires specific considerations for mechanistic models. This framework centers around several key elements that must be clearly defined and assessed to establish the credibility of model-based evidence.

Defining Questions of Interest and Context of Use

For mechanistic models, precisely defining the Question of Interest is particularly important due to their complexity and the numerous assumptions embedded within their structure. According to the ICH M15 guideline, the Question of Interest should “describe the specific objective of the MIDD evidence” in a concise manner. For example, a Question of Interest for a PBPK model might be: “What is the appropriate dose adjustment for patients with severe renal impairment?” or “What is the expected magnitude of a drug-drug interaction when Drug A is co-administered with Drug B?”

The Context of Use must provide a clear description of the model’s scope, the data used in its development, and how the model outcomes will contribute to answering the Question of Interest. For mechanistic models, this typically includes explicit statements about the physiological processes represented, assumptions regarding system behavior, and the intended extrapolation domain. For instance, the Context of Use for a QSP model might specify: “The model will be used to predict the time course of viral load reduction following administration of a novel antiviral therapy at doses ranging from 10 to 100 mg in treatment-naïve adult patients with hepatitis C genotype 1.”

Conducting Model Risk and Impact Assessment

Model Risk assessment combines the Model Influence (the weight of model outcomes in decision-making) with the Consequence of Wrong Decision (potential impact on patient safety or efficacy). For mechanistic models, the Model Influence is often high due to their ability to simulate conditions that cannot be directly observed in clinical trials. For example, if a PBPK model is being used as the primary evidence to support a dosing recommendation in a specific patient population without confirmatory clinical data, its influence would be rated as “high.”

The Consequence of Wrong Decision should be assessed based on potential impacts on patient safety and efficacy. For instance, if a mechanistic model is being used to predict drug exposures in pediatric patients for a drug with a narrow therapeutic index, the consequence of an incorrect prediction could be significant adverse events or treatment failure, warranting a “high” rating.

Model Impact reflects the contribution of model outcomes relative to current regulatory expectations or standards. For novel mechanistic modeling approaches, the Model Impact may be high if they are being used to replace traditionally required clinical studies or inform critical labeling decisions. The assessment table provided in Appendix 1 of the ICH M15 guideline serves as a practical tool for structuring this evaluation and facilitating communication with regulatory authorities.

Comprehensive Approach to Uncertainty Quantification in Mechanistic Models

Uncertainty quantification (UQ) is the science of quantitative characterization and estimation of uncertainties in both computational and real-world applications. It aims to determine how likely certain outcomes are when aspects of the system are not precisely known. For mechanistic models, this process is particularly crucial due to their complexity and the numerous assumptions embedded within their structure. A comprehensive uncertainty quantification approach is essential for establishing model credibility and supporting regulatory decision-making.

Types of Uncertainty in Mechanistic Models

Understanding the different sources of uncertainty is the first step toward effectively quantifying and communicating the limitations of model predictions. In mechanistic modeling, uncertainty typically stems from three primary sources:

Parameter Uncertainty

Parameter uncertainty emerges from imprecise knowledge of model parameters that serve as inputs to the mathematical model. These parameters may be unknown, variable, or cannot be precisely inferred from available data. In physiologically-based pharmacokinetic (PBPK) models, parameter uncertainty might include tissue partition coefficients, enzyme expression levels, or membrane permeability values. For example, the liver-to-plasma partition coefficient for a lipophilic drug might be estimated from in vitro measurements but carry considerable uncertainty due to experimental variability or limitations in the in vitro system’s representation of in vivo conditions.

Parametric Uncertainty

Parametric uncertainty derives from the variability of input variables across the target population. In the context of drug development, this might include demographic factors (age, weight, ethnicity), genetic polymorphisms affecting drug metabolism, or disease states that influence drug disposition or response. For instance, the activity of CYP3A4, a major drug-metabolizing enzyme, can vary up to 20-fold among individuals due to genetic, environmental, and physiological factors. This variability introduces uncertainty when predicting drug clearance in a diverse patient population.

Structural Uncertainty

Structural uncertainty, also known as model inadequacy or model discrepancy, results from incomplete knowledge of the underlying biology or physics. It reflects the gap between the mathematical representation and the true biological system. For example, a PBPK model might assume first-order kinetics for a metabolic pathway that actually exhibits more complex behavior at higher drug concentrations, or a QSP model might omit certain feedback mechanisms that become relevant under specific conditions. Structural uncertainty is often the most challenging type to quantify because it represents “unknown unknowns” in our understanding of the system.

Profile Likelihood Analysis for Parameter Identifiability and Uncertainty

Profile likelihood analysis has emerged as an efficient tool for practical identifiability analysis of mechanistic models, providing a systematic approach to exploring parameter uncertainty and identifiability issues. This approach involves fixing one parameter at various values across a range of interest while optimizing all other parameters to obtain the best possible fit to the data. The resulting profile of likelihood (or objective function) values reveals how well the parameter is constrained by the available data.

According to recent methodological developments, profile likelihood analysis provides equivalent verdicts concerning identifiability orders of magnitude faster than other approaches, such as Markov chain Monte Carlo (MCMC). The methodology involves the following steps:

  1. Selecting a parameter of interest (θi) and a range of values to explore
  2. For each value of θi, optimizing all other parameters to minimize the objective function
  3. Recording the optimized objective function value to construct the profile
  4. Repeating for all parameters of interest

The resulting profiles enable several key analyses:

  • Construction of confidence intervals representing overall uncertainties
  • Identification of non-identifiable parameters (flat profiles)
  • Attribution of the influence of specific parameters on predictions
  • Exploration of correlations between parameters (linked identifiability)

For example, when applying profile likelihood analysis to a mechanistic model of drug absorption with parameters for dissolution rate, permeability, and gut transit time, the analysis might reveal that while dissolution rate and permeability are individually non-identifiable (their individual values cannot be uniquely determined), their product is well-defined. This insight helps modelers understand which parameter combinations are constrained by the data and where additional experiments might be needed to reduce uncertainty.

Monte Carlo Simulation for Uncertainty Propagation

Monte Carlo simulation provides a powerful approach for propagating uncertainty from model inputs to outputs. This technique involves randomly sampling from probability distributions representing parameter uncertainty, running the model with each sampled parameter set, and analyzing the resulting distribution of outputs. The process comprises several key steps:

  1. Defining probability distributions for uncertain parameters based on available data or expert knowledge
  2. Generating random samples from these distributions, accounting for correlations between parameters
  3. Running the model for each sampled parameter set
  4. Analyzing the resulting output distributions to characterize prediction uncertainty

For example, in a PBPK model of a drug primarily eliminated by CYP3A4, the enzyme abundance might be represented by a log-normal distribution with parameters derived from population data. Monte Carlo sampling from this and other relevant distributions (e.g., organ blood flows, tissue volumes) would generate thousands of virtual individuals, each with a physiologically plausible parameter set. The model would then be simulated for each virtual individual to produce a distribution of predicted drug exposures, capturing the expected population variability and parameter uncertainty.

To ensure robust uncertainty quantification, the number of Monte Carlo samples must be sufficient to achieve stable estimates of output statistics. The Monte Carlo Error (MCE), defined as the standard deviation of the Monte Carlo estimator, provides a measure of the simulation precision and can be estimated using bootstrap resampling. For critical regulatory applications, it is important to demonstrate that the MCE is small relative to the overall output uncertainty, confirming that simulation imprecision is not significantly influencing the conclusions.

Sensitivity Analysis Techniques

Sensitivity analysis quantifies how changes in model inputs influence the outputs, helping to identify the parameters that contribute most significantly to prediction uncertainty. Several approaches to sensitivity analysis are particularly valuable for mechanistic models:

Local Sensitivity Analysis

Local sensitivity analysis examines how small perturbations in input parameters affect model outputs, typically by calculating partial derivatives at a specific point in parameter space. For mechanistic models described by ordinary differential equations (ODEs), sensitivity equations can be derived directly from the model equations and solved alongside the original system. Local sensitivities provide valuable insights into model behavior around a specific parameter set but may not fully characterize the effects of larger parameter variations or interactions between parameters.

Global Sensitivity Analysis

Global sensitivity analysis explores the full parameter space, accounting for non-linearities and interactions that local methods might miss. Variance-based methods, such as Sobol indices, decompose the output variance into contributions from individual parameters and their interactions. These methods require extensive sampling of the parameter space but provide comprehensive insights into parameter importance across the entire range of uncertainty.

Tornado Diagrams for Visualizing Parameter Influence

Tornado diagrams offer a straightforward visualization of parameter sensitivity, showing how varying each parameter within its uncertainty range affects a specific model output. These diagrams rank parameters by their influence, with the most impactful parameters at the top, creating the characteristic “tornado” shape. For example, a tornado diagram for a PBPK model might reveal that predicted maximum plasma concentration is most sensitive to absorption rate constant, followed by clearance and volume of distribution, while other parameters have minimal impact. This visualization helps modelers and reviewers quickly identify the critical parameters driving prediction uncertainty.

Step-by-Step Uncertainty Quantification Process

Implementing comprehensive uncertainty quantification for mechanistic models requires a structured approach. The following steps provide a detailed guide to the process:

  1. Parameter Uncertainty Characterization:
    • Compile available data on parameter values and variability
    • Estimate probability distributions for each parameter
    • Account for correlations between parameters
    • Document data sources and distribution selection rationale
  2. Model Structural Analysis:
    • Identify key assumptions and simplifications in the model structure
    • Assess potential alternative model structures
    • Consider multiple model structures if structural uncertainty is significant
  3. Identifiability Analysis:
    • Perform profile likelihood analysis for key parameters
    • Identify practical and structural non-identifiabilities
    • Develop strategies to address non-identifiable parameters (e.g., fixing to literature values, reparameterization)
  4. Global Uncertainty Propagation:
    • Define sampling strategy for Monte Carlo simulation
    • Generate parameter sets accounting for correlations
    • Execute model simulations for all parameter sets
    • Calculate summary statistics and confidence intervals for model outputs
  5. Sensitivity Analysis:
    • Conduct global sensitivity analysis to identify key uncertainty drivers
    • Create tornado diagrams for critical model outputs
    • Explore parameter interactions through advanced sensitivity methods
  6. Documentation and Communication:
    • Clearly document all uncertainty quantification methods
    • Present results using appropriate visualizations
    • Discuss implications for decision-making
    • Acknowledge limitations in the uncertainty quantification approach

For regulatory submissions, this process should be documented in the Model Analysis Plan (MAP) and Model Analysis Report (MAR), with particular attention to the methods used to characterize parameter uncertainty, the approach to sensitivity analysis, and the interpretation of uncertainty in model predictions.

Case Example: Uncertainty Quantification for a PBPK Model

To illustrate the practical application of uncertainty quantification, consider a PBPK model developed to predict drug exposures in patients with hepatic impairment. The model includes parameters representing physiological changes in liver disease (reduced hepatic blood flow, decreased enzyme expression, altered plasma protein binding) and drug-specific parameters (intrinsic clearance, tissue partition coefficients).

Parameter uncertainty is characterized based on literature data, with hepatic blood flow in cirrhotic patients represented by a log-normal distribution (mean 0.75 L/min, coefficient of variation 30%) and enzyme expression by a similar distribution (mean 60% of normal, coefficient of variation 40%). Drug-specific parameters are derived from in vitro experiments, with intrinsic clearance following a normal distribution centered on the mean experimental value with standard deviation reflecting experimental variability.

Profile likelihood analysis reveals that while total hepatic clearance is well-identified from available pharmacokinetic data, separating the contributions of blood flow and intrinsic clearance is challenging. This insight suggests that predictions of clearance changes in hepatic impairment might be robust despite uncertainty in the underlying mechanisms.

Monte Carlo simulation with 10,000 parameter sets generates a distribution of predicted concentration-time profiles. The results indicate that in severe hepatic impairment, drug exposure (AUC) is expected to increase 3.2-fold (90% confidence interval: 2.1 to 4.8-fold) compared to healthy subjects. Sensitivity analysis identifies hepatic blood flow as the primary contributor to prediction uncertainty, followed by intrinsic clearance and plasma protein binding.

This comprehensive uncertainty quantification supports a dosing recommendation to reduce the dose by 67% in severe hepatic impairment, with the understanding that therapeutic drug monitoring might be advisable given the wide confidence interval in the predicted exposure increase.

Model Structure and Identifiability in Mechanistic Modeling

The selection of model structure represents a critical decision in mechanistic modeling that directly impacts the model’s predictive capabilities and limitations. For regulatory acceptance, both the conceptual and mathematical structure must be justified based on current scientific understanding of the underlying biological processes.

Determining Appropriate Model Structure

Model structure should be consistent with available knowledge on drug characteristics, pharmacology, physiology, and disease pathophysiology. The level of complexity should align with the Question of Interest – incorporating sufficient detail to capture relevant phenomena while avoiding unnecessary complexity that could introduce additional uncertainty.

Key structural aspects to consider include:

  • Compartmentalization (e.g., lumped vs. physiologically-based compartments)
  • Rate processes (e.g., first-order vs. saturable kinetics)
  • System boundaries (what processes are included vs. excluded)
  • Time scales (what temporal dynamics are captured)

For example, when modeling the pharmacokinetics of a highly lipophilic drug with slow tissue distribution, a model structure with separate compartments for poorly and well-perfused tissues would be appropriate to capture the delayed equilibration with adipose tissue. In contrast, for a hydrophilic drug with rapid distribution, a simpler structure with fewer compartments might be sufficient. The selection should be justified based on the drug’s physicochemical properties and observed pharmacokinetic behavior.

Comprehensive Identifiability Analysis

Identifiability refers to the ability to uniquely determine the values of model parameters from available data. This concept is particularly important for mechanistic models, which often contain numerous parameters that may not all be directly observable.

Two forms of non-identifiability can occur:

  • Structural non-identifiability: When the model structure inherently prevents unique parameter determination, regardless of data quality
  • Practical non-identifiability: When limitations in the available data (quantity, quality, or information content) prevent precise parameter estimation

Profile likelihood analysis provides a reliable and efficient approach for identifiability assessment of mechanistic models. This methodology involves systematically varying individual parameters while re-optimizing all others, generating profiles that visualize parameter identifiability and uncertainty.

For example, in a physiologically-based pharmacokinetic model, structural non-identifiability might arise if the model includes separate parameters for the fraction absorbed and bioavailability, but only plasma concentration data is available. Since these parameters appear as a product in the equations governing plasma concentrations, they cannot be uniquely identified without additional data (e.g., portal vein sampling or intravenous administration for comparison).

Practical non-identifiability might occur if a parameter’s influence on model outputs is small relative to measurement noise, or if sampling times are not optimally designed to inform specific parameters. For instance, if blood sampling times are concentrated in the distribution phase, parameters governing terminal elimination might not be practically identifiable despite being structurally identifiable.

For regulatory submissions, identifiability analysis should be documented, with particular attention to parameters critical for the model’s intended purpose. Non-identifiable parameters should be acknowledged, and their potential impact on predictions should be assessed through sensitivity analyses.

Regulatory Requirements for Data Quality and Relevance

Regulatory authorities place significant emphasis on the quality and relevance of data used in mechanistic modeling. The ICH M15 guideline provides specific recommendations regarding data considerations for model development and evaluation.

Data Quality Standards and Documentation

Data used for model development and validation should adhere to appropriate quality standards, with consideration of the data’s intended use within the modeling context. For data derived from clinical studies, Good Clinical Practice (GCP) standards typically apply, while non-clinical data should comply with Good Laboratory Practice (GLP) when appropriate.

The FDA guidance on AI in drug development emphasizes that data should be “fit for use,” meaning it should be both relevant (including key data elements and sufficient representation) and reliable (accurate, complete, and traceable). This concept applies equally to mechanistic models, particularly those incorporating AI components for parameter estimation or data integration.

Documentation of data provenance, collection methods, and any processing or transformation steps is essential. For literature-derived data, the selection criteria, extraction methods, and assessment of quality should be transparently reported. For example, when using published clinical trial data to develop a population pharmacokinetic model, modelers should document:

  • Search strategy and inclusion/exclusion criteria for study selection
  • Extraction methods for relevant data points
  • Assessment of study quality and potential biases
  • Methods for handling missing data or reconciling inconsistencies across studies

This comprehensive documentation enables reviewers to assess whether the data foundation of the model is appropriate for its intended regulatory use.

Data Relevance Assessment for Target Populations

The relevance and appropriateness of data to answer the Question of Interest must be justified. This includes consideration of:

  • Population characteristics relative to the target population
  • Study design features (dosing regimens, sampling schedules, etc.)
  • Bioanalytical methods and their sensitivity/specificity
  • Environmental or contextual factors that might influence results

For example, when developing a mechanistic model to predict drug exposures in pediatric patients, data relevance considerations might include:

  • Age distribution of existing pediatric data compared to the target age range
  • Developmental factors affecting drug disposition (e.g., ontogeny of metabolic enzymes)
  • Body weight and other anthropometric measures relevant to scaling
  • Disease characteristics if the target population has a specific condition

The rationale for any data exclusion should be provided, and the potential for selection bias should be assessed. Data transformations and imputations should be specified, justified, and documented in the Model Analysis Plan (MAP) and Model Analysis Report (MAR).

Data Management Systems for Regulatory Compliance

Effective data management is increasingly important for regulatory compliance in model-informed approaches. Financial institutions have been required to overhaul their risk management processes with greater reliance on data, providing detailed reports to regulators on the risks they face and their impact on their capital and liquidity positions. Similar expectations are emerging in pharmaceutical development.

A robust data management system should be implemented that enables traceability from raw data to model inputs, with appropriate version control and audit trails. This system should include:

  • Data collection and curation protocols
  • Quality control procedures
  • Documentation of data transformations and aggregations
  • Tracking of data version used for specific model iterations
  • Access controls to ensure data integrity

This comprehensive data management approach ensures that mechanistic models are built on a solid foundation of high-quality, relevant data that can withstand regulatory scrutiny.

Model Development and Evaluation: A Comprehensive Approach

The ICH M15 guideline outlines a comprehensive approach to model evaluation through three key elements: verification, validation, and applicability assessment. These elements collectively determine the acceptability of the model for answering the Question of Interest and form the basis of MIDD evidence assessment.

Verification Procedures for Mechanistic Models

Verification activities aim to ensure that user-generated codes for processing data and conducting analyses are error-free, equations reflecting model assumptions are correctly implemented, and calculations are accurate. For mechanistic models, verification typically involves:

  1. Code verification: Ensuring computational implementation correctly represents the mathematical model through:
    • Code review by qualified personnel
    • Unit testing of individual model components
    • Comparison with analytical solutions for simplified cases
    • Benchmarking against established implementations when available
  2. Solution verification: Confirming numerical solutions are sufficiently accurate by:
    • Assessing sensitivity to solver settings (e.g., time step size, tolerance)
    • Demonstrating solution convergence with refined numerical parameters
    • Implementing mass balance checks for conservation laws
    • Verifying steady-state solutions where applicable
  3. Calculation verification: Checking that derived quantities are correctly calculated through:
    • Independent recalculation of key metrics
    • Verification of dimensional consistency
    • Cross-checking outputs against simplified calculations

For example, verification of a physiologically-based pharmacokinetic model implemented in a custom software platform might include comparing numerical solutions against analytical solutions for simple cases (e.g., one-compartment models), demonstrating mass conservation across compartments, and verifying that area under the curve (AUC) calculations match direct numerical integration of concentration-time profiles.

Validation Strategies for Mechanistic Models

Validation activities assess the adequacy of model robustness and performance. For mechanistic models, validation should address:

  1. Conceptual validation: Ensuring the model structure aligns with current scientific understanding by:
    • Reviewing the biological basis for model equations
    • Assessing mechanistic plausibility of parameter values
    • Confirming alignment with established scientific literature
  2. Mathematical validation: Confirming the equations appropriately represent the conceptual model through:
    • Dimensional analysis to ensure physical consistency
    • Bounds checking to verify physiological plausibility
    • Stability analysis to identify potential numerical issues
  3. Predictive validation: Evaluating the model’s ability to predict observed outcomes by:
    • Comparing predictions to independent data not used in model development
    • Assessing prediction accuracy across diverse scenarios
    • Quantifying prediction uncertainty and comparing to observed variability

Model performance should be assessed using both graphical and numerical metrics, with emphasis on those most relevant to the Question of Interest. For example, validation of a QSP model for predicting treatment response might include visual predictive checks comparing simulated and observed biomarker trajectories, calculation of prediction errors for key endpoints, and assessment of the model’s ability to reproduce known drug-drug interactions or special population effects.

External Validation: The Gold Standard

External validation with independent data is particularly valuable for mechanistic models and can substantially increase confidence in their applicability. This involves testing the model against data that was not used in model development or parameter estimation. The strength of external validation depends on the similarity between the validation dataset and the intended application domain.

For example, a metabolic drug-drug interaction model developed using data from healthy volunteers might be externally validated using:

  • Data from a separate clinical study with different dosing regimens
  • Observations from patient populations not included in model development
  • Real-world evidence collected in post-marketing settings

The results of external validation should be documented with the same rigor as the primary model development, including clear specification of validation criteria and quantitative assessment of prediction performance.

Applicability Assessment for Regulatory Decision-Making

Applicability characterizes the relevance and adequacy of the model’s contribution to answering a specific Question of Interest. This assessment should consider:

  1. The alignment between model scope and the Question of Interest:
    • Does the model include all relevant processes?
    • Are the included mechanisms sufficient to address the question?
    • Are simplifying assumptions appropriate for the intended use?
  2. The appropriateness of model assumptions for the intended application:
    • Are physiological parameter values representative of the target population?
    • Do the mechanistic assumptions hold under the conditions being simulated?
    • Has the model been tested under conditions similar to the intended application?
  3. The validity of extrapolations beyond the model’s development dataset:
    • Is extrapolation based on established scientific principles?
    • Have similar extrapolations been previously validated?
    • Is the degree of extrapolation reasonable given model uncertainty?

For example, applicability assessment for a PBPK model being used to predict drug exposures in pediatric patients might evaluate whether:

  • The model includes age-dependent changes in physiological parameters
  • Enzyme ontogeny profiles are supported by current scientific understanding
  • The extrapolation from adult to pediatric populations relies on well-established scaling principles
  • The degree of extrapolation is reasonable given available pediatric pharmacokinetic data for similar compounds

Detailed Plan for Meeting Regulatory Requirements

A comprehensive plan for ensuring regulatory compliance should include detailed steps for model development, evaluation, and documentation. The following expanded approach provides a structured pathway to meet regulatory expectations:

  1. Development of a comprehensive Model Analysis Plan (MAP):
    • Clear articulation of the Question of Interest and Context of Use
    • Detailed description of data sources, including quality assessments
    • Comprehensive inclusion/exclusion criteria for literature-derived data
    • Justification of model structure with reference to biological mechanisms
    • Detailed parameter estimation strategy, including handling of non-identifiability
    • Comprehensive verification, validation, and applicability assessment approaches
    • Specific technical criteria for model evaluation, with acceptance thresholds
    • Detailed simulation methodologies, including virtual population generation
    • Uncertainty quantification approach, including sensitivity analysis methods
  2. Implementation of rigorous verification activities:
    • Systematic code review by qualified personnel not involved in code development
    • Unit testing of all computational components with documented test cases
    • Integration testing of the complete modeling workflow
    • Verification of numerical accuracy through comparison with analytical solutions
    • Mass balance checking for conservation laws
    • Comprehensive documentation of all verification procedures and results
  3. Execution of multi-faceted validation activities:
    • Systematic evaluation of data relevance and quality for model development
    • Comprehensive assessment of parameter identifiability using profile likelihood
    • Detailed sensitivity analyses to determine parameter influence on key outputs
    • Comparison of model predictions against development data with statistical assessment
    • External validation against independent datasets
    • Evaluation of predictive performance across diverse scenarios
    • Assessment of model robustness to parameter uncertainty
  4. Comprehensive documentation in a Model Analysis Report (MAR):
    • Executive summary highlighting key findings and conclusions
    • Detailed introduction establishing scientific and regulatory context
    • Clear statement of objectives aligned with Questions of Interest
    • Comprehensive description of data sources and quality assessment
    • Detailed explanation of model structure with scientific justification
    • Complete documentation of parameter estimation and uncertainty quantification
    • Comprehensive results of model development and evaluation
    • Thorough discussion of limitations and their implications
    • Clear conclusions regarding model applicability for the intended purpose
    • Complete references and supporting materials
  5. Preparation of targeted regulatory submission materials:
    • Completion of the assessment table from ICH M15 Appendix 1 with detailed justifications
    • Development of concise summaries for inclusion in regulatory documents
    • Preparation of responses to anticipated regulatory questions
    • Organization of supporting materials (MAPs, MARs, code, data) for submission
    • Development of visual aids to communicate model structure and results effectively

This detailed approach ensures alignment with regulatory expectations while producing robust, scientifically sound mechanistic models suitable for drug development decision-making.

Virtual Population Generation and Simulation Scenarios

The development of virtual populations and the design of simulation scenarios represent critical aspects of mechanistic modeling that directly impact the relevance and reliability of model predictions. Proper design and implementation of these elements are essential for regulatory acceptance of model-based evidence.

Developing Representative Virtual Populations

Virtual population models serve as digital representations of human anatomical and physiological variability. The Virtual Population (ViP) models represent one prominent example, consisting of detailed high-resolution anatomical models created from magnetic resonance image data of volunteers.

For mechanistic modeling in drug development, virtual populations should capture relevant demographic, physiological, and genetic characteristics of the target patient population. Key considerations include:

  1. Population parameters and their distributions: Demographic variables (age, weight, height) and physiological parameters (organ volumes, blood flows, enzyme expression levels) should be represented by appropriate statistical distributions derived from population data. For example, liver volume might follow a log-normal distribution with parameters estimated from anatomical studies, while CYP enzyme expression might follow similar distributions with parameters derived from liver bank data.
  2. Correlations between parameters: Physiological parameters are often correlated (e.g., body weight correlates with organ volumes and cardiac output), and these correlations must be preserved to ensure physiological plausibility. Correlation structures can be implemented using techniques such as copulas or multivariate normal distributions with specified correlation matrices.
  3. Special populations: When modeling special populations (pediatric, geriatric, renal/hepatic impairment), the virtual population should reflect the specific physiological changes associated with these conditions. For pediatric populations, this includes age-dependent changes in body composition, organ maturation, and enzyme ontogeny. For disease states, the relevant pathophysiological changes should be incorporated, such as reduced glomerular filtration rate in renal impairment or altered hepatic blood flow in cirrhosis.
  4. Genetic polymorphisms: For drugs metabolized by enzymes with known polymorphisms (e.g., CYP2D6, CYP2C19), the virtual population should include the relevant frequency distributions of these genetic variants. This enables prediction of exposure variability and identification of potential high-risk subpopulations.

For example, a virtual population for evaluating a drug primarily metabolized by CYP2D6 might include subjects across the spectrum of metabolizer phenotypes: poor metabolizers (5-10% of Caucasians), intermediate metabolizers (10-15%), extensive metabolizers (65-80%), and ultrarapid metabolizers (5-10%). The physiological parameters for each group would be adjusted to reflect the corresponding enzyme activity levels, allowing prediction of drug exposure across phenotypes and evaluation of potential dose adjustment requirements.

Designing Informative Simulation Scenarios

Simulation scenarios should be designed to address specific questions while accounting for parameter and assumption uncertainties. Effective simulation design requires careful consideration of several factors:

  1. Clear definition of simulation objectives aligned with the Question of Interest: Simulation objectives should directly support the regulatory question being addressed. For example, if the Question of Interest relates to dose selection for a specific patient population, simulation objectives might include characterizing exposure distributions across doses, identifying factors influencing exposure variability, and determining the proportion of patients achieving target exposure levels.
  2. Comprehensive specification of treatment regimens: Simulation scenarios should include all relevant aspects of the treatment protocol, such as dose levels, dosing frequency, administration route, and duration. For complex regimens (loading doses, titration, maintenance), the complete dosing algorithm should be specified. For example, a simulation evaluating a titration regimen might include scenarios with different starting doses, titration criteria, and dose adjustment magnitudes.
  3. Strategic sampling designs: Sampling strategies should be specified to match the clinical setting being simulated. This includes sampling times, measured analytes (parent drug, metabolites), and sampling compartments (plasma, urine, tissue). For exposure-response analyses, the sampling design should capture the relationship between pharmacokinetics and pharmacodynamic effects.
  4. Incorporation of relevant covariates and their influence: Simulation scenarios should explore the impact of covariates known or suspected to influence drug behavior. This includes demographic factors (age, weight, sex), physiological variables (renal/hepatic function), concomitant medications, and food effects. For example, a comprehensive simulation plan might include scenarios for different age groups, renal function categories, and with/without interacting medications.

For regulatory submissions, simulation methods and scenarios should be described in sufficient detail to enable evaluation of their plausibility and relevance. This includes justification of the simulation approach, description of virtual subject generation, and explanation of analytical methods applied to simulation results.

Fractional Factorial Designs for Efficient Simulation

When the simulation is intended to represent a complex trial with multiple factors, “fractional” or “response surface” designs are often appropriate, as they provide an efficient way to examine relationships between multiple factors and outcomes. These designs enable maximum reliability from the resources devoted to the project and allow examination of individual and joint impacts of numerous factors.

For example, a simulation exploring the impact of renal impairment, age, and body weight on drug exposure might employ a fractional factorial design rather than simulating all possible combinations. This approach strategically samples the multidimensional parameter space to provide comprehensive insights with fewer simulation runs.

The design and analysis of such simulation studies should follow established principles of experiment design, including:

  • Proper randomization to avoid systematic biases
  • Balanced allocation across factor levels when appropriate
  • Statistical power calculations to determine required simulation sample sizes
  • Appropriate statistical methods for analyzing multifactorial results

These approaches maximize the information obtained from simulation studies while maintaining computational efficiency, providing robust evidence for regulatory decision-making.

Best Practices for Reporting Results of Mechanistic Modeling and Simulation

Effective communication of mechanistic modeling results is essential for regulatory acceptance and scientific credibility. The ICH M15 guideline and related regulatory frameworks provide specific recommendations for documentation and reporting that apply directly to mechanistic models.

Structured Documentation Through Model Analysis Plans and Reports

Predefined Model Analysis Plans (MAPs) should document the planned analyses, including objectives, data sources, modeling methods, and evaluation criteria. For mechanistic models, MAPs should additionally specify:

  1. The biological basis for the model structure, with reference to current scientific understanding and literature support
  2. Detailed description of model equations and their mechanistic interpretation
  3. Sources and justification for physiological parameters, including population distributions
  4. Comprehensive approach for addressing parameter uncertainty
  5. Specific methods for evaluating predictive performance, including acceptance criteria

Results should be documented in Model Analysis Reports (MARs) following the structure outlined in Appendix 2 of the ICH M15 guideline. A comprehensive MAR for a mechanistic model should include:

  1. Executive Summary: Concise overview of the modeling approach, key findings, and conclusions relevant to the regulatory question
  2. Introduction: Detailed background on the drug, mechanism of action, and scientific context for the modeling approach
  3. Objectives: Clear statement of modeling goals aligned with specific Questions of Interest
  4. Data and Methods: Comprehensive description of:
    • Data sources, quality assessment, and relevance evaluation
    • Detailed model structure with mechanistic justification
    • Parameter estimation approach and results
    • Uncertainty quantification methodology
    • Verification and validation procedures
  5. Results: Detailed presentation of:
    • Model development process and parameter estimates
    • Uncertainty analysis results, including parameter confidence intervals
    • Sensitivity analysis identifying key drivers of model behavior
    • Validation results with statistical assessment of predictive performance
    • Simulation outcomes addressing the specific regulatory questions
  6. Discussion: Thoughtful interpretation of results, including:
    • Mechanistic insights gained from the modeling
    • Comparison with previous knowledge and expectations
    • Limitations of the model and their implications
    • Uncertainty in predictions and its regulatory impact
  7. Conclusions: Assessment of model adequacy for the intended purpose and specific recommendations for regulatory decision-making
  8. References and Appendices: Supporting information, including detailed results, code documentation, and supplementary analyses

Assessment Tables for Regulatory Communication

The assessment table from ICH M15 Appendix 1 provides a structured format for communicating key aspects of the modeling approach. For mechanistic models, this table should clearly specify:

  1. Question of Interest: Precise statement of the regulatory question being addressed
  2. Context of Use: Detailed description of the model scope and intended application
  3. Model Influence: Assessment of how heavily the model evidence weighs in the overall decision-making
  4. Consequence of Wrong Decision: Evaluation of potential impacts on patient safety and efficacy
  5. Model Risk: Combined assessment of influence and consequences, with justification
  6. Model Impact: Evaluation of the model’s contribution relative to regulatory expectations
  7. Technical Criteria: Specific metrics and thresholds for evaluating model adequacy
  8. Model Evaluation: Summary of verification, validation, and applicability assessment results
  9. Outcome Assessment: Overall conclusion regarding the model’s fitness for purpose

This structured communication facilitates regulatory review by clearly linking the modeling approach to the specific regulatory question and providing a transparent assessment of the model’s strengths and limitations.

Transparency, Completeness, and Parsimony in Reporting

Reporting of mechanistic modeling should follow principles of transparency, completeness, and parsimony. As stated in guidance for simulation in drug development:

  • CLARITY: The report should be understandable in terms of scope and conclusions by intended users
  • COMPLETENESS: Assumptions, methods, and critical results should be described in sufficient detail to be reproduced by an independent team
  • PARSIMONY: The complexity of models and simulation procedures should be no more than necessary to meet the objectives

For simulation studies specifically, reporting should address all elements of the ADEMP framework (Aims, Data-generating mechanisms, Estimands, Methods, and Performance measures).

The ADEMP Framework for Simulation Studies

The ADEMP framework represents a structured approach for planning, conducting, and reporting simulation studies in a comprehensive and transparent manner. Introduced by Morris, White, and Crowther in their seminal 2019 paper published in Statistics in Medicine, this framework has rapidly gained traction across multiple disciplines including biostatistics. ADEMP provides a systematic methodology that enhances the credibility and reproducibility of simulation studies while facilitating clearer communication of complex results.

Components of the ADEMP Framework

Aims

The Aims component explicitly defines the purpose and objectives of the simulation study. This critical first step establishes what questions the simulation intends to answer and provides context for all subsequent decisions. For example, a clear aim might be “to evaluate the hypothesis testing and estimation characteristics of different methods for analyzing pre-post measurements”. Well-articulated aims guide the entire simulation process and help readers understand the context and relevance of the results.

Data-generating Mechanism

The Data-generating mechanism describes precisely how datasets are created for the simulation. This includes specifying the underlying probability distributions, sample sizes, correlation structures, and any other parameters needed to generate synthetic data. For instance, pre-post measurements might be “simulated from a bivariate normal distribution for two groups, with varying treatment effects and pre-post correlations”. This component ensures that readers understand the conditions under which methods are being evaluated and can assess whether these conditions reflect scenarios relevant to their research questions.

Estimands and Other Targets

Estimands refer to the specific parameters or quantities of interest that the simulation aims to estimate or test. This component defines what “truth” is known in the simulation and what aspects of this truth the methods should recover or address. For example, “the null hypothesis of no effect between groups is the primary target, the treatment effect is the secondary estimand of interest”. Clear definition of estimands allows for precise evaluation of method performance relative to known truth values.

Methods

The Methods component details which statistical techniques or approaches will be evaluated in the simulation. This should include sufficient technical detail about implementation to ensure reproducibility. In a simulation comparing approaches to pre-post measurement analysis, methods might include ANCOVA, change-score analysis, and post-score analysis. The methods section should also specify software, packages, and key parameter settings used for implementation.

Performance Measures

Performance measures define the metrics used to evaluate and compare the methods being assessed. These metrics should align with the stated aims and estimands of the study. Common performance measures include Type I error rate, power, and bias among others. This component is crucial as it determines how results will be interpreted and what conclusions can be drawn about method performance.

Importance of the ADEMP Framework

The ADEMP framework addresses several common shortcomings observed in simulation studies by providing a structured approach, ADEMP helps researchers:

  • Plan simulation studies more rigorously before execution
  • Document design decisions in a systematic manner
  • Report results comprehensively and transparently
  • Enable better assessment of the validity and generalizability of findings
  • Facilitate reproduction and verification by other researchers

Implementation

When reporting simulation results using the ADEMP framework, researchers should:

  • Present results clearly answering the main research questions
  • Acknowledge uncertainty in estimated performance (e.g., through Monte Carlo standard errors)
  • Balance between streamlined reporting and comprehensive detail
  • Use effective visual presentations combined with quantitative summaries
  • Avoid selectively reporting only favorable conditions

Visual Communication of Uncertainty

Effective communication of uncertainty is essential for proper interpretation of mechanistic model results. While tempting to present only point estimates, comprehensive reporting should include visual representations of uncertainty:

  1. Confidence/prediction intervals on key plots, such as concentration-time profiles or exposure-response relationships
  2. Forest plots showing parameter sensitivity and its impact on key outcomes
  3. Tornado diagrams highlighting the relative contribution of different uncertainty sources
  4. Boxplots or violin plots illustrating the distribution of simulated outcomes across virtual subjects

These visualizations help reviewers and decision-makers understand the robustness of conclusions and identify areas where additional data might be valuable.

Conclusion

The evolving regulatory landscape for Model-Informed Drug Development, as exemplified by the ICH M15 draft guideline, the EMA’s mechanistic model guidance initiative, and the FDA’s framework for AI applications, provides both structure and opportunity for the application of mechanistic models in pharmaceutical development. By adhering to the comprehensive frameworks for model evaluation, uncertainty quantification, and documentation outlined in these guidelines, modelers can enhance the credibility and impact of their work.

Mechanistic models offer unique advantages in their ability to integrate biological knowledge with clinical and non-clinical data, enabling predictions across populations, doses, and scenarios that may not be directly observable in clinical studies. However, these benefits come with responsibilities for rigorous model development, thorough uncertainty quantification, and transparent reporting.

The systematic approach described in this article—from clear articulation of modeling objectives through comprehensive validation to structured documentation—provides a roadmap for ensuring mechanistic models meet regulatory expectations while maximizing their value in drug development decision-making. As regulatory science continues to evolve, the principles outlined in ICH M15 and related guidance establish a foundation for consistent assessment and application of mechanistic models that will ultimately contribute to more efficient development of safe and effective medicines.