Building a Data-Driven Culture: Empowering Everyone for Success

Data-driven decision-making is an essential component for achieving organizational success. Simply adopting the latest technologies or bringing on board data scientists is not enough to foster a genuinely data-driven culture. Instead, it requires a comprehensive strategy that involves every level of the organization.

This holistic approach emphasizes the importance of empowering all employees—regardless of their role or technical expertise—to effectively utilize data in their daily tasks and decision-making processes. It involves providing training and resources that enhance data literacy, enabling individuals to understand and interpret data insights meaningfully. Moreover, organizations should cultivate an environment that encourages curiosity and critical thinking around data. This might include promoting cross-departmental collaboration where teams can share insights and best practices regarding data use. Leadership plays a vital role in this transformation by modeling data-driven behaviors and championing a culture that values data as a critical asset. By prioritizing data accessibility and encouraging open dialogue about data analytics, organizations can truly empower their workforce to harness the potential of data, driving informed decisions that contribute to overall success and innovation.

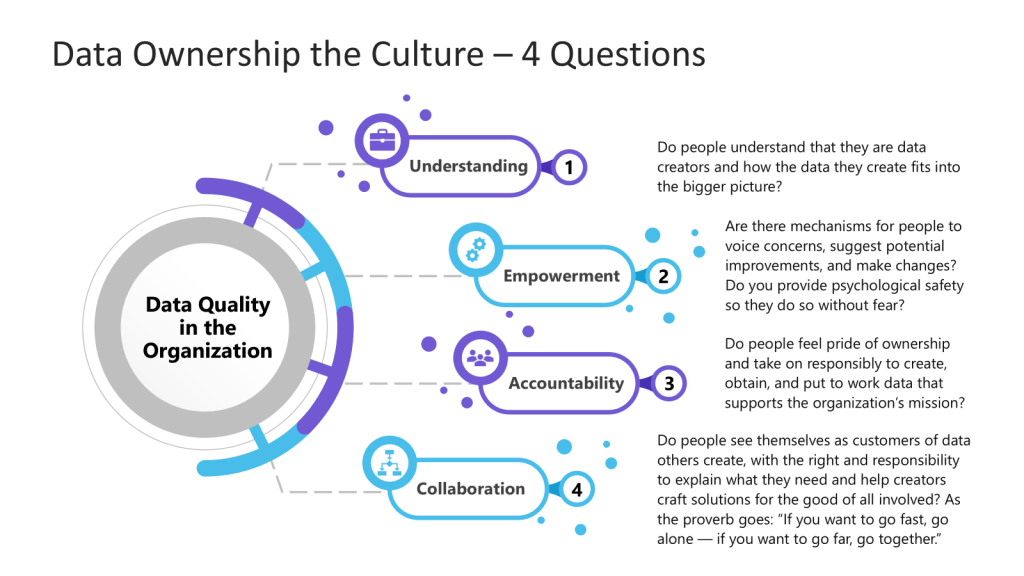
The Three Pillars of Data Empowerment

To build a robust data-driven culture, leaders must focus on three key areas of readiness:

Data Readiness: The Foundation of Informed Decision-Making

Data readiness ensures that high-quality, relevant data is accessible to the right people at the right time. This involves:

  • Implementing robust data governance policies
  • Investing in data management platforms
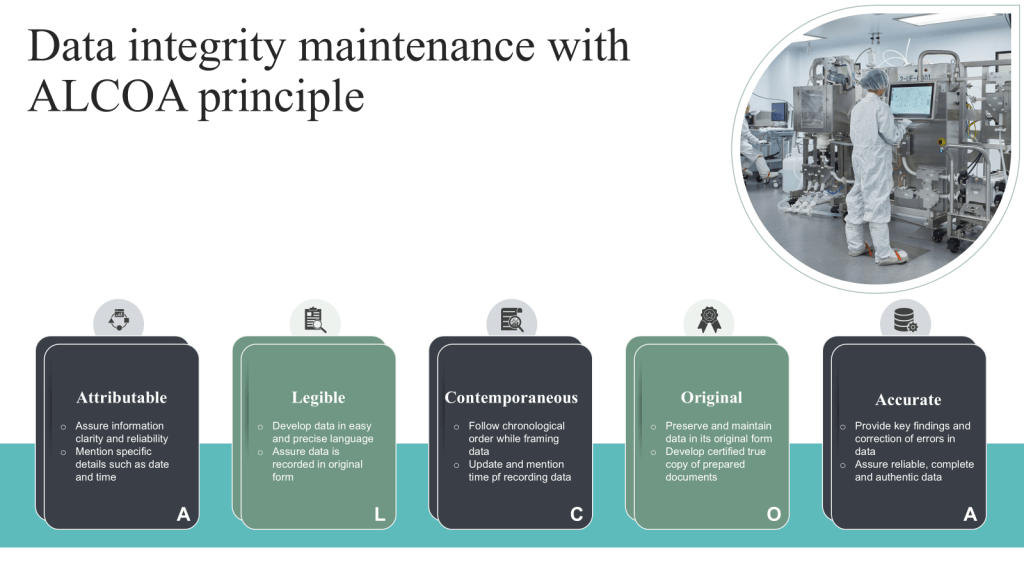
  • Ensuring data quality and consistency
  • Providing secure and streamlined access to data

By establishing a strong foundation of data readiness, organizations can foster trust in their data and encourage its use across all levels of the company.

Analytical Readiness: Cultivating Data Literacy

Analytical readiness is a crucial component of building a data-driven culture. While access to data is essential, it’s only the first step in the journey. To truly harness the power of data, employees need to develop the skills and knowledge necessary to interpret and derive meaningful insights. Let’s delve deeper into the key aspects of analytical readiness:

Comprehensive Training on Data Analysis Tools

Organizations must invest in robust training programs that cover a wide range of data analysis tools and techniques. This training should be tailored to different skill levels and job functions, ensuring that everyone from entry-level employees to senior executives can effectively work with data.

  • Basic data literacy: Start with foundational courses that cover data types, basic statistical concepts, and data visualization principles.
  • Tool-specific training: Provide hands-on training for popular data analysis tools and the specialized business intelligence platforms that are adopted.
  • Advanced analytics: Offer more advanced courses on machine learning, predictive modeling, and data mining for those who require deeper analytical skills.

Developing Critical Thinking Skills for Data Interpretation

Raw data alone doesn’t provide value; it’s the interpretation that matters. Employees need to develop critical thinking skills to effectively analyze and draw meaningful conclusions from data.

  • Data context: Teach employees to consider the broader context in which data is collected and used, including potential biases and limitations.
  • Statistical reasoning: Enhance understanding of statistical concepts to help employees distinguish between correlation and causation, and to recognize the significance of findings.
  • Hypothesis testing: Encourage employees to formulate hypotheses and use data to test and refine their assumptions.
  • Scenario analysis: Train staff to consider multiple interpretations of data and explore various scenarios before drawing conclusions.

Encouraging a Culture of Curiosity and Continuous Learning

A data-driven culture thrives on curiosity and a commitment to ongoing learning. Organizations should foster an environment that encourages employees to explore data and continuously expand their analytical skills.

  • Data exploration time: Allocate dedicated time for employees to explore datasets relevant to their work, encouraging them to uncover new insights.
  • Learning resources: Provide access to online courses, webinars, and industry conferences to keep employees updated on the latest data analysis trends and techniques.
  • Internal knowledge sharing: Organize regular “lunch and learn” sessions or internal workshops where employees can share their data analysis experiences and insights.
  • Data challenges: Host internal competitions or hackathons that challenge employees to solve real business problems using data.

Fostering Cross-Functional Collaboration to Share Data Insights

Data-driven insights become more powerful when shared across different departments and teams. Encouraging cross-functional collaboration can lead to more comprehensive and innovative solutions.

  • Interdepartmental data projects: Initiate projects that require collaboration between different teams, combining diverse datasets and perspectives.
  • Data visualization dashboards: Implement shared dashboards that allow teams to view and interact with data from various departments.
  • Regular insight-sharing meetings: Schedule cross-functional meetings where teams can present their data findings and discuss potential implications for other areas of the business.
  • Data ambassadors: Designate data champions within each department to facilitate the sharing of insights and best practices across the organization.

By investing in these aspects of analytical readiness, organizations empower their employees to make data-informed decisions confidently and effectively. This not only improves the quality of decision-making but also fosters a culture of innovation and continuous improvement. As employees become more proficient in working with data, they’re better equipped to identify opportunities, solve complex problems, and drive the organization forward in an increasingly data-centric business landscape.

Infrastructure Readiness: Enabling Seamless Data Operations

To support a data-driven culture, organizations must have the right technological infrastructure in place. This includes:

  • Implementing scalable hardware solutions
  • Adopting user-friendly software for data analysis and visualization
  • Ensuring robust cybersecurity measures to protect sensitive data
  • Providing adequate computing power for complex data processing
  • Build a clear and implementable qualification methodology around data solutions

With the right infrastructure, employees can work with data efficiently and securely, regardless of their role or department.

The Path to a Data-Driven Culture

Building a data-driven culture is an ongoing process that requires commitment from leadership and active participation from all employees. Here are some key steps to consider:

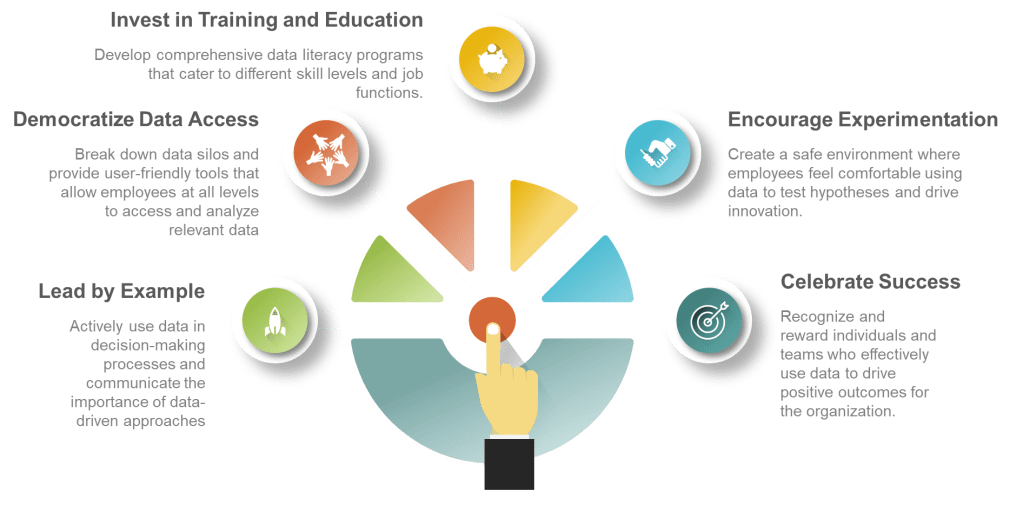
  1. Lead by example: Executives should actively use data in their decision-making processes and communicate the importance of data-driven approaches.
  2. Democratize data access: Break down data silos and provide user-friendly tools that allow employees at all levels to access and analyze relevant data.
  3. Invest in training and education: Develop comprehensive data literacy programs that cater to different skill levels and job functions.
  4. Encourage experimentation: Create a safe environment where employees feel comfortable using data to test hypotheses and drive innovation.
  5. Celebrate data-driven successes: Recognize and reward individuals and teams who effectively use data to drive positive outcomes for the organization.

Conclusion

To build a truly data-driven culture, leaders must take everyone along on the journey. By focusing on data readiness, analytical readiness, and infrastructure readiness, organizations can empower their employees to harness the full potential of data. This holistic approach not only improves decision-making but also fosters innovation, drives efficiency, and ultimately leads to better business outcomes.

Remember, building a data-driven culture is not a one-time effort but a continuous process of improvement and adaptation. By consistently investing in these three areas of readiness, organizations can create a sustainable competitive advantage in today’s data-centric business landscape.

Data and a Good Data Culture

I often joke that as a biotech company employee I am primarily responsible for the manufacture of data (and water) first and foremost, and as a result we get a byproduct of a pharmaceutical drugs.

Many of us face challenges within organizations when it comes to effectively managing data. There tends to be a prevailing mindset that views data handling as a distinct activity, often relegated to the responsibility of someone else, rather than recognizing it as an integral part of everyone’s role. This separation can lead to misunderstandings and missed opportunities for utilizing data to its fullest potential.

Many organizations suffer some multifaceted challenges around data management:

  1. Lack of ownership: When data is seen as “someone else’s job,” it often falls through the cracks.
  2. Inconsistent quality: Without a unified approach, data quality can vary widely across departments.
  3. Missed insights: Siloed data management can result in missed opportunities for valuable insights.
  4. Inefficient processes: Disconnected data handling often leads to duplicated efforts and wasted resources.

Integrate Data into Daily Work

  1. Make data part of job descriptions: Clearly define data-related responsibilities for each role, emphasizing how data contributes to overall job performance.
  2. Provide context: Help employees understand how their data-related tasks directly impact business outcomes and decision-making processes.
  3. Encourage data-driven decision making: Train employees to use data in their daily work, from small decisions to larger strategic choices.

We want to strive to ask four questions.

  1. UnderstandingDo people understand that they are data creators and how the data they create fits into the bigger picture?
  2. Empowerment: Are there mechanisms for people to voice concerns, suggest potential improvements, and make changes? Do you provide psychological safety so they do so without fear?
  3. AccountabilityDo people feel pride of ownership and take on responsibly to create, obtain, and put to work data that supports the organization’s mission?
  4. CollaborationDo people see themselves as customers of data others create, with the right and responsibility to explain what they need and help creators craft solutions for the good of all involved?

Foster a Data-Driven Culture

Fostering a data-driven culture is essential for organizations seeking to leverage the full potential of their data assets. This cultural shift requires a multi-faceted approach that starts at the top and permeates throughout the entire organization.

Leadership by example is crucial in establishing a data-driven culture. Managers and executives must actively incorporate data into their decision-making processes and discussions. By consistently referencing data in meetings, presentations, and communications, leaders demonstrate the value they place on data-driven insights. This behavior sets the tone for the entire organization, encouraging employees at all levels to adopt a similar approach. When leaders ask data-informed questions and base their decisions on factual evidence, it reinforces the importance of data literacy and analytical thinking across the company.

Continuous learning is another vital component of a data-driven culture. Organizations should invest in regular training sessions that enhance data literacy and proficiency with relevant analysis tools. These educational programs should be tailored to each role within the company, ensuring that employees can apply data skills directly to their specific responsibilities. By providing ongoing learning opportunities, companies empower their workforce to make informed decisions and contribute meaningfully to data-driven initiatives. This investment in employee development not only improves individual performance but also strengthens the organization’s overall analytical capabilities.

Creating effective feedback loops is essential for refining and improving data processes over time. Organizations should establish systems that allow employees to provide input on data-related practices and suggest enhancements. This two-way communication fosters a sense of ownership and engagement among staff, encouraging them to actively participate in the data-driven culture. By valuing employee feedback, companies can identify bottlenecks, streamline processes, and uncover innovative ways to utilize data more effectively. These feedback mechanisms also help in closing the loop between data insights and actionable outcomes, ensuring that the organization continually evolves its data practices to meet changing needs and challenges.

Build Data as a Core Principle

  1. Focus on quality: Emphasize the importance of data quality to the mission of the organization
  2. Continuous improvement: Encourage ongoing refinement of data processes,.
  3. Pride in workmanship: Foster a sense of ownership and pride in data-related tasks, .
  4. Break down barriers: Promote cross-departmental collaboration on data initiatives and eliminate silos.
  5. Drive out fear: Create a safe environment for employees to report data issues or inconsistencies without fear of reprisal.

By implementing these strategies, organizations can effectively tie data to employees’ daily work and create a robust data culture that enhances overall performance and decision-making capabilities.

Pillars of Good Data

One thing we should all agree with is that we need reliable reliable, accurate, and trustworthy data. Which is why we strive for the principles of data governance, data quality, and data integrity, three interconnected concepts that work together to create a robust data management framework.

Overarching Framework: Data Governance

Data governance serves as the overarching framework that establishes the policies, procedures, and standards for managing data within an organization. It provides the structure and guidance necessary for effective data management, including:

  • Defining roles and responsibilities for data management
  • Establishing data policies and standards
  • Creating processes for data handling and decision-making
  • Ensuring compliance with regulations and internal policies

Data governance sets the stage for both data quality and data integrity initiatives by providing the necessary organizational structure and guidelines.

Data Quality: Ensuring Fitness for Purpose

Within the data governance framework, data quality focuses on ensuring that data is fit for its intended use. This involves:

  • Assessing data against specific quality dimensions (e.g., accuracy, completeness, consistency, validity, timeliness)
  • Implementing data cleansing and standardization processes
  • Monitoring and measuring data quality metrics
  • Continuously improving data quality through feedback loops and corrective actions

Data quality initiatives are guided by the policies and standards set forth in the data governance framework, ensuring that quality efforts align with organizational goals and requirements.

Data Integrity: Maintaining Trustworthiness

Data integrity works in tandem with data quality to ensure that data remains accurate, complete, consistent, and reliable throughout its lifecycle. The ALCOA+ principles, widely used in regulated industries, provide a comprehensive framework for ensuring data integrity.

ALCOA+ Principles

Attributable: Ensuring that data can be traced back to its origin and the individual responsible for its creation or modification.

Legible: Maintaining data in a clear, readable format that is easily understandable.

Contemporaneous: Recording data at the time of the event or observation to ensure accuracy and prevent reliance on memory.

Original: Preserving the original record or a certified true copy to maintain data authenticity.

Accurate: Ensuring data correctness and freedom from errors.

Complete: Capturing all necessary information without omissions.

Consistent: Maintaining data coherence across different systems and over time.

Enduring: Preserving data for the required retention period in a format that remains accessible.

Available: Ensuring data is readily accessible when needed for review or inspection.

Additional Data Integrity Measures

Security Measures: Implementing robust security protocols to protect data from unauthorized access, modification, or deletion.

Data Lineage Tracking: Establishing systems to monitor and document data transformations and origins throughout its lifecycle.

Auditability: Ensuring data changes are traceable through comprehensive logging and change management processes.

Data Consistency: Maintaining uniformity of data across various systems and databases.

Data integrity measures are often defined and enforced through data governance policies, while also supporting data quality objectives by preserving the accuracy and reliability of data. By adhering to the ALCOA+ principles and implementing additional integrity measures, organizations can ensure their data remains trustworthy and compliant with regulatory requirements.

Synergy in Action

The collaboration between these three elements can be illustrated through a practical example:

  1. Data Governance Framework: An organization establishes a data governance committee that defines policies for GxP data management, including data quality standards and security requirements.
  2. Data Quality Initiative: Based on the governance policies, the organization implements data quality checks to ensure GxP information is accurate, complete, and up-to-date. This includes:
    • Regular data profiling to identify quality issues
    • Data cleansing processes to correct errors
    • Validation rules to prevent the entry of incorrect data
  3. Data Integrity Measures: To maintain the trustworthiness of GxP data, the organization:
    • Implements access controls to prevent unauthorized modifications
    • Qualifies system to meet ALCOA+ requirements
    • Establishes audit trails to track changes to GxP records

By working together, these elements ensure that:

  • GxP data meets quality standards (data quality)
  • The data remains has a secure and unaltered lineage (data integrity)
  • All processes align with organizational policies and regulatory requirements (data governance)

Continuous Improvement Cycle

The relationship between data governance, quality, and integrity is not static but forms a continuous improvement cycle:

  1. Data governance policies inform data quality and integrity standards.
  2. Data quality assessments and integrity checks provide feedback on the effectiveness of governance policies.
  3. This feedback is used to refine and improve governance policies, which in turn enhance data quality and integrity practices.

This ongoing cycle ensures that an organization’s data management practices evolve to meet changing business needs and technological advancements.

Data governance, data quality, and data integrity work together as a cohesive system to ensure that an organization’s data is not only accurate and reliable but also properly managed, protected, and utilized in alignment with business objectives and regulatory requirements. This integrated approach is essential for organizations seeking to maximize the value of their data assets while minimizing risks associated with poor data management.

A GMP Application based on ISA S88.01

A great example of Data governance is applying ISA S88.01 to enhance batch control processes and improve overall manufacturing operations.

Data Standardization and Structure

ISA S88.01 provides a standardized framework for batch control, including models and terminology that define the physical, procedural, and recipe aspects of batch manufacturing. This standardization directly supports data governance efforts by:

  • Establishing a common language for batch processes across the organization
  • Defining consistent data structures and hierarchies
  • Facilitating clear communication between different departments and systems

Improved Data Quality

By following the ISA S88.01 standard, organizations can ensure higher data quality throughout the batch manufacturing process:

  • Consistent Data Collection: The standard defines specific data points to be collected at each stage of the batch process, ensuring comprehensive and uniform data capture.
  • Traceability: ISA S88.01 enables detailed tracking of each phase of the batch process, including raw materials used, process parameters, and quality data.
  • Data Integrity: The structured approach helps maintain data integrity by clearly defining data sources, formats, and relationships.

Enhanced Data Management

The ISA S88.01 model supports effective data management practices:

  • Modular Approach: The standard’s modular structure allows for easier management of data related to specific equipment, procedures, or recipes.
  • Scalability: As processes or equipment change, the modular nature of ISA S88.01 facilitates easier updates to data structures and governance policies.
  • Data Lifecycle Management: The standard’s clear delineation of process stages aids in managing data throughout its lifecycle, from creation to archival.

Regulatory Compliance

ISA S88.01 supports data governance efforts related to regulatory compliance:

  • Audit Trails: The standard’s emphasis on traceability aligns with regulatory requirements for maintaining detailed records of batch processes.
  • Consistent Documentation: Standardized terminology and structures facilitate the creation of consistent, compliant documentation.

Decision Support and Analytics

The structured data approach of ISA S88.01 enhances data governance initiatives aimed at improving decision-making:

  • Data Integration: The standard facilitates easier integration of batch data with other enterprise systems, supporting comprehensive analytics.
  • Performance Monitoring: Standardized data structures enable more effective monitoring and comparison of batch processes across different units or sites.

Continuous Improvement

Both data governance and ISA S88.01 support continuous improvement efforts:

  • Process Optimization: The structured data from ISA S88.01 compliant systems can be more easily analyzed to identify areas for process improvement.
  • Knowledge Management: The standard terminology and models facilitate better knowledge sharing and retention within the organization.

By leveraging ISA S88.01 in conjunction with robust data governance practices, organizations can create a powerful framework for managing batch processes, ensuring data quality, and driving operational excellence in manufacturing environments.

Data Quality, Data Bias, and the Risk Assessment

I’ve seen my fair share of risk assessments listing data quality or bias as hazards. I tend to think that is pretty sloppy. I especially see this a lot in conversations around AI/ML. Data quality is not a risk. It is a causal factor in the failure or severity.

Data Quality and Data Bias

Data Quality

Data quality refers to how well a dataset meets certain criteria that make it fit for its intended use. The key dimensions of data quality include:

  1. Accuracy – The data correctly represents the real-world entities or events it’s supposed to describe.
  2. Completeness – The dataset contains all the necessary information without missing values.
  3. Consistency – The data is uniform and coherent across different systems or datasets.
  4. Timeliness – The data is up-to-date and available when needed.
  5. Validity – The data conforms to defined business rules and parameters.
  6. Uniqueness – There are no duplicate records in the dataset.

High-quality data is crucial for making informed quality decisions, conducting accurate analyses, and developing reliable AI/ML models. Poor data quality can lead to operational issues, inaccurate insights, and flawed strategies.

Data Bias

Data bias refers to systematic errors or prejudices present in the data that can lead to inaccurate or unfair outcomes, especially in machine learning and AI applications. Some common types of data bias include:

  1. Sampling bias – When the data sample doesn’t accurately represent the entire population.
  2. Selection bias – When certain groups are over- or under-represented in the dataset.
  3. Reporting bias – When the frequency of events in the data doesn’t reflect real-world frequencies.
  4. Measurement bias – When the data collection method systematically skews the results.
  5. Algorithmic bias – When the algorithms or models introduce biases in the results.

Data bias can lead to discriminatory outcomes and produce inaccurate predictions or classifications.

Relationship between Data Quality and Bias

While data quality and bias are distinct concepts, they are closely related:

  • Poor data quality can introduce or exacerbate biases. For example, incomplete or inaccurate data may disproportionately affect certain groups.
  • High-quality data doesn’t necessarily mean unbiased data. A dataset can be accurate, complete, and consistent but still contain inherent biases.
  • Addressing data bias often involves improving certain aspects of data quality, such as completeness and representativeness.

Organizations must implement robust data governance practices to ensure high-quality and unbiased data, regularly assess their data for quality issues and potential biases, and use techniques like data cleansing, resampling, and algorithmic debiasing.

Identifying the Hazards and the Risks

It is critical to remember the difference between a hazard and a risk. Data quality is a causal factor in the hazard, not a harm.

Hazard Identification

Think of it like a fever. An open wound is a causal factor for the fever, which has a root cause of poor wound hygiene. I can have the factor (the wound), but without the presence of the root cause (poor wound hygiene), the event (fever) would not develop (okay, there may be other root causes in play as well; remember there is never really just one root cause).

Potential Issues of Poor Data Quality and Inadequate Data Governance

The risks associated with poor data quality and inadequate data governance can significantly impact organizations. Here are the key areas where risks can develop:

Decreased Data Quality

  • Inaccurate, incomplete, or inconsistent data leads to flawed decision-making
  • Errors in customer information, product details, or financial data can cause operational issues
  • Poor quality data hinders effective analysis and forecasting

Compliance Failures:

  • Non-compliance with regulations can result in regulatory actions
  • Legal complications and reputational damage from failing to meet regulatory requirements
  • Increased scrutiny from regulatory bodies

Security Breaches

  • Inadequate data protection increases vulnerability to cyberattacks and data breaches
  • Financial costs associated with breach remediation, legal fees, and potential fines
  • Loss of customer trust and long-term reputational damage

Operational Inefficiencies

  • Time wasted on manual data cleaning and correction
  • Reduced productivity due to employees working with unreliable data
  • Inefficient processes resulting from poor data integration or inconsistent data formats

Missed Opportunities

  • Failure to identify market trends or customer insights due to unreliable data
  • Missed sales leads or potential customers because of inaccurate contact information
  • Inability to capitalize on business opportunities due to lack of trustworthy data

Poor Decision-Making

  • Decisions based on inaccurate or incomplete data leading to suboptimal outcomes, including deviations and product/study impact
  • Misallocation of resources due to flawed insights from poor quality data
  • Inability to effectively measure and improve performance

Potential Issues of Data Bias

Data bias presents significant risks across various domains, particularly when integrated into machine learning (ML) and artificial intelligence (AI) systems. These risks can manifest in several ways, impacting both individuals and organizations.

Discrimination and Inequality

Data bias can lead to discriminatory outcomes, systematically disadvantaging certain groups based on race, gender, age, or socioeconomic status. For example:

  • Judicial Systems: Biased algorithms used in risk assessments for bail and sentencing can result in harsher penalties for people of color compared to their white counterparts, even when controlling for similar circumstances.
  • Healthcare: AI systems trained on biased medical data may provide suboptimal care recommendations for minority groups, potentially exacerbating health disparities.

Erosion of Trust and Reputation

Organizations that rely on biased data for decision-making risk losing the trust of their customers and stakeholders. This can have severe reputational consequences:

  • Customer Trust: If customers perceive that an organization’s AI systems are biased, they may lose trust in the brand, leading to a decline in customer loyalty and revenue.
  • Reputation Damage: High-profile cases of AI bias, such as discriminatory hiring practices or unfair loan approvals, can attract negative media attention and public backlash.

Legal and Regulatory Risks

There are significant legal and regulatory risks associated with data bias:

  • Compliance Issues: Organizations may face legal challenges and fines if their AI systems violate anti-discrimination laws.
  • Regulatory Scrutiny: Increasing awareness of AI bias has led to calls for stricter regulations to ensure fairness and accountability in AI systems.

Poor Decision-Making

Biased data can lead to erroneous decisions that negatively impact business operations:

  • Operational Inefficiencies: AI models trained on biased data may make poor predictions, leading to inefficient resource allocation and operational mishaps.
  • Financial Losses: Incorrect decisions based on biased data can result in financial losses, such as extending credit to high-risk individuals or mismanaging inventory.

Amplification of Existing Biases

AI systems can perpetuate and even amplify existing biases if not properly managed:

  • Feedback Loops: Biased AI systems can create feedback loops where biased outcomes reinforce the biased data, leading to increasingly skewed results over time.
  • Entrenched Inequities: Over time, biased AI systems can entrench societal inequities, making it harder to address underlying issues of discrimination and inequality.

Ethical and Moral Implications

The ethical implications of data bias are profound:

  • Fairness and Justice: Biased AI systems challenge the principles of fairness and justice, raising moral questions about using such technologies in critical decision-making processes.
  • Human Rights: There are concerns that biased AI systems could infringe on human rights, particularly in areas like surveillance, law enforcement, and social services.

Perform the Risk Assessment

ICH Q9 (r1) Risk Management Process

Risk Management happens at the system/process level, where an AI/ML solution will be used. As appropriate, it drills down to the technology level. Never start with the technology level.

Hazard Identification

It is important to identify product quality hazards that may ultimately lead to patient harm. What is the hazard of that bad decision? What is the hazard of bad quality data? Those are not hazards; they are causes.

Hazard identification, the first step of a risk assessment, begins with a well-defined question defining why the risk assessment is being performed. It helps define the system and the appropriate scope of what will be studied. It addresses the “What might go wrong?” question, including identifying the possible consequences of hazards. The output of the hazard identification step is the identification of the possibilities (i.e., hazards) that the risk event (e.g., impact to product quality) happens.

The risk question takes the form of “What is the risk of using AI/ML solution for <Process/System> to <purpose of AI/MIL solution.” For example, “What is the risk of using AI/ML to identify deviation recurrence and help prioritize CAPAs?” or “What is the risk of using AI/ML to monitor real-time continuous manufacturing to determine the need to evaluate for a potential diversion?”

Process maps, data maps, and knowledge maps are critical here.

We can now identify the specific failure modes associated with AI/ML. This may involve deeep dive risk assessments. A failure mode is the specific way a failure occurs. So in this case, the specific way that bad data or bad decision making can happen. Multiple failure modes can, and usually do, lead to the same hazardous situation.

Make sure you drill down on failure causes. If more than 5 potential causes can be identified for a proposed failure mode, it is too broad and probably written at a high level in the process or item being risk assessed. It should be broken down into several specific failure modes with fewer potential causes and more manageable.

Start with an outline of how the process works and a description of the AI/ML (special technology) used in the process. Then, interrogate the following for potential failure modes:

  • The steps in the process or item under study in which AI/ML interventions occur;
  • The process/procedure documentation for example, master batch records, SOPs, protocols, etc.
    • Current and proposed process/procedure in sufficient detail to facilitate failure mode identification;
  • Critical Process Controls

Risk Based Data Integrity Assessment

A quick overview. The risk-based approach will utilize three factors, data criticality, existing controls, and level of detection.

When assessing current controls, technical controls (properly implemented) are stronger than operational or organizational controls as they can eliminate the potential for data falsification or human error rather than simply reducing/detecting it. 

For criticality, it helps to build a table based on what the data is used for. For example:

For controls, use a table like the one below. Rank each column and then multiply the numbers together to get a final control ranking.  For example, if a process has Esign (1), no access control (3), and paper archival (2) then the control ranking would be 6 (1 x 3 x 2). 

Determine detectibility on the table below, rank each column and then multiply the numbers together to get a final detectability ranking. 

Another way to look at these scores:

Multiple above to determine a risk ranking and move ahead with mitigations. Mitigations should be to drive risk as low as possible, though the following table can be used to help determine priority.

Risk Rating Action Mitigation
>25 High Risk-Potential Impact to Patient Safety or Product Quality Mandatory
12-25 Moderate Risk-No Impact to Patient Safety or Product Quality but Potential Regulatory Risk Recommended
<12 Negligible DI Risk Not Required

In the case of long-term risk remediation actions, risk reducing short-term actions shall be implemented to reduce risk and provide an acceptable level of governance until the long-term remediation actions are completed.

Relevant site procedures (e.g., change control, validation policy) should outline the scope of additional testing through the change management process.

Reassessment of the system may be completed following the completion of remediation activities. The reassessment may be done at any time during the remediation process to document the impact of the remediation actions.

Once final remediation is complete, a reassessment of the equipment/system should be completed to demonstrate that the risk rating has been mitigated by the remediation actions taken. Think living risk assessment.