Pillars of Good Data

One thing we should all agree with is that we need reliable reliable, accurate, and trustworthy data. Which is why we strive for the principles of data governance, data quality, and data integrity, three interconnected concepts that work together to create a robust data management framework.

Overarching Framework: Data Governance

Data governance serves as the overarching framework that establishes the policies, procedures, and standards for managing data within an organization. It provides the structure and guidance necessary for effective data management, including:

  • Defining roles and responsibilities for data management
  • Establishing data policies and standards
  • Creating processes for data handling and decision-making
  • Ensuring compliance with regulations and internal policies

Data governance sets the stage for both data quality and data integrity initiatives by providing the necessary organizational structure and guidelines.

Data Quality: Ensuring Fitness for Purpose

Within the data governance framework, data quality focuses on ensuring that data is fit for its intended use. This involves:

  • Assessing data against specific quality dimensions (e.g., accuracy, completeness, consistency, validity, timeliness)
  • Implementing data cleansing and standardization processes
  • Monitoring and measuring data quality metrics
  • Continuously improving data quality through feedback loops and corrective actions

Data quality initiatives are guided by the policies and standards set forth in the data governance framework, ensuring that quality efforts align with organizational goals and requirements.

Data Integrity: Maintaining Trustworthiness

Data integrity works in tandem with data quality to ensure that data remains accurate, complete, consistent, and reliable throughout its lifecycle. The ALCOA+ principles, widely used in regulated industries, provide a comprehensive framework for ensuring data integrity.

ALCOA+ Principles

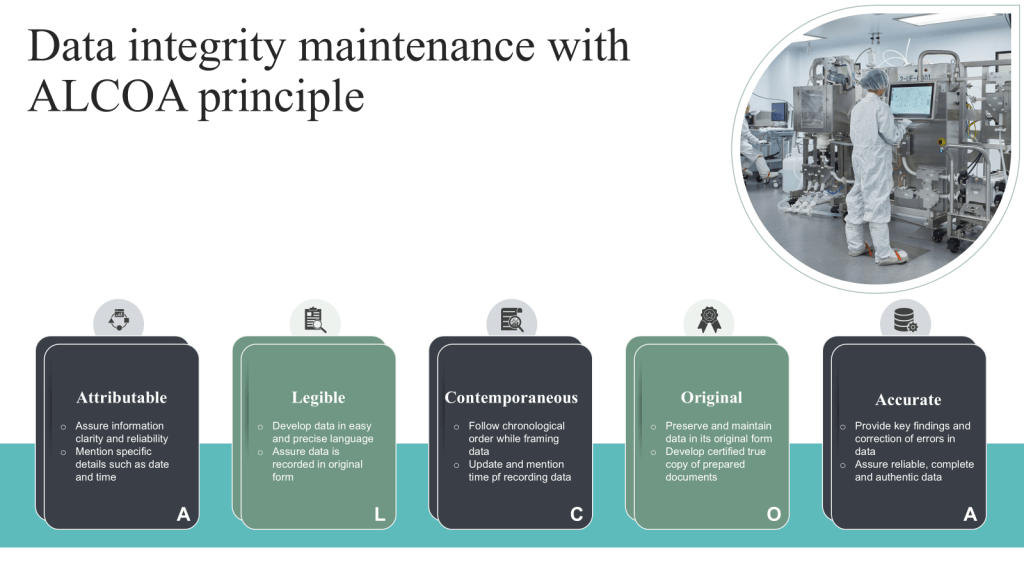
Attributable: Ensuring that data can be traced back to its origin and the individual responsible for its creation or modification.

Legible: Maintaining data in a clear, readable format that is easily understandable.

Contemporaneous: Recording data at the time of the event or observation to ensure accuracy and prevent reliance on memory.

Original: Preserving the original record or a certified true copy to maintain data authenticity.

Accurate: Ensuring data correctness and freedom from errors.

Complete: Capturing all necessary information without omissions.

Consistent: Maintaining data coherence across different systems and over time.

Enduring: Preserving data for the required retention period in a format that remains accessible.

Available: Ensuring data is readily accessible when needed for review or inspection.

Additional Data Integrity Measures

Security Measures: Implementing robust security protocols to protect data from unauthorized access, modification, or deletion.

Data Lineage Tracking: Establishing systems to monitor and document data transformations and origins throughout its lifecycle.

Auditability: Ensuring data changes are traceable through comprehensive logging and change management processes.

Data Consistency: Maintaining uniformity of data across various systems and databases.

Data integrity measures are often defined and enforced through data governance policies, while also supporting data quality objectives by preserving the accuracy and reliability of data. By adhering to the ALCOA+ principles and implementing additional integrity measures, organizations can ensure their data remains trustworthy and compliant with regulatory requirements.

Synergy in Action

The collaboration between these three elements can be illustrated through a practical example:

  1. Data Governance Framework: An organization establishes a data governance committee that defines policies for GxP data management, including data quality standards and security requirements.
  2. Data Quality Initiative: Based on the governance policies, the organization implements data quality checks to ensure GxP information is accurate, complete, and up-to-date. This includes:
    • Regular data profiling to identify quality issues
    • Data cleansing processes to correct errors
    • Validation rules to prevent the entry of incorrect data
  3. Data Integrity Measures: To maintain the trustworthiness of GxP data, the organization:
    • Implements access controls to prevent unauthorized modifications
    • Qualifies system to meet ALCOA+ requirements
    • Establishes audit trails to track changes to GxP records

By working together, these elements ensure that:

  • GxP data meets quality standards (data quality)
  • The data remains has a secure and unaltered lineage (data integrity)
  • All processes align with organizational policies and regulatory requirements (data governance)

Continuous Improvement Cycle

The relationship between data governance, quality, and integrity is not static but forms a continuous improvement cycle:

  1. Data governance policies inform data quality and integrity standards.
  2. Data quality assessments and integrity checks provide feedback on the effectiveness of governance policies.
  3. This feedback is used to refine and improve governance policies, which in turn enhance data quality and integrity practices.

This ongoing cycle ensures that an organization’s data management practices evolve to meet changing business needs and technological advancements.

Data governance, data quality, and data integrity work together as a cohesive system to ensure that an organization’s data is not only accurate and reliable but also properly managed, protected, and utilized in alignment with business objectives and regulatory requirements. This integrated approach is essential for organizations seeking to maximize the value of their data assets while minimizing risks associated with poor data management.

A GMP Application based on ISA S88.01

A great example of Data governance is applying ISA S88.01 to enhance batch control processes and improve overall manufacturing operations.

Data Standardization and Structure

ISA S88.01 provides a standardized framework for batch control, including models and terminology that define the physical, procedural, and recipe aspects of batch manufacturing. This standardization directly supports data governance efforts by:

  • Establishing a common language for batch processes across the organization
  • Defining consistent data structures and hierarchies
  • Facilitating clear communication between different departments and systems

Improved Data Quality

By following the ISA S88.01 standard, organizations can ensure higher data quality throughout the batch manufacturing process:

  • Consistent Data Collection: The standard defines specific data points to be collected at each stage of the batch process, ensuring comprehensive and uniform data capture.
  • Traceability: ISA S88.01 enables detailed tracking of each phase of the batch process, including raw materials used, process parameters, and quality data.
  • Data Integrity: The structured approach helps maintain data integrity by clearly defining data sources, formats, and relationships.

Enhanced Data Management

The ISA S88.01 model supports effective data management practices:

  • Modular Approach: The standard’s modular structure allows for easier management of data related to specific equipment, procedures, or recipes.
  • Scalability: As processes or equipment change, the modular nature of ISA S88.01 facilitates easier updates to data structures and governance policies.
  • Data Lifecycle Management: The standard’s clear delineation of process stages aids in managing data throughout its lifecycle, from creation to archival.

Regulatory Compliance

ISA S88.01 supports data governance efforts related to regulatory compliance:

  • Audit Trails: The standard’s emphasis on traceability aligns with regulatory requirements for maintaining detailed records of batch processes.
  • Consistent Documentation: Standardized terminology and structures facilitate the creation of consistent, compliant documentation.

Decision Support and Analytics

The structured data approach of ISA S88.01 enhances data governance initiatives aimed at improving decision-making:

  • Data Integration: The standard facilitates easier integration of batch data with other enterprise systems, supporting comprehensive analytics.
  • Performance Monitoring: Standardized data structures enable more effective monitoring and comparison of batch processes across different units or sites.

Continuous Improvement

Both data governance and ISA S88.01 support continuous improvement efforts:

  • Process Optimization: The structured data from ISA S88.01 compliant systems can be more easily analyzed to identify areas for process improvement.
  • Knowledge Management: The standard terminology and models facilitate better knowledge sharing and retention within the organization.

By leveraging ISA S88.01 in conjunction with robust data governance practices, organizations can create a powerful framework for managing batch processes, ensuring data quality, and driving operational excellence in manufacturing environments.

Data Quality, Data Bias, and the Risk Assessment

I’ve seen my fair share of risk assessments listing data quality or bias as hazards. I tend to think that is pretty sloppy. I especially see this a lot in conversations around AI/ML. Data quality is not a risk. It is a causal factor in the failure or severity.

Data Quality and Data Bias

Data Quality

Data quality refers to how well a dataset meets certain criteria that make it fit for its intended use. The key dimensions of data quality include:

  1. Accuracy – The data correctly represents the real-world entities or events it’s supposed to describe.
  2. Completeness – The dataset contains all the necessary information without missing values.
  3. Consistency – The data is uniform and coherent across different systems or datasets.
  4. Timeliness – The data is up-to-date and available when needed.
  5. Validity – The data conforms to defined business rules and parameters.
  6. Uniqueness – There are no duplicate records in the dataset.

High-quality data is crucial for making informed quality decisions, conducting accurate analyses, and developing reliable AI/ML models. Poor data quality can lead to operational issues, inaccurate insights, and flawed strategies.

Data Bias

Data bias refers to systematic errors or prejudices present in the data that can lead to inaccurate or unfair outcomes, especially in machine learning and AI applications. Some common types of data bias include:

  1. Sampling bias – When the data sample doesn’t accurately represent the entire population.
  2. Selection bias – When certain groups are over- or under-represented in the dataset.
  3. Reporting bias – When the frequency of events in the data doesn’t reflect real-world frequencies.
  4. Measurement bias – When the data collection method systematically skews the results.
  5. Algorithmic bias – When the algorithms or models introduce biases in the results.

Data bias can lead to discriminatory outcomes and produce inaccurate predictions or classifications.

Relationship between Data Quality and Bias

While data quality and bias are distinct concepts, they are closely related:

  • Poor data quality can introduce or exacerbate biases. For example, incomplete or inaccurate data may disproportionately affect certain groups.
  • High-quality data doesn’t necessarily mean unbiased data. A dataset can be accurate, complete, and consistent but still contain inherent biases.
  • Addressing data bias often involves improving certain aspects of data quality, such as completeness and representativeness.

Organizations must implement robust data governance practices to ensure high-quality and unbiased data, regularly assess their data for quality issues and potential biases, and use techniques like data cleansing, resampling, and algorithmic debiasing.

Identifying the Hazards and the Risks

It is critical to remember the difference between a hazard and a risk. Data quality is a causal factor in the hazard, not a harm.

Hazard Identification

Think of it like a fever. An open wound is a causal factor for the fever, which has a root cause of poor wound hygiene. I can have the factor (the wound), but without the presence of the root cause (poor wound hygiene), the event (fever) would not develop (okay, there may be other root causes in play as well; remember there is never really just one root cause).

Potential Issues of Poor Data Quality and Inadequate Data Governance

The risks associated with poor data quality and inadequate data governance can significantly impact organizations. Here are the key areas where risks can develop:

Decreased Data Quality

  • Inaccurate, incomplete, or inconsistent data leads to flawed decision-making
  • Errors in customer information, product details, or financial data can cause operational issues
  • Poor quality data hinders effective analysis and forecasting

Compliance Failures:

  • Non-compliance with regulations can result in regulatory actions
  • Legal complications and reputational damage from failing to meet regulatory requirements
  • Increased scrutiny from regulatory bodies

Security Breaches

  • Inadequate data protection increases vulnerability to cyberattacks and data breaches
  • Financial costs associated with breach remediation, legal fees, and potential fines
  • Loss of customer trust and long-term reputational damage

Operational Inefficiencies

  • Time wasted on manual data cleaning and correction
  • Reduced productivity due to employees working with unreliable data
  • Inefficient processes resulting from poor data integration or inconsistent data formats

Missed Opportunities

  • Failure to identify market trends or customer insights due to unreliable data
  • Missed sales leads or potential customers because of inaccurate contact information
  • Inability to capitalize on business opportunities due to lack of trustworthy data

Poor Decision-Making

  • Decisions based on inaccurate or incomplete data leading to suboptimal outcomes, including deviations and product/study impact
  • Misallocation of resources due to flawed insights from poor quality data
  • Inability to effectively measure and improve performance

Potential Issues of Data Bias

Data bias presents significant risks across various domains, particularly when integrated into machine learning (ML) and artificial intelligence (AI) systems. These risks can manifest in several ways, impacting both individuals and organizations.

Discrimination and Inequality

Data bias can lead to discriminatory outcomes, systematically disadvantaging certain groups based on race, gender, age, or socioeconomic status. For example:

  • Judicial Systems: Biased algorithms used in risk assessments for bail and sentencing can result in harsher penalties for people of color compared to their white counterparts, even when controlling for similar circumstances.
  • Healthcare: AI systems trained on biased medical data may provide suboptimal care recommendations for minority groups, potentially exacerbating health disparities.

Erosion of Trust and Reputation

Organizations that rely on biased data for decision-making risk losing the trust of their customers and stakeholders. This can have severe reputational consequences:

  • Customer Trust: If customers perceive that an organization’s AI systems are biased, they may lose trust in the brand, leading to a decline in customer loyalty and revenue.
  • Reputation Damage: High-profile cases of AI bias, such as discriminatory hiring practices or unfair loan approvals, can attract negative media attention and public backlash.

Legal and Regulatory Risks

There are significant legal and regulatory risks associated with data bias:

  • Compliance Issues: Organizations may face legal challenges and fines if their AI systems violate anti-discrimination laws.
  • Regulatory Scrutiny: Increasing awareness of AI bias has led to calls for stricter regulations to ensure fairness and accountability in AI systems.

Poor Decision-Making

Biased data can lead to erroneous decisions that negatively impact business operations:

  • Operational Inefficiencies: AI models trained on biased data may make poor predictions, leading to inefficient resource allocation and operational mishaps.
  • Financial Losses: Incorrect decisions based on biased data can result in financial losses, such as extending credit to high-risk individuals or mismanaging inventory.

Amplification of Existing Biases

AI systems can perpetuate and even amplify existing biases if not properly managed:

  • Feedback Loops: Biased AI systems can create feedback loops where biased outcomes reinforce the biased data, leading to increasingly skewed results over time.
  • Entrenched Inequities: Over time, biased AI systems can entrench societal inequities, making it harder to address underlying issues of discrimination and inequality.

Ethical and Moral Implications

The ethical implications of data bias are profound:

  • Fairness and Justice: Biased AI systems challenge the principles of fairness and justice, raising moral questions about using such technologies in critical decision-making processes.
  • Human Rights: There are concerns that biased AI systems could infringe on human rights, particularly in areas like surveillance, law enforcement, and social services.

Perform the Risk Assessment

ICH Q9 (r1) Risk Management Process

Risk Management happens at the system/process level, where an AI/ML solution will be used. As appropriate, it drills down to the technology level. Never start with the technology level.

Hazard Identification

It is important to identify product quality hazards that may ultimately lead to patient harm. What is the hazard of that bad decision? What is the hazard of bad quality data? Those are not hazards; they are causes.

Hazard identification, the first step of a risk assessment, begins with a well-defined question defining why the risk assessment is being performed. It helps define the system and the appropriate scope of what will be studied. It addresses the “What might go wrong?” question, including identifying the possible consequences of hazards. The output of the hazard identification step is the identification of the possibilities (i.e., hazards) that the risk event (e.g., impact to product quality) happens.

The risk question takes the form of “What is the risk of using AI/ML solution for <Process/System> to <purpose of AI/MIL solution.” For example, “What is the risk of using AI/ML to identify deviation recurrence and help prioritize CAPAs?” or “What is the risk of using AI/ML to monitor real-time continuous manufacturing to determine the need to evaluate for a potential diversion?”

Process maps, data maps, and knowledge maps are critical here.

We can now identify the specific failure modes associated with AI/ML. This may involve deeep dive risk assessments. A failure mode is the specific way a failure occurs. So in this case, the specific way that bad data or bad decision making can happen. Multiple failure modes can, and usually do, lead to the same hazardous situation.

Make sure you drill down on failure causes. If more than 5 potential causes can be identified for a proposed failure mode, it is too broad and probably written at a high level in the process or item being risk assessed. It should be broken down into several specific failure modes with fewer potential causes and more manageable.

Start with an outline of how the process works and a description of the AI/ML (special technology) used in the process. Then, interrogate the following for potential failure modes:

  • The steps in the process or item under study in which AI/ML interventions occur;
  • The process/procedure documentation for example, master batch records, SOPs, protocols, etc.
    • Current and proposed process/procedure in sufficient detail to facilitate failure mode identification;
  • Critical Process Controls

The Lack of Objectivity in Quality Management

ICH Q9(r1) can be reviewed as a revision that addresses long-standing issues of subjectivity in risk management. Subjectivity is a widespread problem throughout the quality sphere, posing significant challenges because it introduces personal biases, emotions, and opinions into decision-making processes that should ideally be driven by objective data and facts.

  • Inconsistent Decision-Making: Subjective decision-making can lead to inconsistencies because different individuals may have varying opinions and biases. This inconsistency can result in unpredictable outcomes and make it challenging to establish standardized processes. For example, one manager might prioritize customer satisfaction based on personal experiences, while another might focus on cost-cutting, leading to conflicting strategies within the same organization.
  • Bias and Emotional Influence: Subjectivity often involves emotional influence, which can cloud judgment and lead to decisions not in the organization’s best interest. For instance, a business owner might make decisions based on a personal attachment to a product or service rather than its market performance or profitability. This emotional bias can prevent the business from making necessary changes or investments, ultimately harming its growth and sustainability.
  • Risk Management Issues: In risk assessments, subjectivity can significantly impact the identification and evaluation of risks. Subjective assessments may overlook critical risks or overemphasize less significant ones, leading to inadequate risk management strategies. Objective, data-driven risk assessments are essential to accurately identify and mitigate potential threats to the business. See ICHQ9(r1).
  • Difficulty in Measuring Performance: Subjective criteria are often more complicated to quantify and measure, making it challenging to track performance and progress accurately. Objective metrics, such as key performance indicators (KPIs), provide clear, measurable data that can be used to assess the effectiveness of business processes and make informed decisions.
  • Potential for Misalignment: Subjective decision-making can lead to misalignment between business goals and outcomes. For example, if subjective opinions drive project management decisions, the project may deviate from its original scope, timeline, or budget, resulting in unmet objectives and dissatisfied stakeholders.
  • Impact on Team Dynamics: Subjectivity can also affect team dynamics and morale. Decisions perceived as biased or unfair can lead to dissatisfaction and conflict among team members. Objective decision-making, based on transparent criteria and data, helps build trust and ensures that all team members are aligned with the business’s goals.

Every organization I’ve been in has a huge problem with subjectivity, and I’m confident in asserting none of us are doing enough to deal with the lack of objectivity, and we mostly rely on our intuition instead of on objective guidelines that will create unambiguous, holistic, and
universally usable models.

Understand the Decisions We Make

Every day, we make many decisions, sometimes without even noticing it. These decisions fall into four categories:

  • Acceptances: It is a binary choice between accepting or rejecting;
  • Choices: Opting for a subset from a group of alternatives;
  • Constructions: Creating an ideal solution given accessible resources;
  • Evaluations: Here, commitments back up the statements of worth to act

These decisions can be simple or complex, with manifold criteria and several perspectives. Decision-making is the process of choosing an option among manifold alternatives.

The Fallacy of Expert Immunity is a Major Source of Subjectivity

There is a widely incorrect belief that experts are impartial and immune to biases. However, the truth is that no one is immune to bias, not even experts. In many ways, experts are more susceptible to certain biases. The very making of expertise creates and underpins many of the biases.  For example, experience and training make experts engage in more selective attention, use chunking and schemas (typical activities and their sequence), and rely on heuristics and expectations arising from past base rate experiences, utilizing a whole range of top-down cognitive processes that create a priori assumptions and expectations.

These cognitive processes often enable experts to make quick and accurate decisions. However, these mechanisms also create bias that can lead them in the wrong direction. Regardless of the utilities (and vulnerability) of such cognitive processing in experts, they do not make experts immune from bias, and indeed, expertise and experience may actually increase (or even cause) certain biases. Experts across domains are subject to cognitive vulnerabilities.

Even when experts are made aware of and acknowledge their biases, they nevertheless think they can overcome them by mere willpower. This is the illusion of control. Combating and countering these biases requires taking specific steps—willpower alone is inadequate to deal with the various manifestations of bias.

In fact, trying to deal with bias through the illusion of control may actually increase the bias due to “ironic processing” or “ironic rebound.” Hence, trying to minimize bias by willpower makes you think of it more and increases its effect. This is similar to a judge instructing jurors to disregard specific evidence. By doing so, the judge makes the jurors notice this evidence even more.

Such fallacies’ beliefs prevent dealing with biases because they dismiss their powers and existence. We need to acknowledge the impact of biases and understand their sources to take appropriate measures when needed and when possible to combat their effects.

FallacyIncorrect Belief
Ethical IssuesIt only happens to corrupt and unscrupulous individuals, an issue of morals and personal integrity, a question of personal character.
Bad ApplesIt only happens to corrupt and unscrupulous individuals. It is an issue of morals and personal integrity, a question of personal character.
Expert ImmunityExperts are impartial and are not affected because bias does not impact competent experts doing their job with integrity.
Technological ProtectionUsing technology, instrumentation, automation, or artificial intelligence guarantees protection from human biases.
Blind SpotOther experts are affected by bias, but not me. I am not biased; it is the other experts who are biased.
Illusion of ControlI am aware that bias impacts me, and therefore, I can control and counter its affect. I can overcome bias by mere willpower.
Six Fallacies that Increase Subjectivity

    Mitigating Subjectivity

    There are four basic strategies to mitigate the impact of subjectivity.

    Data-Driven Decision Making

    Utilize data and analytics to inform decisions, reducing reliance on personal opinions and biases.

    • Establish clear metrics with key performance indicators (KPI), key behavior indicators (KBI), and key risk indicators (KRI) that are aligned with objectives.
    • Implement robust data collection and analysis systems to gather relevant, high-quality data.
    • Use data visualization tools to present information in an easily digestible format.
    • Train employees on data literacy and interpretation to ensure proper use of data insights.
    • Regularly review and update data sources to maintain relevance and accuracy.

    Standardized Processes

    Implement standardized processes and procedures to ensure consistency and fairness in decision-making.

    • Document and formalize decision-making procedures across the organization.
    • Create standardized templates, checklists, and rubrics for evaluating options and making decisions.
    • Implement a consistent review and approval process for major decisions.
    • Regularly audit and update standardized processes to ensure they remain effective and relevant.

    Education, Training, and Awareness

    Educate and train employees and managers on the importance of objective decision-making and recognizing and minimizing personal biases.

    • Conduct regular training sessions on cognitive biases and their impact on decision-making.
    • Provide resources and tools to help employees recognize and mitigate their own biases.
    • Encourage a culture of open discussion and constructive challenge to promote diverse perspectives.
    • Implement mentoring programs to share knowledge and best practices for objective decision-making.

    Digital Tools

    Leverage digital tools and software to automate and streamline processes, reducing the potential for subjective influence. The last two is still more aspiration than reality.

    • Implement workflow management tools to ensure consistent application of standardized processes.
    • Use collaboration platforms to facilitate transparent and inclusive decision-making processes.
    • Adopt decision support systems that use algorithms and machine learning to provide recommendations based on data analysis.
    • Leverage artificial intelligence and predictive analytics to identify patterns and trends that may not be apparent to human decision-makers.

    Quality Book Shelf – Data Story

    Every quality professional needs to read Data Story: Explain Data and Inspire Action through Story by Nancy Duarte.

    This book does an amazing job of giving you the tools of transforming a boring management review into a compelling narrative. Following the step-by-step recommendations will give you a blueprint for effective telling the story of your organizations quality maturity and help you execute into action.

    For example, this table is the start of an amazing section about crafting a narrative that then goes into an amazing discussion on structuring a slide presentation to get this done.

     Argumentative Writing (Logical Approach)Persuasive Writing (Emotional Appeal)Writing a Recommendation (Blend of Both)
    PurposeConstruct compelling evidence that your viewpoint is backed by the truth and is factualPersuade the audience to agree with your perspective and take action on your viewpointUse the data available, plus intuition, to form a point of view that requires action from your organization
    ApproachDeliver information from both sides of the issue by choosing one side as valid and causing others to doubt the counterclaimDeliver information and opinions on only one side of the issue, and develop a strong connection with a target audienceDevelop a story supported by evidence ad also include any counterarguments your audience may have, so tat they feel you have considered their perspective
    AppealsUse logical appears to support claims with solid examples, expert opinions, data, and facts. The goal is to be right, not necessarily take actionUse emotional appeals to convince others of your opinion and feelings, so the audience will move forward on your perspectiveStructure the appeal as a story, support your recommendation with data and solid evidence that sticks by adding meaning
    ToneProfessional, tactful, logicalPersonal, passionate, emotionalAppropriate tone based on the audience

    Another great takeaway is when Nancy presents results of her extensive analysis on word patterns in speeches, right down to the choice of effective verbs, conjunctions, adjectives, adverbs, interjections, and rhetorical questions. The choice of “process or performance verbs” is connected to whether the recommended course of action is continuity, change or termination.

    This is a book that keeps giving.

    I found it so invaluable that I bought a copy for everyone on my team.

    Data Process Mapping

    In a presentation on practical applications of data integrity for laboratories at the March 2019 MHRA Laboratories Symposium held in London, UK, MHRA Lead GCP and GLP Inspector Jason Wakelin-Smith highlighted the important role data process mapping plays in understanding these challenges and moving down the DI pathway.

    He pointed out that understanding of processes and systems, which data maps facilitate, is a key theme in MHRA’s GxP data integrity guidance, finalized in March of 2018. The guidance is intended to be broadly applicable across the regulated practices, but excluding the medical device arena, which is regulated in Europe by third-party notified bodies.

    IPQ. MHRA Inspectors are Advocating Data Mapping as a Key First Step on the Data Integrity Pilgrimage

    Data process maps look at the entire data life-cycle from creation through storage (covering key components of create, modify and delete) and include all operations with both paper and electronic records.   Data maps are cross-functional diagrams (swim-lanes) and have the following sections:

    • Prep/Input
    • Data Creation
    • Data Manipulation (include delete)
    • Data  Use
    • Data Storage

    Use a standard symbol for paper record, computer data and process step.

    For computer data denote (usually by color) the level of controls:

    • Fully aligned with Part 11 and Data Integrity guidances
    • Gaps in compliance but remediation plan in place (this includes places where paper is considered “true copy”
    • Not compliant, no remediation plan

    Data operations are depicted utilizing arrows.  The following data operations are probably most common, and are recommended for consistency:

    • Data Entry – input of process, meta data (e.g. lot ID, operator)
    • Data Store – archival location
    • Data Copy – transcription from another system or paper, transfer of data from one system to another, printing (Indicate if it is a manual process).
    • Data Edit – calculations, processing, reviews, unit changes  (Indicate if it is a manual process)
    • Data Move – movement of paper or electronic records

    Data operation arrows should denote (again by color) the current controls in place:

    • Technical Controls – Validated Automated Process
    • Operational Controls – Manual Process with Review/Verified/Witness Requirements
    • No Controls – Automated process that is not validated or Manual process with no Review/Verified/Witness Considerations
    Example data map