In today’s data-driven world, effectively communicating insights is crucial for driving informed decision-making. By combining the “What, So What, Now What” reflective model with data storytelling techniques, we can create compelling narratives that not only present findings but also inspire action. Let’s explore how to leverage this approach to organize recommendations from problem-solving or gap assessments.
The “What, So What, Now What” Framework
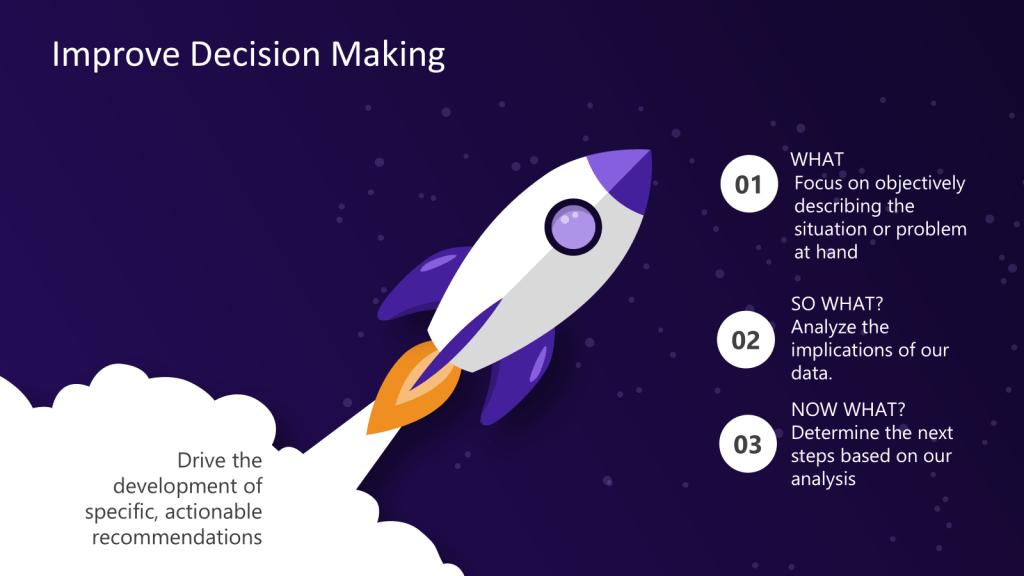
The “What, So What, Now What” model, originally developed by Terry Borton in the 1970s, provides a simple yet powerful structure for reflection and analysis.
What?
This stage focuses on objectively describing the situation or problem at hand. In data storytelling, this is where we present the raw facts and figures without interpretation. Frame the problem and provide the data.
So What?
Here, we analyze the implications of our data. This is the stage where we extract meaning from the numbers and identify patterns or trends. We provide the root cause analysis.
Now What?
Finally, we determine the next steps based on our analysis. This is where we formulate actionable recommendations and outline a path forward.
Integrating Data Storytelling
To effectively utilize this framework in data storytelling, we need to consider three key elements: data, visuals, and narrative. Let’s break down how to incorporate these elements into each stage of our “What, So What, Now What” approach.
What? – Setting the Scene
- Present the Data: Start by clearly presenting the relevant data points. Use simple, easy-to-understand visualizations to highlight key metrics.
- Provide Context: Explain the background of the situation or problem. What led to this analysis? What were the initial goals or expectations?
- Engage the Audience: Use narrative techniques to draw your audience in. For example, you might start with a provocative question or a surprising statistic to capture attention.
So What? – Analyzing the Implications
- Identify Patterns and Trends: Use more complex visualizations to illustrate relationships within the data. Consider using interactive elements to allow your audience to explore the data themselves.
- Compare to Benchmarks: Put your findings in context by comparing them to regulations, industry standards or historical performance.
- Highlight Key Insights: Use narrative techniques to guide your audience through your analysis. Emphasize the most important findings and explain their significance.
Now What? – Formulating Recommendations
- Present Clear Action Items: Based on your analysis, outline specific, actionable recommendations. Use visual aids like flowcharts or decision trees to illustrate proposed processes or strategies.
- Quantify Potential Impact: Where possible, use data to project the potential outcomes of your recommendations. This could include forecasts, scenario analyses, or cost-benefit calculations.
- Tell a Future Story: Use narrative techniques to paint a picture of what success could look like if your recommendations are implemented. This helps make your proposals more tangible and motivating.
Best Practices for Effective Data Storytelling
To maximize the impact of your “What, So What, Now What” data story, keep these best practices in mind:
- Know Your Audience: Tailor your language, level of technical detail, and choice of visualizations to your specific audience.
- Use a Clear Narrative Arc: Structure your story with a beginning, middle, and end. This helps maintain engagement and ensures your key messages are memorable.
- Choose Appropriate Visualizations: Select chart types that best represent your data and support your narrative. Avoid cluttered or overly complex visuals.
- Highlight the Human Element: Where possible, include anecdotes or case studies that illustrate the real-world impact of your data and recommendations.
- Practice Data Ethics: Be transparent about your data sources and methodologies. Address potential biases or limitations in your analysis.
By combining the structured reflection of the “What, So What, Now What” model with powerful data storytelling techniques, you can create compelling narratives that not only present your findings but also drive meaningful action. This approach helps bridge the gap between data analysis and decision-making, ensuring that your insights translate into real-world impact.
Remember, effective data storytelling is both an art and a science. It requires a deep understanding of your data, a clear grasp of your audience’s needs, and the ability to weave these elements into a coherent and engaging narrative. With practice and refinement, you can master this powerful tool for driving data-informed change in your organization.