Measuring the Effectiveness of Risk Analysis in Engaging the Risk Management Decision-Making Process

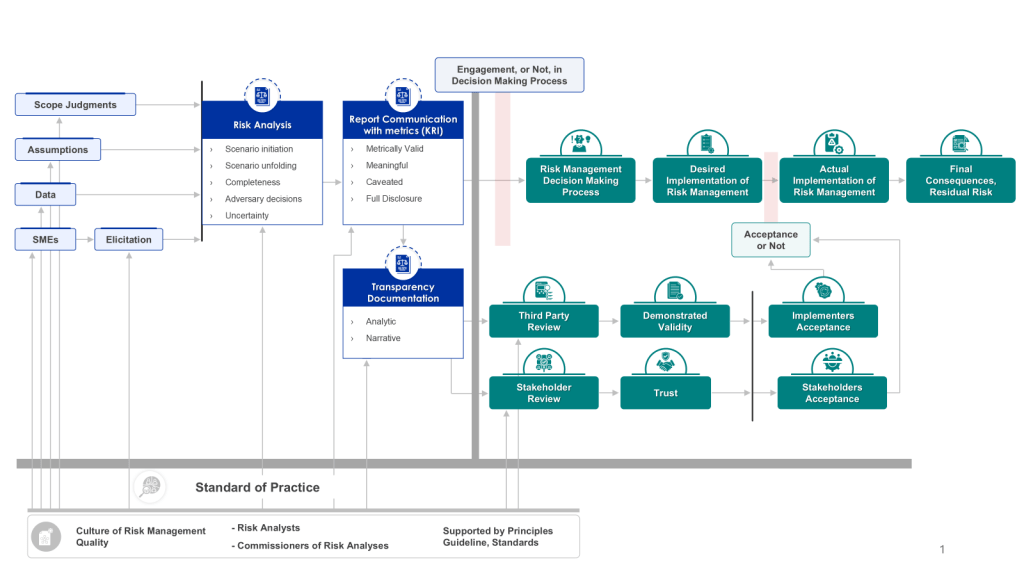
Effective risk analysis is crucial for informed decision-making and robust risk management. Simply conducting a risk analysis is not enough; its effectiveness in engaging the risk management decision-making process is paramount. This effectiveness is largely driven by the transparency and documentation of the analysis, which supports both stakeholder and third-party reviews. Let’s explore how we can measure this effectiveness and why it matters.

The Importance of Transparency and Documentation

Transparency and documentation form the backbone of an effective risk analysis process. They ensure that the methodology, assumptions, and results of the analysis are clear and accessible to all relevant parties. This clarity is essential for:

  1. Building trust among stakeholders
  2. Facilitating informed decision-making
  3. Enabling thorough reviews by internal and external parties
  4. Ensuring compliance with regulatory requirements

Key Metrics for Measuring Effectiveness

To gauge the effectiveness of risk analysis in engaging the decision-making process, consider the following metrics:

1. Stakeholder Engagement Level

Measure the degree to which stakeholders actively participate in the risk analysis process and utilize its outputs. This can be quantified by:

  • Number of stakeholder meetings or consultations
  • Frequency of stakeholder feedback on risk reports
  • Percentage of stakeholders actively involved in risk discussions

2. Decision Influence Rate

Assess how often risk analysis findings directly influence management decisions. Track:

  • Percentage of decisions that reference risk analysis outputs
  • Number of risk mitigation actions implemented based on analysis recommendations

3. Risk Reporting Quality

Evaluate the clarity and comprehensiveness of risk reports. Consider:

  • Readability scores of risk documentation
  • Completeness of risk data presented
  • Timeliness of risk reporting

This is a great place to leverage a rubric.

4. Third-Party Review Outcomes

Analyze the results of internal and external audits or reviews:

  • Number of findings or recommendations from reviews
  • Time taken to address review findings
  • Improvement in review scores over time

5. Risk Analysis Utilization

Measure how frequently risk analysis tools and outputs are accessed and used:

  • Frequency of access to risk dashboards or reports
  • Number of departments utilizing risk analysis outputs
  • Time spent by decision-makers reviewing risk information

Implementing Effective Measurement

To implement these metrics effectively:

  1. Establish Baselines: Determine current performance levels for each metric to track improvements over time.
  2. Set Clear Targets: Define specific, measurable goals for each metric aligned with organizational objectives.
  3. Utilize Technology: Implement risk management software to automate data collection and analysis, improving accuracy and timeliness.
  4. Regular Reporting: Create a schedule for regular reporting of these metrics to relevant stakeholders.
  5. Continuous Improvement: Use the insights gained from these measurements to refine the risk analysis process continually.

Enhancing Transparency and Documentation

To improve the effectiveness of risk analysis through better transparency and documentation:

Standardize Risk Reporting

Develop standardized templates and formats for risk reports to ensure consistency and completeness. This standardization facilitates easier comparison and analysis across different time periods or business units.

Implement a Risk Taxonomy

Create a common language for risk across the organization. A well-defined risk taxonomy ensures that all stakeholders understand and interpret risk information consistently.

Leverage Visualization Tools

Utilize data visualization techniques to present risk information in an easily digestible format. Visual representations can make complex risk data more accessible to a broader audience, enhancing engagement in the decision-making process.

Maintain a Comprehensive Audit Trail

Document all steps of the risk analysis process, including data sources, methodologies, assumptions, and decision rationales. This audit trail is crucial for both internal reviews and external audits.

Foster a Culture of Transparency

Encourage open communication about risks throughout the organization. This cultural shift can lead to more honest and accurate risk reporting, ultimately improving the quality of risk analysis.
Conclusion

Measuring the effectiveness of risk analysis in engaging the risk management decision-making process is crucial for organizations seeking to optimize their risk management strategies. By focusing on transparency and documentation, and implementing key metrics to track performance, organizations can ensure that their risk analysis efforts truly drive informed decision-making and robust risk management.

Remember, the goal is not just to conduct risk analysis, but to make it an integral part of the organization’s decision-making fabric. By continuously measuring and improving the effectiveness of risk analysis, organizations can build resilience, enhance stakeholder trust, and navigate uncertainties with greater confidence.
Assessing the Quality of Our Risk Management Activities

Twenty years on, risk management in the pharmaceutical world continues to be challenging. Ensure that risk assessments are systematic, structured, and based on scientific knowledge. A large part of the ICH Q9(R1) revision was written to address continued struggles with subjectivity, formality, and decision-making. And quite frankly, it’s clear to me that we, as an industry, are still working to absorb those messages these last two years.

A big challenge is that we struggle to measure the effectiveness of our risk assessments. Quite frankly, this is a great place for a rubric.

Luckily, we have a good tool out there to adopt: the Risk Analysis Quality Test (RAQT1.0), developed by the Society for Risk Analysis (SRA). This comprehensive framework is designed to evaluate and improve the quality of risk assessments. We can apply this tool to meet the requirements of the International Conference on Harmonisation (ICH) Q9, which outlines quality risk management principles for the pharmaceutical industry. From that, we can drive continued improvement in our risk management activities.

Components of RAQT1.0

The Risk Analysis Quality Test consists of 76 questions organized into 15 categories:

  • Framing the Analysis and Its Interface with Decision Making
  • Capturing the Risk Generating Process (RGP)
  • Communication
  • Stakeholder Involvement
  • Assumptions and Scope Boundary Issues
  • Proactive Creation of Alternative Courses of Action
  • Basis of Knowledge
  • Data Limitations
  • Analysis Limitations
  • Uncertainty
  • Consideration of Alternative Analysis Approaches
  • Robustness and Resilience of Action Strategies
  • Model and Analysis Validation and Documentation
  • Reporting
  • Budget and Schedule Adequacy

Application to ICH Q9 Requirements

ICH Q9 emphasizes the importance of a systematic and structured risk assessment process. The RAQT can be used to ensure that risk assessments are thorough and meet quality standards. For example, Category G (Basis of Knowledge) and Category H (Data Limitations) help in evaluating the scientific basis and data quality of the risk assessment, aligning with ICH Q9’s requirement for using available knowledge and data.

The RAQT’s Category B (Capturing the Risk Generating Process) and Category C (Communication) can help in identifying and communicating risks effectively. This aligns with ICH Q9’s requirement to identify potential risks based on scientific knowledge and understanding of the process.

Categories such as Category I (Analysis Limitations) and Category J (Uncertainty) in the RAQT help in analyzing the risks and addressing uncertainties, which is a key aspect of ICH Q9. These categories ensure that the analysis is robust and considers all relevant factors.

The RAQT’s Category A (Framing the Analysis and Its Interface with Decision Making) and Category F (Proactive Creation of Alternative Courses of Action) are crucial for evaluating risks and developing mitigation strategies. This aligns with ICH Q9’s requirement to evaluate risks and determine the need for risk reduction.

Categories like Category L (Robustness and Resilience of Action Strategies) and Category M (Model and Analysis Validation and Documentation) in the RAQT help in ensuring that the risk control measures are robust and well-documented. This is consistent with ICH Q9’s emphasis on implementing and reviewing controls.

Category D (Stakeholder Involvement) of the RAQT ensures that stakeholders are engaged in the risk management process, which is a requirement under ICH Q9 for effective communication and collaboration.

The RAQT can be applied both retrospectively and prospectively, allowing for the evaluation of past risk assessments and the planning of future ones. This aligns with ICH Q9’s requirement for periodic review and continuous improvement of the risk management process.

Creating a Rubric

To make this actionable we need a tool, a rubric, to allow folks to evaluate what goods look like. I would insert this tool into the quality oversite of risk management.

Category A: Framing the Analysis and Its Interface With Decision Making

CriteriaExcellent (4)Good (3)Fair (2)Poor (1)
Problem DefinitionClearly and comprehensively defines the problem, including all relevant aspects and stakeholdersAdequately defines the problem with most relevant aspects consideredPartially defines the problem with some key aspects missingPoorly defines the problem or misses critical aspects
Analytical ApproachSelects and justifies an optimal analytical approach, demonstrating deep understanding of methodologiesChooses an appropriate analytical approach with reasonable justificationSelects a somewhat relevant approach with limited justificationChooses an inappropriate approach or provides no justification
Data Collection and ManagementThoroughly identifies all necessary data sources and outlines a comprehensive data management planIdentifies most relevant data sources and provides a adequate data management planIdentifies some relevant data sources and offers a basic data management planFails to identify key data sources or lacks a coherent data management plan
Stakeholder IdentificationComprehensively identifies all relevant stakeholders and their interestsIdentifies most key stakeholders and their primary interestsIdentifies some stakeholders but misses important ones or their interestsFails to identify major stakeholders or their interests
Decision-Making ContextProvides a thorough analysis of the decision-making context, including constraints and opportunitiesAdequately describes the decision-making context with most key factors consideredPartially describes the decision-making context, missing some important factorsPoorly describes or misunderstands the decision-making context
Alignment with Organizational GoalsDemonstrates perfect alignment between the analysis and broader organizational objectivesShows good alignment with organizational goals, with minor gapsPartially aligns with organizational goals, with significant gapsFails to align with or contradicts organizational goals
Communication StrategyDevelops a comprehensive strategy for communicating results to all relevant decision-makersOutlines a good communication strategy covering most key decision-makersProvides a basic communication plan with some gapsLacks a clear strategy for communicating results to decision-makers

This rubric provides a framework for assessing the quality of work in framing an analysis and its interface with decision-making. It covers key aspects such as problem definition, analytical approach, data management, stakeholder consideration, decision-making context, alignment with organizational goals, and communication strategy. Each criterion is evaluated on a scale from 1 (Poor) to 4 (Excellent), allowing for nuanced assessment of performance in each area.

To use this rubric effectively:

  1. Adjust the criteria and descriptions as needed to fit your specific context or requirements.
  2. Ensure that the expectations for each level (Excellent, Good, Fair, Poor) are clear and distinguishable.

My next steps will be to add specific examples or indicators for each level to provide more guidance to both assessors and those being assessed.

I also may, depending on internal needs, want to assign different weights to each criterion based on their relative importance in your specific context. In this case I think each ends up being pretty similar.

I would then go and add the other sections. For example, here is category B with some possible weighting.

Category B: Capturing the Risk Generating Process (RGP)

ComponentWeight FactorExcellentSatisfactoryNeeds ImprovementPoor
B1. Comprehensiveness4The analysis includes: i) A structured taxonomy of hazards/events demonstrating comprehensiveness ii) Each scenario spelled out with causes and types of change iii) Explicit addressing of potential “Black Swan” events iv) Clear description of implications of such events for risk managementThe analysis includes 3 out of 4 elements from the Excellent criteria, with minor gaps that do not significantly impact understandingThe analysis includes only 2 out of 4 elements from the Excellent criteria, or has significant gaps in comprehensivenessThe analysis includes 1 or fewer elements from the Excellent criteria, severely lacking in comprehensiveness
B2. Basic Structure of RGP2Clearly identifies and accounts for the basic structure of the RGP (e.g. linear, chaotic, complex adaptive) AND Uses appropriate mathematical structures (e.g. linear, quadratic, exponential) that match the RGP structureIdentifies the basic structure of the RGP BUT does not fully align mathematical structures with the RGPAttempts to identify the RGP structure but does so incorrectly or incompletely OR Uses mathematical structures that do not align with the RGPDoes not identify or account for the basic structure of the RGP
B3. Complexity of RGP3Lists all important causal and associative links in the RGP AND Demonstrates how each link is accounted for in the analysisLists most important causal and associative links in the RGP AND Demonstrates how most links are accounted for in the analysisLists some causal and associative links but misses key elements OR Does not adequately demonstrate how links are accounted for in the analysisDoes not list causal and associative links or account for them in the analysis
B4. Early Warning Detection3Includes a clear process for detecting early warnings of potential surprising risk aspects, beyond just concrete eventsIncludes a process for detecting early warnings, but it may be limited in scope or not fully developedMentions the need for early warning detection but does not provide a clear processDoes not address early warning detection
B5. System Changes2Fully considers the possibility of system changes AND Establishes adequate mechanisms to detect those changesConsiders the possibility of system changes BUT mechanisms to detect changes are not fully developedMentions the possibility of system changes but does not adequately consider or establish detection mechanismsDoes not consider or address the possibility of system changes

    I definitely need to go back and add more around structure requirements. The SRA RAQT tool needs some more interpretation here.

    Category C: Risk Communication

    ComponentWeight FactorExcellentSatisfactoryNeeds ImprovementPoor
    C1. Integration of Communication into Risk Analysis3Communication is fully integrated into the risk analysis following established norms). All aspects of the methodology are clearly addressed including context establishment, risk assessment (identification, analysis, evaluation), and risk treatment. There is clear evidence of pre-assessment, management, appraisal, characterization and evaluation. Knowledge about the risk is thoroughly categorized.Communication is integrated into the risk analysis following most aspects of established norms. Most key elements of methodologies like ISO 31000 or IRGC are addressed, but some minor aspects may be missing or unclear. Knowledge about the risk is categorized, but may lack some detail.Communication is partially integrated into the risk analysis, but significant aspects of established norms are missing. Only some elements of methodologies like ISO 31000 or IRGC are addressed. Knowledge categorization about the risk is incomplete or unclear.There is little to no evidence of communication being integrated into the risk analysis following established norms. Methodologies like ISO 31000 or IRGC are not followed. Knowledge about the risk is not categorized.
    C2. Adequacy of Risk Communication3All considerations for effective risk communication have been applied to ensure adequacy between analysts and decision makers, analysts and other stakeholders, and decision makers and stakeholders. There is clear evidence that all parties agree the communication is adequate.Most considerations for effective risk communication have been applied. Communication appears adequate between most parties, but there may be minor gaps or areas where agreement on adequacy is not explicitly stated.Some considerations for effective risk communication have been applied, but there are significant gaps. Communication adequacy is questionable between one or more sets of parties. There is limited evidence of agreement on communication adequacy.Few to no considerations for effective risk communication have been applied. There is no evidence of adequate communication between analysts, decision makers, and stakeholders. There is no indication of agreement on communication adequacy.

    Category D: Stakeholder Involvement

    CriteriaWeightExcellent (4)Satisfactory (3)Needs Improvement (2)Poor (1)
    Stakeholder Identification4All relevant stakeholders are systematically and comprehensively identifiedMost relevant stakeholders are identified, with minor omissionsSome relevant stakeholders are identified, but significant groups are missedFew or no relevant stakeholders are identified
    Stakeholder Consultation3All identified stakeholders are thoroughly consulted, with their perceptions and concerns fully consideredMost identified stakeholders are consulted, with their main concerns consideredSome stakeholders are consulted, but consultation is limited in scope or depthFew or no stakeholders are consulted
    Stakeholder Engagement3Stakeholders are actively engaged throughout the entire risk management process, including problem framing, decision-making, and implementationStakeholders are engaged in most key stages of the risk management processStakeholders are engaged in some aspects of the risk management process, but engagement is inconsistentStakeholders are minimally engaged or not engaged at all in the risk management process
    Effectiveness of Involvement2All stakeholders would agree that they were effectively consulted and engagedMost stakeholders would agree that they were adequately consulted and engagedSome stakeholders may feel their involvement was insufficient or ineffectiveMost stakeholders would likely feel their involvement was inadequate or ineffective

    Category E: Assumptions and Scope Boundary Issues

    CriterionWeightExcellent (4)Satisfactory (3)Needs Improvement (2)Poor (1)
    E1. Important assumptions and implications listed4All important assumptions and their implications for risk management are systematically listed in clear language understandable to decision makers. Comprehensive and well-organized.Most important assumptions and implications are listed in language generally clear to decision makers. Some minor omissions or lack of clarity.Some important assumptions and implications are listed, but significant gaps exist. Language is not always clear to decision makers.Few or no important assumptions and implications are listed. Language is unclear or incomprehensible to decision makers.
    E2. Risks of assumption deviations evaluated3Risks of all significant assumptions deviating from the actual Risk Generating Process are thoroughly evaluated. Consequences and implications are clearly communicated to decision makers.Most risks of significant assumption deviations are evaluated. Consequences and implications are generally communicated to decision makers, with minor gaps.Some risks of assumption deviations are evaluated, but significant gaps exist. Communication to decision makers is incomplete or unclear.Few or no risks of assumption deviations are evaluated. Little to no communication of consequences and implications to decision makers.
    E3. Scope boundary issues and implications listed3All important scope boundary issues and their implications for risk management are systematically listed in clear language understandable to decision makers. Comprehensive and well-organized.Most important scope boundary issues and implications are listed in language generally clear to decision makers. Some minor omissions or lack of clarity.Some important scope boundary issues and implications are listed, but significant gaps exist. Language is not always clear to decision makers.Few or no important scope boundary issues and implications are listed. Language is unclear or incomprehensible to decision makers.

    Category F: Proactive Creation of Alternative Courses of Action

    CriteriaWeightExcellent (4)Satisfactory (3)Needs Improvement (2)Poor (1)
    Systematic generation of alternatives4A comprehensive and structured process is used to systematically generate a wide range of alternative courses of action, going well beyond initially considered optionsA deliberate process is used to generate multiple alternative courses of action beyond those initially consideredSome effort is made to generate alternatives, but the process is not systematic or comprehensiveLittle to no effort is made to generate alternatives beyond those initially considered
    Goal-focused creation3All generated alternatives are clearly aligned with and directly address the stated goals of the analysisMost generated alternatives align with the stated goals of the analysisSome generated alternatives align with the goals, but others seem tangential or unrelatedGenerated alternatives (if any) do not align with or address the stated goals
    Consideration of robust/resilient options3Multiple robust and resilient alternatives are developed to address various uncertainty scenariosAt least one robust or resilient alternative is developed to address uncertaintyRobustness and resilience are considered, but not fully incorporated into alternativesRobustness and resilience are not considered in alternative generation
    Examination of unintended consequences2Thorough examination of potential unintended consequences for each alternative, including action-reaction spiralsSome examination of potential unintended consequences for most alternativesLimited examination of unintended consequences for some alternativesNo consideration of potential unintended consequences
    Documentation of alternative creation process1The process of alternative generation is fully documented, including rationale for each alternativeThe process of alternative generation is mostly documentedThe process of alternative generation is partially documentedThe process of alternative generation is not documented

    Category G: Basis of Knowledge

    CriterionWeightExcellent (4)Satisfactory (3)Needs Improvement (2)Poor (1)
    G1. Characterization of knowledge basis4All inputs are clearly characterized (empirical, expert elicitation, testing, modeling, etc.). Distinctions between broadly accepted and novel analyses are explicitly stated.Most inputs are characterized, with some minor omissions. Distinctions between accepted and novel analyses are mostly clear.Some inputs are characterized, but significant gaps exist. Limited distinction between accepted and novel analyses.Little to no characterization of knowledge basis. No distinction between accepted and novel analyses.
    G2. Strength of knowledge adequacy3Strength of knowledge is thoroughly characterized in terms of its adequacy to support risk management decisions. Limitations are clearly articulated.Strength of knowledge is mostly characterized, with some minor gaps in relating to decision support adequacy.Limited characterization of knowledge strength. Unclear how it relates to decision support adequacy.No characterization of knowledge strength or its adequacy for decision support.
    G3. Communication of knowledge limitations4All knowledge limitations and their implications for risk management are clearly communicated to decision makers in understandable language.Most knowledge limitations and implications are communicated, with minor clarity issues.Some knowledge limitations are communicated, but significant gaps exist in clarity or completeness.Knowledge limitations are not communicated or are presented in a way decision makers cannot understand.
    G4. Consideration of surprises and unforeseen events3Thorough consideration of potential surprises and unforeseen events (Black Swans). Their importance is clearly articulated.Consideration of surprises and unforeseen events is present, with some minor gaps in articulating their importance.Limited consideration of surprises and unforeseen events. Their importance is not clearly articulated.No consideration of surprises or unforeseen events.
    G5. Conflicting expert opinions2All conflicting expert opinions are systematically considered and reported to decision makers as a source of uncertainty.Most conflicting expert opinions are considered and reported, with minor omissions.Some conflicting expert opinions are considered, but significant gaps exist in reporting or consideration.Conflicting expert opinions are not considered or reported.
    G6. Consideration of unconsidered knowledge2Explicit measures are implemented to check for knowledge outside the analysis group (e.g., independent review).Some measures are in place to check for outside knowledge, but they may not be comprehensive.Limited consideration of knowledge outside the analysis group. No formal measures in place.No consideration of knowledge outside the analysis group.
    G7. Consideration of disregarded low-probability events1Explicit measures are implemented to check for events disregarded due to low probabilities based on critical assumptions.Some consideration of low-probability events, but measures may not be comprehensive.Limited consideration of low-probability events. No formal measures in place.No consideration of events disregarded due to low probabilities.

    This rubric, once done, is a tool to guide assessment and provide feedback. It should be flexible enough to accommodate unique aspects of individual work while maintaining consistent standards across evaluations. I’d embed it in the quality approval step.

    Validating Manufacturing Process Closure for Biotech Utilizing Single-Use Systems (SUS)

    Maintaining process closure is crucial for ensuring product quality and safety in biotechnology manufacturing, especially when using single-use systems (SUS). This approach is an integral part of the contamination control strategy (CCS). To validate process closure in SUS-based biotech manufacturing, a comprehensive method is necessary, incorporating:

    1. Risk assessment
    2. Thorough testing
    3. Ongoing monitoring

    By employing risk analysis tools such as Hazard Analysis and Critical Control Points (HACCP) and Failure Mode and Effects Analysis (FMEA), manufacturers can identify potential weaknesses in their processes. Additionally, addressing all four layers of protection helps ensure process integrity and product safety. This risk-based approach to process closure validation is essential for maintaining the high standards required in biotechnology manufacturing, including meeting Annex 1.

    Understanding Process Closure

    Process closure refers to the isolation of the manufacturing process from the external environment to prevent contamination. In biotech, this is particularly crucial due to the sensitivity of biological products and the potential for microbial contamination.

    The Four Layers of Protection

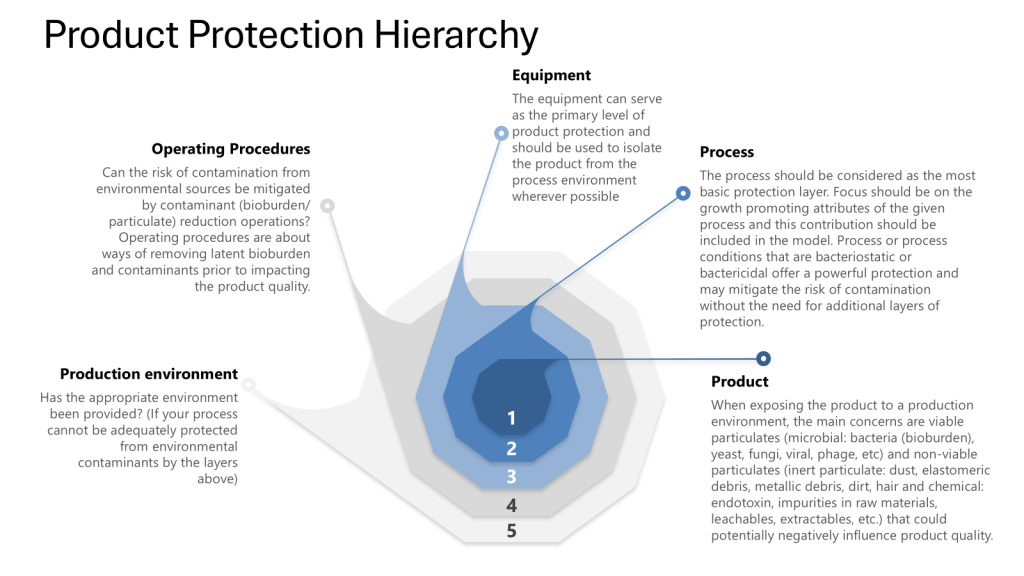
    Throughout this process it is important to apply the four layers of protection that form the foundation of a robust contamination control strategy:

    1. Process: The inherent ability of the process to prevent or control contamination
    2. Equipment: The design and functionality of equipment to maintain closure
    3. Operating Procedures: The practices and protocols followed by personnel
    4. Production Environment: The controlled environment surrounding the process

    I was discussing this with some colleagues this week (preparing for some risk assessments) and I was reminded that we really should put the Patient in at the center, the zero. Truer words have never been spoken as the patient truly is our zeroth law, the fundamental principle of the GxPs.

    Key Steps for Validating Process Closure

    Risk Assessment

    Start with a comprehensive risk assessment using tools such as HACCP (Hazard Analysis and Critical Control Points) and FMEA (Failure Mode and Effects Analysis). It is important to remember this is not a one or another, but a multi-tiered approach where you first determine the hazards through the HACCP and then drill down into failures through an FMEA.

    HACCP Approach

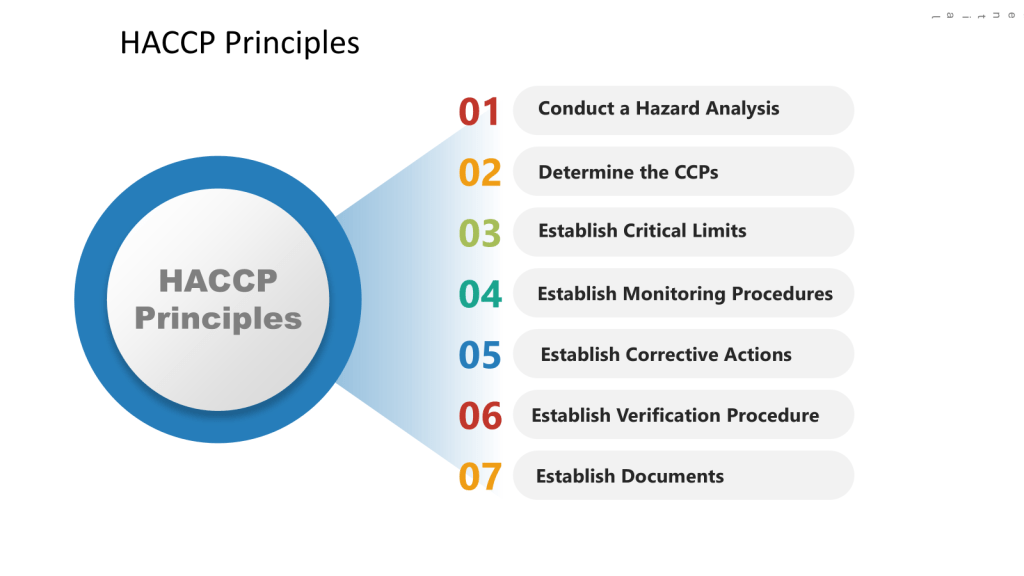
    In the HACCP we will apply a systematic, preventative approach to identify hazards in the process with the aim to produce a documented plan to control these scenarios.

    a) Conduct a hazard analysis
    b) Identify Critical Control Points (CCPs)
    c) Establish critical limits
    d) Implement monitoring procedures
    e) Define corrective actions
    f) Establish verification procedures
    g) Maintain documentation and records

    FMEA Considerations

    In the FMEA we will look for ways the process fails, focusing on the SUS components. We will evaluate failures at each level of control (process, equipment, operating procedure and environment).

    • Identify potential failure modes in the SUS components
    • Assess the severity, occurrence, and detectability of each failure mode
    • Calculate Risk Priority Numbers (RPN) to prioritize risks

    Verification

    Utilizing these risk assessments, define the user requirements specification (URS) for the SUS, focusing on critical aspects that could impact product quality and patient safety. This should include:

    • Process requirements (e.g. working volumes, flow rates, pressure ranges)
    • Material compatibility requirements
    • Sterility/bioburden control requirements
    • Leachables/extractables requirements
    • Integrity testing requirements
    • Connectivity and interface requirements

    Following the ASTM E2500 approach, when we conduct the design review of the proposed SUS configuration, to evaluate how well it meets the URS, we want to ensure we cover:

    • Overall system design and component selection
    • Materials of construction
    • Sterilization/sanitization approach
    • Integrity assurance measures
    • Sampling and monitoring capabilities
    • Automation and control strategy

    Circle back to the HACCP and FMEA to ensure they appropriately cover critical aspects like:

    • Loss of sterility/integrity
    • Leachables/extractables introduction
    • Bioburden control failures
    • Cross-contamination risks
    • Process parameter deviations

    These risk assessments will define critical control parameters and acceptance criteria based on the risk assessment. These will form the basis for verification testing. We will through our verification plan have an appropriate approach to:

    • Verify proper installation of SUS components
    • Check integrity of connections and seals
    • Confirm correct placement of sensors and monitoring devices
    • Document as-built system configuration
    • Test system integrity under various operating conditions
    • Perform leak tests on connections and seals
    • Validate sterilization processes for SUS components
    • Verify functionality of critical sensors and control
    • Run simulated production cycles
    • Monitor for contamination using sensitive detection methods
    • Verify maintenance of sterility throughout the process
    • Assess product quality attributes

    The verification strategy will leverage a variety of supplier documentation and internal testing.

    Closure Analysis Risk Assessment (CLARA)

    Acceptance and release will be to perform a detailed CLARA to:

    • Identify all potential points of contamination ingress
    • Assess the effectiveness of closure mechanisms
    • Evaluate the robustness of aseptic connections
    • Determine the impact of manual interventions on system closure

    On Going Use

    Coming out of our HACCP we will have a monitoring and verification plan, this will include some important aspects based on our CCPs.

    • Integrity Testing
      • Implement routine integrity testing protocols for SUS components
      • Utilize methods such as pressure decay tests or helium leak detection
      • Establish acceptance criteria for integrity tests
    • Environmental Monitoring
      • Develop a comprehensive environmental monitoring program
      • Include viable and non-viable particle monitoring
      • Establish alert and action limits for environmental contaminants
    • Operator Training and Qualification
      • Develop detailed SOPs for SUS handling and assembly
      • Implement a rigorous training program for operators
      • Qualify operators through practical assessments
    • Change Control and Continuous Improvement
      • Establish a robust change control process for any modifications to the SUS or process
      • Regularly review and update risk assessments based on new data or changes
      • Implement a continuous improvement program to enhance process closure

    Leveraging the Four Layers of Protection

    Throughout the validation process, ensure that each layer of protection is addressed:

    1. Process:
      • Optimize process parameters to minimize contamination risks
      • Implement in-process controls to detect deviations
    2. Equipment:
      • Validate the design and functionality of SUS components
      • Ensure proper integration of SUS with existing equipment
    3. Operating Procedures:
      • Develop and validate aseptic techniques for SUS handling
      • Implement procedures for system assembly and disassembly
    4. Production Environment:
      • Qualify the cleanroom environment
      • Validate HVAC systems and air filtration

    Remember that validation is an ongoing process. Regular reviews, updates to risk assessments, and incorporation of new technologies and best practices are essential for maintaining a state of control in biotech manufacturing using single-use systems.

    Connected to the Contamination Control Strategy

    Closed systems are a key element of the overall contamination control strategy with closed processing and closed systems now accepted as the most effective contamination control risk mitigation strategy. I might not be able to manufacture in the woods yet, but darn if I won’t keep trying.

    They serve as a primary barrier to prevent contamination from the manufacturing environment by helping to mitigate the risk of contamination by isolating the product from the surrounding environment. Closed systems are the key protective measure to prevent contamination from the manufacturing environment and cross-contamination from neighboring operations.

    The risk assessments leveraged during the implementation of closed systems are a crucial part of developing an effective CCS and will communicate the (ideally) robust methods used to protect products from environmental contamination and cross-contamination. This is tied into the facility design, environmental controls, risk assessments, and overall manufacturing strategies, which are the key components of a comprehensive CCS.

    Risk Assessments as part of Design and Verification

    Facility design and manufacturing processes are complex, multi-stage operations, fraught with difficulty. Ensuring the facility meets Good Manufacturing Practice (GMP) standards and other regulatory requirements is a major challenge. The complex regulations around biomanufacturing facilities require careful planning and documentation from the earliest design stages. 

    Which is why consensus standards like ASTM E2500 exist.

    Central to these approaches are risk assessment, to which there are three primary components:

    • An understanding of the uncertainties in the design (which includes materials, processing, equipment, personnel, environment, detection systems, feedback control)
    • An identification of the hazards and failure mechanisms
    • An estimation of the risks associated with each hazard and failure

    Folks often get tied up on what tool to use. Frankly, this is a phase approach. We start with a PHA for design, an FMEA for verification and a HACCP/Layers of Control Analysis for Acceptance. Throughout we use a bow-tie for communication.

    AspectBow-TiePHA (Preliminary Hazard Analysis)FMEA (Failure Mode and Effects Analysis)HACCP (Hazard Analysis and Critical Control Points)
    Primary FocusVisualizing risk pathwaysEarly hazard identificationPotential failure modesSystematically identify, evaluate, and control hazards that could compromise product safety
    Timing in ProcessAny stageEarly developmentAny stage, often designThroughout production
    ApproachCombines causes and consequencesTop-downBottom-upSystematic prevention
    ComplexityModerateLow to moderateHighModerate
    Visual RepresentationCentral event with causes and consequencesTabular formatTabular formatFlow diagram with CCPs
    Risk QuantificationCan include, not requiredBasic risk estimationRisk Priority Number (RPN)Not typically quantified
    Regulatory AlignmentLess common in pharmaAligns with ISO 14971Widely accepted in pharmaLess common in pharma
    Critical PointsIdentifies barriersDoes not specifyIdentifies critical failure modesIdentifies Critical Control Points (CCPs)
    ScopeSpecific hazardous eventSystem-level hazardsComponent or process-level failuresProcess-specific hazards
    Team RequirementsCross-functionalLess detailed knowledge neededDetailed system knowledgeFood safety expertise
    Ongoing ManagementCan be used for monitoringOften updated periodicallyRegularly updatedContinuous monitoring of CCPs
    OutputVisual risk scenarioList of hazards and initial risk levelsPrioritized list of failure modesHACCP plan with CCPs
    Typical Use in PharmaRisk communicationEarly risk identificationDetailed risk analysisProduct Safety/Contamination Control

    At BOSCON this year I’ll be talking about this fascinating detail, perhaps too much detail.

    Conducting A Hazard and Operability Study (HAZOP)

    A Hazard and Operability Study (HAZOP) is a structured and systematic examination of a complex planned or existing process or operation to identify and evaluate problems that may represent risks to product, personnel or equipment. The primary goal of a HAZOP is to ensure that risks are managed effectively by identifying potential hazards and operability problems and developing appropriate mitigation strategies.

    Why Use HAZOP?

    Biotech facilities involve intricate processes that can be prone to various risks, including contamination, equipment failure, and process deviations. Implementing a HAZOP can:

    • Risk Identification and Mitigation: HAZOPs help identify potential hazards associated with biotech processes, such as contamination risks, equipment malfunctions, and deviations from standard operating procedures. By identifying these risks, facilities can implement mitigation strategies to prevent accidents and ensure safety.
    • Process Optimization: Through the systematic analysis of processes, HAZOPs can identify inefficiencies and areas for improvement, leading to optimized operations and enhanced productivity.

    Part of a Continuum of Risk Tools

    A HAZOP (Hazard and Operability) study differs from other risk assessment methods in a few key ways:

    1. Systematic examination of process deviations: HAZOP uses a very structured approach of examining potential deviations from the intended design and operation of a process, using guidewords like “more”, “less”, “no”, “reverse”, etc. This systematic approach helps identify hazards that may be missed by other methods.
    2. Focus on operability issues: The HAZOP examines operability problems that could impact process efficiency or product quality.
    3. Node-by-node analysis: The process is broken down into nodes or sections that are analyzed individually, allowing for very thorough examination.
    4. Qualitative analysis: Unlike quantitative risk assessment methods, HAZOP is primarily qualitative, focusing on identifying potential hazards rather than quantifying risk levels. HAZOPs do not typically assign numerical scores or rankings to risks.
    5. Consideration of causes and consequences: For each deviation, the team examines possible causes, consequences, and existing safeguards before recommending additional actions.
    6. Applicable to complex processes: The structured approach makes HAZOP well-suited for analyzing complex processes with many variables and potential interactions.
    MethodDescriptionStrengthsLimitations
    HAZOP (Hazard and Operability Study)Systematic examination of process/operation to identify potential hazards and operability problems– Very thorough and structured approach
    – Examines deviations from design intent
    – Team-based
    – Time consuming
    – Primarily qualitative
    FMEA (Failure Mode and Effects Analysis)Systematic method to identify potential failure modes and their effects– Quantitative risk prioritization
    – Proactive approach
    – Can be used on products and processes
    – Does not consider combinations of failures
    – Can be subjective
    HACCP (Hazard Analysis and Critical Control Points)Systematic approach to food safety hazards– Focus on prevention
    – Identifies critical control points
    – Requires prerequisite programs in place
    PHA (Preliminary Hazard Analysis)Early stage hazard identification technique– Can be used early in design process
    – Relatively quick to perform
    – Identifies major hazards
    – Not very detailed
    – Qualitative only
    – May miss some hazards
    Bow-Tie AnalysisCombines fault tree and event tree analysis– Visual representation of risk pathways
    – Shows preventive and mitigative controls
    – Good communication tool
    – Does not show detailed failure logic
    – Can oversimplify complex scenarios
    – Time consuming for multiple hazards

    Key differences:

    • HAZOP focuses on deviations from design intent, while FMEA looks at potential failure modes
    • HACCP is specific to identify hazards and is commonly used in food safety, while the others are more general risk assessment tools
    • PHA is used early in design, while the others are typically used on existing systems
    • Bow-Tie provides a visual risk pathway, while the others use more tabular formats
    • FMEA and HAZOP tend to be the most thorough and time-intensive methods

    The choice of method depends on the specific application, stage of design, and level of detail required. Often a combination of methods may be used.

    Instructions for Conducting a HAZOP

    Preparation

      • Assemble a multidisciplinary team comprising appropriate experts
      • Define the scope of the HAZOP study, including the specific processes or operations to be analyzed.
      • Gather and review all relevant documentation, such as process flow diagrams, piping and instrumentation diagrams, and standard operating procedures.

      Execution

        • Divide the Process into Nodes: Break down the process into manageable sections or nodes. Each node typically represents a specific part of the process, such as a piece of equipment or a process step.
        • Identify Deviations: For each node, guidewords are applied to identify potential deviations from the intended design or operation. Common guidewords include:
          • No: Complete absence of a process parameter (e.g., no flow).
          • More: Quantitative increase (e.g., more pressure).
          • Less: Quantitative decrease (e.g., less temperature).
          • As well as: Presence of additional elements (e.g., contamination).
          • Part of: Partial completion of an action (e.g., partial mixing).
          • Reverse: Logical opposite of the intended action (e.g., reverse flow).
        • Analyze Causes and Consequences: Determine the possible causes of each deviation and analyze the potential consequences on safety, environment, and operations. This involves considering various factors such as equipment failure, human error, environmental conditions, or procedural issues that could lead to the deviation.
          • Use of Experience and Knowledge: The team relies on their collective experience and knowledge of the process, equipment, and industry standards to hypothesize potential causes. This may include reviewing historical data, previous incidents, and near misses.
        • Recommend Actions: Develop recommendations for mitigating identified risks, such as changes to the process, additional controls, or procedural modifications.

        Documentation and Follow-Up

          • Document all findings, including identified hazards, potential consequences, and recommended actions.
          • Assign responsibilities for implementing recommendations and establish timelines for completion.
          • Conduct follow-up reviews to ensure that recommended actions have been implemented effectively and that the process remains safe and operable.

          Review and Update

            • Regularly review and update the HAZOP study to account for changes in processes, equipment, or regulations.
            • Ensure continuous improvement by incorporating lessons learned from past incidents or near misses.
            • Iterative Process: The process is iterative, with the team revisiting and refining their analysis as more information becomes available or as the understanding of the process deepens.
            NodeGuidewordParameterDeviationCauseConsequenceSafeguardsRecommendationsActions
            Specific section or equipment being analyzedGuideword applied (e.g. No, More, Less, Reverse, etc.)Process parameter being examined (e.g. Flow, Temperature, Pressure, etc.)How the parameter deviates from design intent when guideword is appliedPossible reasons for the deviationPotential results if deviation occursExisting measures to prevent or mitigate the deviationSuggested additional measures to control the riskSpecific tasks assigned to implement recommendations