The Golden Start to a Deviation Investigation

How you respond in the first 24 hours after discovering a deviation can make the difference between a minor quality issue and a major compliance problem. This critical window-what I call “The Golden Day”-represents your best opportunity to capture accurate information, contain potential risks, and set the stage for a successful investigation. When managed effectively, this initial day creates the foundation for identifying true root causes and implementing effective corrective actions that protect product quality and patient safety.

Why the First 24 Hours Matter: The Evidence

The initial response to a deviation is crucial for both regulatory compliance and effective problem-solving. Industry practice and regulatory expectations align on the importance of quick, systematic responses to deviations.

  • Regulatory expectations explicitly state that deviation investigation and root cause determination should be completed in a timely manner, and industry expectations usually align on deviations being completed within 30 days of discovery.
  • In the landmark U.S. v. Barr Laboratories case, “the Court declared that all failure investigations must be performed promptly, within thirty business days of the problem’s occurrence”
  • Best practices recommend assembling a cross-functional team immediately after deviation discovery and conduct initial risk assessment within 24 hours”
  • Initial actions taken in the first day directly impact the quality and effectiveness of the entire investigation process

When you capitalize on this golden window, you’re working with fresh memories, intact evidence, and the highest chance of observing actual conditions that contributed to the deviation.

Identifying the Problem: Clarity from the Start

Clear, precise problem definition forms the foundation of any effective investigation. Vague or incomplete problem statements lead to misdirected investigations and ultimately, inadequate corrective actions.

  • Document using specific, factual language that describes what occurred versus what was expected
  • Include all relevant details such as procedure and equipment numbers, product names and lot numbers
  • Apply the 5W2H method (What, When, Where, Who, Why if known, How much is involved, and How it was discovered)
  • Avoid speculation about causes in the initial description
  • Remember that the description should incorporate relevant records and photographs of discovered defects.
5W2HTypical questionsContains
Who?Who are the people directly concerned with the problem? Who does this? Who should be involved but wasn’t? Was someone involved who shouldn’t be?User IDs, Roles and Departments
What?What happened?Action, steps, description
When?When did the problem occur?Times, dates, place In process
Where?Where did the problem occur?Location
Why is it important?Why did we do this? What are the requirements? What is the expected condition?Justification, reason
How?How did we discover. Where in the process was it?Method, process, procedure
How Many? How Much?How many things are involved? How often did the situation happen? How much did it impact?Number, frequency

The quality of your deviation documentation begins with this initial identification. As I’ve emphasized in previous posts, the investigation/deviation report should tell a story that can be easily understood by all parties well after the event and the investigation. This narrative begins with clear identification on day one.

ElementsProblem Statement
Is used to…Understand and target a problem. Providing a scope. Evaluate any risks. Make objective decisions
Answers the following… (5W2H)What? (problem that occurred);When? (timing of what occurred); Where? (location of what occurred); Who? (persons involved/observers); Why? (why it matters, not why it occurred); How Much/Many? (volume or count); How Often? (First/only occurrence or multiple)
Contains…Object (What was affected?); Defect (What went wrong?)
Provides direction for…Escalation(s); Investigation

Going to the GEMBA: Being Where the Action Is

GEMBA-the actual place where work happens-is a cornerstone concept in quality management. When a deviation occurs, there is no substitute for being physically present at the location.

  • Observe the actual conditions and environment firsthand
  • Notice details that might not be captured in written reports
  • Understand the workflow and context surrounding the deviation
  • Gather physical evidence before it’s lost or conditions change
  • Create the opportunity for meaningful conversations with operators

Human error occurs because we are human beings. The extent of our knowledge, training, and skill has little to do with the mistakes we make. We tire, our minds wander and lose concentration, and we must navigate complex processes while satisfying competing goals and priorities – compliance, schedule adherence, efficiency, etc.

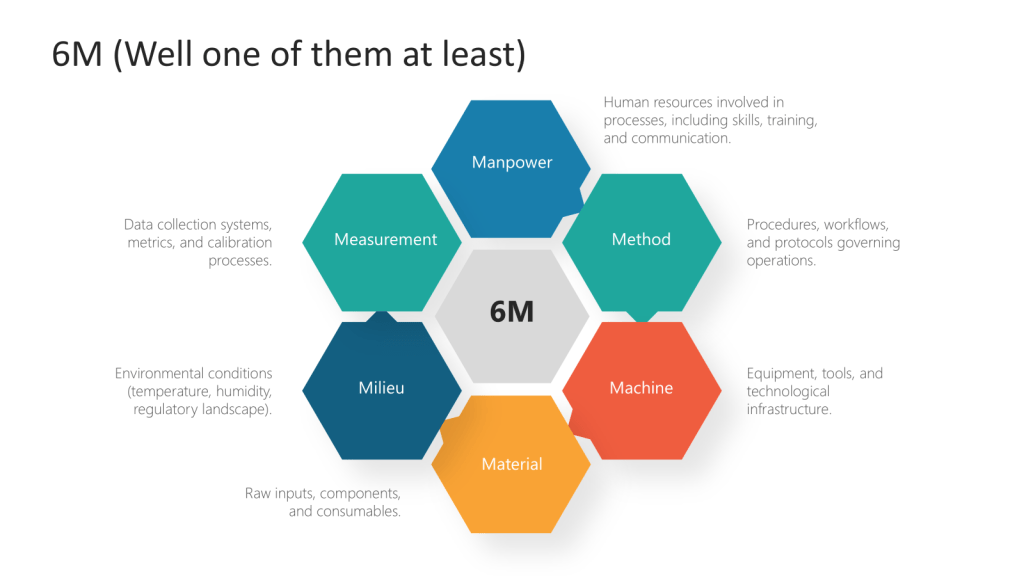
Foremost to understanding human performance is knowing that people do what makes sense to them given the available cues, tools, and focus of their attention at the time. Simply put, people come to work to do a good job – if it made sense for them to do what they did, it will make sense to others given similar conditions. The following factors significantly shape human performance and should be the focus of any human error investigation:

Physical Environment
Environment, tools, procedures, process design
Organizational Culture
Just- or blame-culture, attitude towards error
Management and Supervision
Management of personnel, training, procedures
Stress Factors
Personal, circumstantial, organizational

We do not want to see or experience human error – but when we do, it’s imperative to view it as a valuable opportunity to improve the system or process. This mindset is the heart of effective human error prevention.

Conducting an Effective GEMBA Walk for Deviations

When conducting your GEMBA walk specifically for deviation investigation:

  • Arrive with a clear purpose and structured approach
  • Observe before asking questions
  • Document observations with photos when appropriate
  • Look for environmental factors that might not appear in reports
  • Pay attention to equipment configuration and conditions
  • Note how operators interact with the process or equipment

A deviation gemba is a cross-functional team meeting that is assembled where a potential deviation event occurred. Going to the gemba and “freezing the scene” as close as possible to the time the event occurred will yield valuable clues about the environment that existed at the time – and fresher memories will provide higher quality interviews. This gemba has specific objectives:

  • Obtain a common understanding of the event: what happened, when and where it happened, who observed it, who was involved – all the facts surrounding the event. Is it a deviation?
  • Clearly describe actions taken, or that need to be taken, to contain impact from the event: product quarantine, physical or mechanical interventions, management or regulatory notifications, etc.
  • Interview involved operators: ask open-ended questions, like how the event unfolded or was discovered, from their perspective, or how the event could have been prevented, in their opinion – insights from personnel experienced with the process can prove invaluable during an investigation.

Deviation GEMBA Tips

Typically there is time between when notification of a deviation gemba goes out and when the team is scheduled to assemble. It is important to come prepared to help facilitate an efficient gemba:

  • Assemble procedures and other relevant documents and records. This will make references easier during the gemba.
  • Keep your team on-track – the gemba should end with the team having a common understanding of the event, actions taken to contain impact, and the agreed-upon next steps of the investigation.

You will gain plenty of investigational leads from your observations and interviews at the gemba – which documents to review, which personnel to interview, which equipment history to inspect, and more. The gemba is such an invaluable experience that, for many minor events, root cause and CAPA can be determined fairly easily from information gathered solely at the gemba.

Informal Rubric for Conducting a Good Deviation GEMBA

  • Describe the timeliness of the team gathering at the gemba.
  • Were all required roles and experts present?
  • Was someone leading or facilitating the gemba?
  • Describe any interviews the team performed during the gemba.
  • Did the team get sidetracked or off-topic during the gemba
  • Was the team prepared with relevant documentation or information?
  • Did the team determine batch impact and any reportability requirements?
  • Did the team satisfy the objectives of the gemba?
  • What did the team do well?
  • What could the team improve upon?

Speaking with Operators: The Power of Cognitive Interviewing

Interviewing personnel who were present when the deviation occurred requires special techniques to elicit accurate, complete information. Traditional questioning often fails to capture critical details.

Cognitive interviewing, as I outlined in my previous post on “Interviewing,” was originally created for law enforcement and later adopted during accident investigations by the National Transportation Safety Board (NTSB). This approach is based on two key principles:

  • Witnesses need time and encouragement to recall information
  • Retrieval cues enhance memory recall

How to Apply Cognitive Interviewing in Deviation Investigations

  • Mental Reinstatement: Encourage the interviewee to mentally recreate the environment and people involved
  • In-Depth Reporting: Encourage the reporting of all the details, even if it is minor or not directly related
  • Multiple Perspectives: Ask the interviewee to recall the event from others’ points of view
  • Several Orders: Ask the interviewee to recount the timeline in different ways. Beginning to end, end to beginning

Most importantly, conduct these interviews at the actual location where the deviation occurred. A key part of this is that retrieval cues access memory. This is why doing the interview on the scene (or Gemba) is so effective.

ComponentWhat It Consists of
Mental ReinstatementEncourage the interviewee to mentally recreate the environment and people involved.
In-Depth ReportingEncourage the reporting of all the details.
Multiple PerspectivesAsk the interviewee to recall the event from others’ points of view.
Several OrdersAsk the interviewee to recount the timeline in different ways.
  • Approach the Interviewee Positively:
    • Ask for the interview.
    • State the purpose of the interview.
    • Tell interviewee why he/she was selected.
    • Avoid statements that imply blame.
    • Focus on the need to capture knowledge
    • Answer questions about the interview.
    • Acknowledge and respond to concerns.
    • Manage negative emotions.
  • Apply these Four Components:
    • Use mental reinstatement.
    • Report everything.
    • Change the perspective.
    • Change the order.
  • Apply these Two Principles:
    • Witnesses need time and encouragement to recall information.
    • Retrieval cues enhance memory recall.
  • Demonstrate these Skills:
    • Recreate the original context and had them walk you through process.
    • Tell the witness to actively generate information.
    • Adopt the witness’s perspective.
    • Listen actively, do not interrupt, and pause before asking follow-up questions.
    • Ask open-ended questions.
    • Encourage the witness to use imagery.
    • Perform interview at the Gemba.
    • Follow sequence of the four major components.
    • Bring support materials.
    • Establish a connection with the witness.
    • Do Not tell them how they made the mistake.

Initial Impact Assessment: Understanding the Scope

Within the first 24 hours, a preliminary impact assessment is essential for determining the scope of the deviation and the appropriate response.

  • Apply a risk-based approach to categorize the deviation as critical, major, or minor
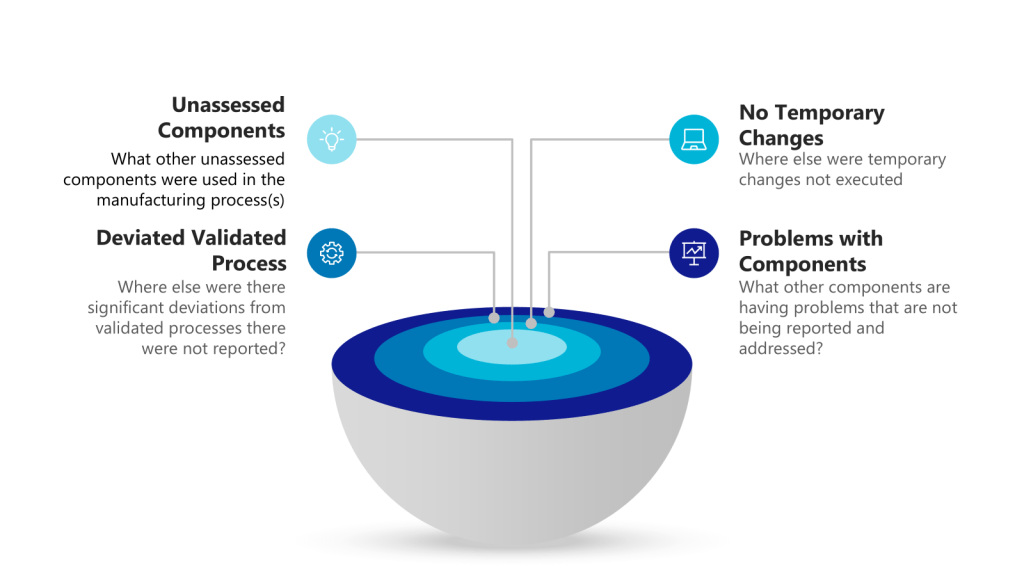
  • Evaluate all potentially affected products, materials, or batches
  • Consider potential effects on critical quality attributes
  • Assess possible regulatory implications
  • Determine if released products may be affected

This impact assessment is also the initial risk assessment, which will help guide the level of effort put into the deviation.

Factors to Consider in Initial Risk Assessment

  • Patient safety implications
  • Product quality impact
  • Compliance with registered specifications
  • Potential for impact on other batches or products
  • Regulatory reporting requirements
  • Level of investigation required

This initial assessment will guide subsequent decisions about quarantine, notification requirements, and the depth of investigation needed. Remember, this is a preliminary assessment that will be refined as the investigation progresses.

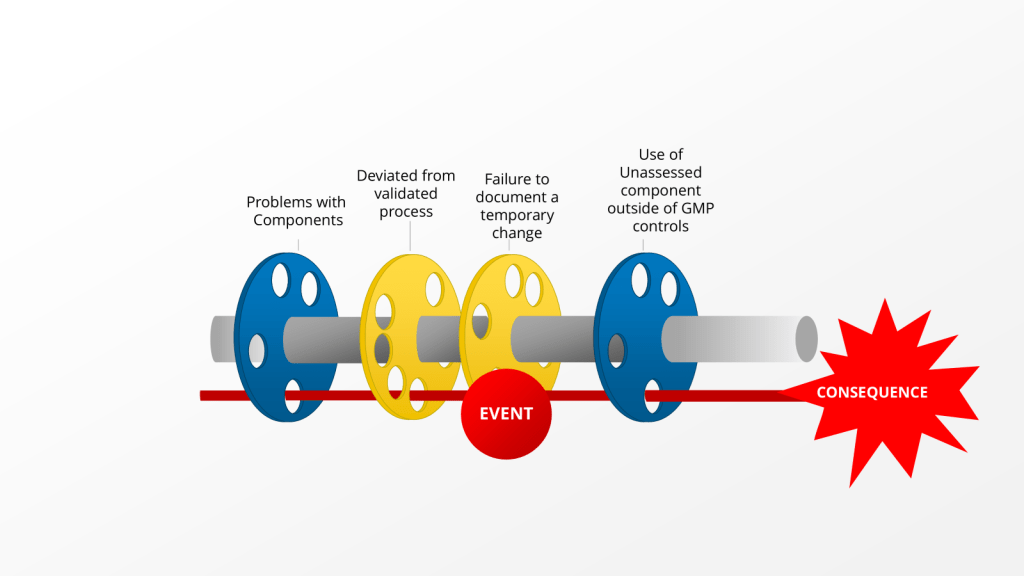
Immediate Actions: Containing the Issue

Once you’ve identified the deviation and assessed its potential impact, immediate actions must be taken to contain the issue and prevent further risk.

  • Quarantine potentially affected products or materials to prevent their release or further use
  • Notify key stakeholders, including quality assurance, production supervision, and relevant department heads
  • Implement temporary corrective or containment measures
  • Document the deviation in your quality management system
  • Secure relevant evidence and documentation
  • Consider whether to stop related processes

Industry best practices emphasize that you should Report the deviation in real-time. Notify QA within 24 hours and hold the GEMBA. Remember that “if you don’t document it, it didn’t happen” – thorough documentation of both the deviation and your immediate response is essential.

Affected vs Related Batches

Not every Impact is the same, so it can be helpful to have two concepts: Affected and Related.

  • Affected Batch:  Product directly impacted by the event at the time of discovery, for instance, the batch being manufactured or tested when the deviation occurred.
  • Related Batch:  Product manufactured or tested under the same conditions or parameters using the process in which the deviation occurred and determined as part of the deviation investigation process to have no impact on product quality.

Setting Up for a Successful Full Investigation

The final step in the golden day is establishing the foundation for the comprehensive investigation that will follow.

  • Assemble a cross-functional investigation team with relevant expertise
  • Define clear roles and responsibilities for team members
  • Establish a timeline for the investigation (remembering the 30-day guideline)
  • Identify additional data or evidence that needs to be collected
  • Plan for any necessary testing or analysis
  • Schedule follow-up interviews or observations

In my post on handling deviations, I emphasized that you must perform a time-sensitive and thorough investigation within 30 days. The groundwork laid during the golden day will make this timeline achievable while maintaining investigation quality.

Planning for Root Cause Analysis

During this setup phase, you should also begin planning which root cause analysis tools might be most appropriate for your investigation. Select tools based on the event complexity and the number of potential root causes and when “human error” appears to be involved, prepare to dig deeper as this is rarely the true root cause

Identifying Phase of your Investigation

IfThen you are at
The problem is not understood. Boundaries have not been set. There could be more than one problemProblem Understanding
Data needs to be collected. There are questions about frequency or occurrence. You have not had interviewsData Collection
Data has been collected but not analyszedData Analysis
The root cause needs to be determined from the analyzed dataIdentify Root Cause
Root Cause Analysis Tools Chart body { font-family: Arial, sans-serif; line-height: 1.6; margin: 20px; } table { border-collapse: collapse; width: 100%; margin-bottom: 20px; } th, td { border: 1px solid ; padding: 8px 12px; vertical-align: top; } th { background-color: ; font-weight: bold; text-align: left; } tr:nth-child(even) { background-color: ; } .purpose-cell { font-weight: bold; } h1 { text-align: center; color: ; } ul { margin: 0; padding-left: 20px; }

Root Cause Analysis Tools Chart

Purpose Tool Description
Problem Understanding Process Map A picture of the separate steps of a process in sequential order, including:
  • materials or services entering or leaving the process (inputs and outputs)
  • decisions that must be made
  • people who become involved
  • time involved at each step, and/or
  • process measurements.
Critical Incident Technique (CIT) A process used for collecting direct observations of human behavior that
  • have critical significance, and
  • meet methodically defined criteria.
Comparative Analysis A technique that focuses a problem-solving team on a problem. It compares one or more elements of a problem or process to evaluate elements that are similar or different (e.g. comparing a standard process to a failing process).
Performance Matrix A tool that describes the participation by various roles in completing tasks or deliverables for a project or business process.
Note: It is especially useful in clarifying roles and responsibilities in cross-functional/departmental positions.
5W2H Analysis An approach that defines a problem and its underlying contributing factors by systematically asking questions related to who, what, when, where, why, how, and how much/often.
Data Collection Surveys A technique for gathering data from a targeted audience based on a standard set of criteria.
Check Sheets A technique to compile data or observations to detect and show trends/patterns.
Cognitive Interview An interview technique used by investigators to help the interviewee recall specific memories from a specific event.
KNOT Chart A data collection and classification tool to organize data based on what is
  • Known
  • Need to know
  • Opinion, and
  • Think we know.
Data Analysis Pareto Chart A technique that focuses efforts on problems offering the greatest potential for improvement.
Histogram A tool that
  • summarizes data collected over a period of time, and
  • graphically presents frequency distribution.
Scatter Chart A tool to study possible relationships between changes in two different sets of variables.
Run Chart A tool that captures study data for trends/patterns over time.
Affinity Diagram A technique for brainstorming and summarizing ideas into natural groupings to understand a problem.
Root Cause Analysis Interrelationship Digraphs A tool to identify, analyze, and classify cause and effect relationships among issues so that drivers become part of an effective solution.
Why-Why A technique that allows one to explore the cause-and-effect relationships of a particular problem by asking why; drilling down through the underlying contributing causes to identify root cause.
Is/Is Not A technique that guides the search for causes of a problem by isolating the who, what, when, where, and how of an event. It narrows the investigation to factors that have an impact and eliminates factors that do not have an impact. By comparing what the problem is with what the problem is not, we can see what is distinctive about a problem which leads to possible causes.
Structured Brainstorming A technique to identify, explore, and display the
  • factors within each root cause category that may be affecting the problem/issue, and/or
  • effect being studied through this structured idea-generating tool.
Cause and Effect Diagram (Ishikawa/Fishbone) A tool to display potential causes of an event based on root cause categories defined by structured brainstorming using this tool as a visual aid.
Causal Factor Charting A tool to
  • analyze human factors and behaviors that contribute to errors, and
  • identify behavior-influencing factors and gaps.
Other Tools Prioritization Matrix A tool to systematically compare choices through applying and weighting criteria.
Control Chart A tool to monitor process performance over time by studying its variation and source.
Process Capability A tool to determine whether a process is capable of meeting requirements or specifications.

Making the Most of Your Golden Day

The first 24 hours after discovering a deviation represent a unique opportunity that should not be wasted. By following the structured approach outlined in this post-identifying the problem clearly, going to the GEMBA, interviewing operators using cognitive techniques, conducting an initial impact assessment, taking immediate containment actions, and setting up for the full investigation-you maximize the value of this golden day.

Remember that excellent deviation management is directly linked to product quality, patient safety, and regulatory compliance. Each well-managed deviation is an opportunity to strengthen your quality system.

I encourage you to assess your current approach to the first 24 hours of deviation management. Are you capturing the full value of this golden day, or are you letting critical information slip away? Implement these strategies, train your team on proper deviation triage, and transform your deviation response from reactive to proactive.

Your deviation management effectiveness doesn’t begin when the investigation report is initiated-it begins the moment a deviation is discovered. Make that golden day count.

You Gotta Have Heart: Combating Human Error

The persistent attribution of human error as a root cause deviations reveals far more about systemic weaknesses than individual failings. The label often masks deeper organizational, procedural, and cultural flaws. Like cracks in a foundation, recurring human errors signal where quality management systems (QMS) fail to account for the complexities of human cognition, communication, and operational realities.

The Myth of Human Error as a Root Cause

Regulatory agencies increasingly reject “human error” as an acceptable conclusion in deviation investigations. This shift recognizes that human actions occur within a web of systemic influences. A technician’s missed documentation step or a formulation error rarely stem from carelessness alone but emerge from:

The aviation industry’s “Tower of Babel” problem—where siloed teams develop isolated communication loops—parallels pharmaceutical manufacturing. The Quality Unit may prioritize regulatory compliance, while production focuses on throughput, creating disjointed interpretations of “quality.” These disconnects manifest as errors when cross-functional risks go unaddressed.

Cognitive Architecture and Error Propagation

Human cognition operates under predictable constraints. Attentional biases, memory limitations, and heuristic decision-making—while evolutionarily advantageous—create vulnerabilities in GMP environments. For example:

  • Attentional tunneling: An operator hyper-focused on solving a equipment jam may overlook a temperature excursion alert.
  • Procedural drift: Subtle deviations from written protocols accumulate over time as workers optimize for perceived efficiency.
  • Complacency cycles: Over-familiarity with routine tasks reduces vigilance, particularly during night shifts or prolonged operations.

These cognitive patterns aren’t failures but features of human neurobiology. Effective QMS design anticipates them through:

  1. Error-proofing: Automated checkpoints that detect deviations before critical process stages
  2. Cognitive load management: Procedures (including batch records) tailored to cognitive load principles with decision-support prompts
  3. Resilience engineering: Simulations that train teams to recognize and recover from near-misses

Strategies for Reframing Human Error Analysis

Conduct Cognitive Autopsies

Move beyond 5-Whys to adopt human factors analysis frameworks:

  • Human Error Assessment and Reduction Technique (HEART): Quantifies the likelihood of specific error types based on task characteristics
  • Critical Action and Decision (CAD) timelines: Maps decision points where system defenses failed

For example, a labeling mix-up might reveal:

  • Task factors: Nearly identical packaging for two products (29% contribution to error likelihood)
  • Environmental factors: Poor lighting in labeling area (18%)
  • Organizational factors: Inadequate change control when adding new SKUs (53%)

Redesign for Intuitive Use

The redesign of for intuitive use requires multilayered approaches based on understand how human brains actually work. At the foundation lies procedural chunking, an evidence-based method that restructures complex standard operating procedures (SOPs) into digestible cognitive units aligned with working memory limitations. This approach segments multiphase processes like aseptic filling into discrete verification checkpoints, reducing cognitive overload while maintaining procedural integrity through sequenced validation gates. By mirroring the brain’s natural pattern recognition capabilities, chunked protocols demonstrate significantly higher compliance rates compared to traditional monolithic SOP formats.

Complementing this cognitive scaffolding, mistake-proof redesigns create inherent error detection mechanisms.

To sustain these engineered safeguards, progressive facilities implement peer-to-peer audit protocols during critical operations and transition periods.

Leverage Error Data Analytics

The integration of data analytics into organizational processes has emerged as a critical strategy for minimizing human error, enhancing accuracy, and driving informed decision-making. By leveraging advanced computational techniques, automation, and machine learning, data analytics addresses systemic vulnerabilities.

Human Error Assessment and Reduction Technique (HEART): A Systematic Framework for Error Mitigation

Benefits of the Human Error Assessment and Reduction Technique (HEART)

1. Simplicity and Speed: HEART is designed to be straightforward and does not require complex tools, software, or large datasets. This makes it accessible to organizations without extensive human factors expertise and allows for rapid assessments. The method is easy to understand and apply, even in time-constrained or resource-limited environments.

2. Flexibility and Broad Applicability: HEART can be used across a wide range of industries—including nuclear, healthcare, aviation, rail, process industries, and engineering—due to its generic task classification and adaptability to different operational contexts. It is suitable for both routine and complex tasks.

3. Systematic Identification of Error Influences: The technique systematically identifies and quantifies Error Producing Conditions (EPCs) that increase the likelihood of human error. This structured approach helps organizations recognize the specific factors—such as time pressure, distractions, or poor procedures—that most affect reliability.

4. Quantitative Error Prediction: HEART provides a numerical estimate of human error probability for specific tasks, which can be incorporated into broader risk assessments, safety cases, or design reviews. This quantification supports evidence-based decision-making and prioritization of interventions.

5. Actionable Risk Reduction: By highlighting which EPCs most contribute to error, HEART offers direct guidance on where to focus improvement efforts—whether through engineering redesign, training, procedural changes, or automation. This can lead to reduced error rates, improved safety, fewer incidents, and increased productivity.

6. Supports Accident Investigation and Design: HEART is not only a predictive tool but also valuable in investigating incidents and guiding the design of safer systems and procedures. It helps clarify how and why errors occurred, supporting root cause analysis and preventive action planning.

7. Encourages Safety and Quality Culture and Awareness: Regular use of HEART increases awareness of human error risks and the importance of control measures among staff and management, fostering a proactive culture.

When Is HEART Best Used?

  • Risk Assessment for Critical Tasks: When evaluating tasks where human error could have severe consequences (e.g., operating nuclear control systems, administering medication, critical maintenance), HEART helps quantify and reduce those risks.
  • Design and Review of Procedures: During the design or revision of operational procedures, HEART can identify steps most vulnerable to error and suggest targeted improvements.
  • Incident Investigation: After an failure or near-miss, HEART helps reconstruct the event, identify contributing EPCs, and recommend changes to prevent recurrence.
  • Training and Competence Assessment: HEART can inform training programs by highlighting the conditions and tasks where errors are most likely, allowing for focused skill development and awareness.
  • Resource-Limited or Fast-Paced Environments: Its simplicity and speed make HEART ideal for organizations needing quick, reliable human error assessments without extensive resources or data.

Generic Task Types (GTTs): Establishing Baselines

HEART classifies human activities into nine Generic Task Types (GTT) with predefined nominal human error probabilities (NHEPs) derived from decades of industrial incident data:

GTT CodeTask DescriptionNominal HEP Range
AComplex, novel tasks requiring problem-solving0.55 (0.35–0.97)
BShifting attention between multiple systems0.26 (0.14–0.42)
CHigh-skill tasks under time constraints0.16 (0.12–0.28)
DRule-based diagnostics under stress0.09 (0.06–0.13)
ERoutine procedural tasks0.02 (0.007–0.045)
FRestoring system states0.003 (0.0008–0.007)
GHighly practiced routine operations0.0004 (0.00008–0.009)
HSupervised automated actions0.00002 (0.000006–0.0009)
MMiscellaneous/undefined tasks0.003 (0.008–0.11)

Comprehensive Taxonomy of Error-Producing Conditions (EPCs)

HEART’s 38 Error Producing Conditionss represent contextual amplifiers of error probability, categorized under the 4M Framework (Man, Machine, Media, Management):

EPC CodeDescriptionMax Effect4M Category
1Unfamiliarity with task17×Man
2Time shortage11×Management
3Low signal-to-noise ratio10×Machine
4Override capability of safety featuresMachine
5Spatial/functional incompatibilityMachine
6Model mismatch between mental and system statesMan
7Irreversible actionsMachine
8Channel overload (information density)Media
9Technique unlearningMan
10Inadequate knowledge transfer5.5×Management
11Performance ambiguityMedia
12Misperception of riskMan
13Poor feedback systemsMachine
14Delayed/incomplete feedbackMedia
15Operator inexperienceMan
16Impoverished information qualityMedia
17Inadequate checking proceduresManagement
18Conflicting objectives2.5×Management
19Lack of information diversity2.5×Media
20Educational/training mismatchManagement
21Dangerous incentivesManagement
22Lack of skill practice1.8×Man
23Unreliable instrumentation1.6×Machine
24Need for absolute judgments1.6×Man
25Unclear functional allocation1.6×Management
26No progress tracking1.4×Media
27Physical capability mismatches1.4×Man
28Low semantic meaning of information1.4×Media
29Emotional stress1.3×Man
30Ill-health1.2×Man
31Low workforce morale1.2×Management
32Inconsistent interface design1.15×Machine
33Poor environmental conditions1.1×Media
34Low mental workload1.1×Man
35Circadian rhythm disruption1.06×Man
36External task pacing1.03×Management
37Supernumerary staffing issues1.03×Management
38Age-related capability decline1.02×Man

HEP Calculation Methodology

The HEART equation incorporates both multiplicative and additive effects of EPCs:

Where:

  • NHEP: Nominal Human Error Probability from GTT
  • EPC_i: Maximum effect of i-th EPC
  • APOE_i: Assessed Proportion of Effect (0–1)

HEART Case Study: Operator Error During Biologics Drug Substance Manufacturing

A biotech facility was producing a monoclonal antibody (mAb) drug substance using mammalian cell culture in large-scale bioreactors. The process involved upstream cell culture (expansion and production), followed by downstream purification (protein A chromatography, filtration), and final bulk drug substance filling. The manufacturing process required strict adherence to parameters such as temperature, pH, and feed rates to ensure product quality, safety, and potency.

During a late-night shift, an operator was responsible for initiating a nutrient feed into a 2,000L production bioreactor. The standard operating procedure (SOP) required the feed to be started at 48 hours post-inoculation, with a precise flow rate of 1.5 L/hr for 12 hours. The operator, under time pressure and after a recent shift change, incorrectly programmed the feed rate as 15 L/hr rather than 1.5 L/hr.

Outcome:

  • The rapid addition of nutrients caused a metabolic imbalance, leading to excessive cell growth, increased waste metabolite (lactate/ammonia) accumulation, and a sharp drop in product titer and purity.
  • The batch failed to meet quality specifications for potency and purity, resulting in the loss of an entire production lot.
  • Investigation revealed no system alarms for the high feed rate, and the error was only detected during routine in-process testing several hours later.

HEART Analysis

Task Definition

  • Task: Programming and initiating nutrient feed in a GMP biologics manufacturing bioreactor.
  • Criticality: Direct impact on cell culture health, product yield, and batch quality.

Generic Task Type (GTT)

GTT CodeDescriptionNominal HEP
ERoutine procedural task with checking0.02

Error-Producing Conditions (EPCs) Using the 5M Model

5M CategoryEPC (HEART)Max EffectAPOEExample in Incident
ManInexperience with new feed system (EPC15)0.8Operator recently trained on upgraded control interface
MachinePoor feedback (no alarm for high feed rate, EPC13)0.7System did not alert on out-of-range input
MediaAmbiguous SOP wording (EPC11)0.5SOP listed feed rate as “1.5L/hr” in a table, not text
ManagementTime pressure to meet batch deadlines (EPC2)11×0.6Shift was behind schedule due to earlier equipment delay
MilieuDistraction during shift change (EPC36)1.03×0.9Handover occurred mid-setup, leading to divided attention

Human Error Probability (HEP) Calculation

HEP ≈ 3.5 (350%)
This extremely high error probability highlights a systemic vulnerability, not just an individual lapse.

Root Cause and Contributing Factors

  • Operator: Recently trained, unfamiliar with new interface (Man)
  • System: No feedback or alarm for out-of-spec feed rate (Machine)
  • SOP: Ambiguous presentation of critical parameter (Media)
  • Management: High pressure to recover lost time (Management)
  • Environment: Shift handover mid-task, causing distraction (Milieu)

Corrective Actions

Technical Controls

  • Automated Range Checks: Bioreactor control software now prevents entry of feed rates outside validated ranges and requires supervisor override for exceptions.
  • Visual SOP Enhancements: Critical parameters are now highlighted in both text and tables, and reviewed during operator training.

Human Factors & Training

  • Simulation-Based Training: Operators practice feed setup in a virtual environment simulating distractions and time pressure.
  • Shift Handover Protocol: Critical steps cannot be performed during handover periods; tasks must be paused or completed before/after shift changes.

Management & Environmental Controls

  • Production Scheduling: Buffer time added to schedules to reduce time pressure during critical steps.
  • Alarm System Upgrade: Real-time alerts for any parameter entry outside validated ranges.

Outcomes (6-Month Review)

MetricPre-InterventionPost-Intervention
Feed rate programming errors4/year0/year
Batch failures (due to feed)2/year0/year
Operator confidence (survey)62/10091/100

Lessons Learned

  • Systemic Safeguards: Reliance on operator vigilance alone is insufficient in complex biologics manufacturing; layered controls are essential.
  • Human Factors: Addressing EPCs across the 5M model—Man, Machine, Media, Management, Milieu—dramatically reduces error probability.
  • Continuous Improvement: Regular review of near-misses and operator feedback is crucial for maintaining process robustness in biologics manufacturing.

This case underscores how a HEART-based approach, tailored to biologics drug substance manufacturing, can identify and mitigate multi-factorial risks before they result in costly failures.

How Many M’s Again

Among the most enduring tools of root cause analysis are the M-based frameworks, which categorize contributing factors to problems using mnemonic classifications. These frameworks have evolved significantly over decades, expanding from the foundational 4M Analysis to more comprehensive models like 5M, 6M, and even 8M. This progression reflects the growing complexity of industrial processes, the need for granular problem-solving, and the integration of human and systemic factors into quality control.

Origins of the 4M Framework

The 4M Analysis emerged in the mid-20th century as part of Japan’s post-war industrial resurgence. Developed by Kaoru Ishikawa, a pioneer in quality management, the framework was initially embedded within the Fishbone Diagram (Ishikawa Diagram), a visual tool for identifying causes of defects. The original four categories—Manpower, Machine, Material, and Method—provided a structured approach to dissecting production issues.

Key Components of 4M

  1. Manpower: Human factors such as training, skill gaps, and communication.
  2. Machine: Equipment reliability, maintenance, and technological limitations.
  3. Material: Quality and suitability of raw materials or components.
  4. Method: Procedural inefficiencies, outdated workflows, or unclear standards.

This framework became integral to Total Productive Maintenance (TPM) and lean manufacturing, where it was used to systematically reduce variation and defects.

However, the 4M model had limitations. It often overlooked external environmental factors and measurement systems, which became critical as industries adopted stricter quality benchmarks.

Expansion to 5M and 5M+E

To address these gaps, the 5M Model introduced Measurement as a fifth category, recognizing that inaccurate data collection or calibration errors could skew process outcomes. For instance, in pharmaceutical production, deviations in process weight might stem from faulty scales (Measurement) rather than the raw materials themselves.

Concurrently, the 5M+E variant added Environment (or Milieu) to account for external conditions such as temperature, humidity, or regulatory changes. This was particularly relevant in industries like food processing, where storage conditions directly impact product safety. The 5M+E framework thus became a staple in sectors requiring rigorous environmental controls.

The Rise of 6M and Specialized Variations

The 6M model addresses gaps in earlier iterations like the 4M framework by formalizing measurement and environmental factors as core variables. For instance, while the original 4M (Man, Machine, Material, Method) focused on internal production factors, the expanded 6M accounts for external influences like regulatory changes (Milieu) and data integrity (Measurement). This aligns with modern quality standards such as ISO 9001:2015, which emphasizes context-aware management systems.

Other versions of 6M Model further expanded the framework by incorporating Mother Nature (environmental factors) or Maintenance, depending on the industry. In agriculture, for instance, crop yield variations could be linked to drought (Mother Nature), while in manufacturing, machine downtime might trace to poor maintenance schedules.

6M model
M FactorDescriptionKey Insights
ManpowerHuman resources involved in processes, including skills, training, and communication– Skill gaps or inadequate training directly impact error rates
– Poor communication hierarchies exacerbate operational inefficiencies
– Workforce diversity and engagement improve problem-solving agility
MethodProcedures, workflows, and protocols governing operations– Outdated methods create bottlenecks
– Overly rigid procedures stifle innovation
– Standardized workflows reduce process variation by 30-50%
MachineEquipment, tools, and technological infrastructure– Uncalibrated machinery accounts for 23% of manufacturing defects
– Predictive maintenance reduces downtime by 40%
– Aging equipment increases energy costs by 15-20%
MaterialRaw inputs, components, and consumables– Supplier quality variances cause 18% of production rework
– Material traceability systems reduce recall risks by 65%
MilieuEnvironmental conditions (temperature, humidity, regulatory landscape)– Temperature fluctuations alter material properties in 37% of pharma cases
– OSHA compliance reduces workplace accidents by 52%
– Climate-controlled storage extends food product shelf life by 30%
MeasurementData collection systems, metrics, and calibration processes– Uncalibrated sensors create 12% margin of error in aerospace measurements
– Real-time data analytics improve defect detection rates by 44%
– KPIs aligned with strategic goals increase operational transparency

Industry-Specific Adaptations

  • Healthcare: Adapted 6Ms include Medication, Metrics, and Milieu to address patient safety.
  • Software Development: Categories like Markets and Money are added to analyze project failures.
  • Finance: 5M+P (People, Process, Platform, Partners, Profit) shifts focus to operational and market risks.

These adaptations highlight the framework’s flexibility.

Beyond 6M: 8M and Hybrid Models

In complex systems, some organizations adopt 8M Models, adding Management and Mission to address leadership and strategic alignment. The original 5M framework already included these elements, but their revival underscores the importance of organizational culture in problem-solving. For example, the 4M4(5)E model used in maritime safety analyzes accidents through Man, Machine, Media, Management, Education, Engineering, Enforcement, Example, and Environment.

Integration with RCA Tools

The M frameworks should never be used in isolation. They complement tools like:

  • Why-Whys: Drills down into each M category to uncover root causes.
  • Fishbone Diagrams: Visualizes interactions between Ms31015.
  • FMEA (Failure Mode Effects Analysis): Prioritizes risks within each M.

Contemporary Applications and Challenges

Modern iterations of M frameworks emphasize inclusivity and adaptability. The 5M+P model replaces “Man” with “People” to reflect diverse workforces, while AI-driven factories integrate Machine Learning as a new M. However, challenges persist:

  • Overcomplication: Adding too many categories can dilute focus.
  • Subjectivity: Teams may prioritize familiar Ms over less obvious factors.
  • Dynamic Environments: Rapid technological change necessitates continual framework updates.

Conclusion

The evolution from 4M to 6M and beyond illustrates the iterative nature of quality management. Each expansion reflects deeper insights into how people, processes, and environments interact to create—or resolve—operational challenges. These frameworks will continue to adapt, offering structured yet flexible approaches to root cause analysis. Organizations that master their application will not only solve problems more effectively but also foster cultures of continuous improvement and innovation.

When to Widen the Investigation

“there is no retrospective review of batch records for batches within expiry, to identify any other process deviations performed without the appropriate corresponding documentation including risk assessment(s).” – 2025 Warning Letter from the US FDA to Sanofi

This comment is about an instance where Sanofi deviated from the validated process by using an unvalidated single use component. Instead of self-identifying, creating a deviation and doing the right change control activities, the company just kept on deviating by using a non-controlled document.

This is a big problem for lots of reasons, from uncontrolled documents, to not using the change control system, to breaking the validated state. What the language quoted above really brings to bear is the question, when should we evaluate our records for other similar instances of this happening, so we can address it.

When a deviation investigation reveals recurring bad decision-making, it is crucial to expand the investigation and conduct a retrospective review of batch records. A good cutoff of this can be only for batches within expiry. This expanded investigation helps identify any other process deviations that may have occurred but were not discovered or documented at the time. Here’s when and how to approach this situation:

Triggers for Expanding the Investigation

  1. Recurring Deviations: If the same or similar deviations are found to be recurring, it indicates a systemic issue that requires a broader investigation.
  2. Pattern of Human Errors: When a pattern of human errors or poor decision-making is identified, it suggests potential underlying issues in training, procedures, or processes.
  3. Critical Deviations: For deviations classified as critical, a more thorough investigation is typically warranted, including a retrospective review.
  4. Potential Impact on Product Quality: If there’s a strong possibility that undiscovered deviations could affect product quality or patient safety, an expanded investigation becomes necessary.

Conducting the Retrospective Review

  1. Timeframe: Review batch records for all batches within expiry, typically covering at least two years of production. Similarily for issues in the FUSE program you might look since the last requalification, or from a decide to go backwards in concentric circles based on what you find.
  2. Scope: Examine not only the specific process where the deviation was found but also related processes or areas that could be affected. Reviewing related processes is critical.
  3. Data Analysis: Utilize statistical tools and trending analysis techniques to identify patterns or anomalies in the historical data.
  4. Cross-Functional Approach: Involve a team of subject matter experts from relevant departments to ensure a comprehensive review.
  5. Documentation Review: Examine batch production records, laboratory control records, equipment logs, and any other relevant documentation.
  6. Root Cause Analysis: Apply root cause analysis techniques to understand the underlying reasons for the recurring issues.

Key Considerations

  • Risk Assessment: Prioritize the review based on the potential risk to product quality and patient safety.
  • Data Integrity: Ensure that any retrospective data used is reliable and has maintained its integrity.
  • Corrective Actions: Develop and implement corrective and preventive actions (CAPAs) based on the findings of the expanded investigation.
  • Regulatory Reporting: Assess the need for notifying regulatory authorities based on the severity and impact of the findings.

By conducting a thorough retrospective review when recurring bad decision-making is identified, companies can uncover hidden issues, improve their quality systems, and prevent future deviations. This proactive approach not only enhances compliance but also contributes to continuous improvement in pharmaceutical manufacturing processes.

In the case of an issue that rises to a regulatory observation this becomes a firm must. The agency has raised a significant concern and they will want proof that this is a limited issue or that you are holistically dealing with it across the organization.

Concentric Circles of Investigation

Each layer of the investigation may require holistic looks. Utilizing the example above we have:

Layer of ProblemFurther Investigation to Answer
Use of unassessed component outside of GMP controlsWhat other unassessed components were used in the manufacturing process(s)
Failure to document a temporary changeWhere else were temporary changes not executed
Deviated from validated processWhere else were there significant deviations from validated processes there were not reported
Problems with componentsWhat other components are having problems that are not being reported and addressed

Take a risk-based approach here is critical.

Determining Causative Laboratory Error in Bioburden, Endotoxin, and Environmental Monitoring OOS Results

In the previous post, we discussed the critical importance of thorough investigations into deviations, as highlighted by the recent FDA warning letter to Sanofi. Let us delve deeper into a specific aspect of these investigations: determining whether an invalidated out-of-specification (OOS) result for bioburden, endotoxin, or environmental monitoring action limit excursions conclusively demonstrates causative laboratory error.

When faced with an OOS result in microbiological testing, it’s crucial to conduct a thorough investigation before invalidating the result. The FDA expects companies to provide scientific justification and evidence that conclusively demonstrates a causative laboratory error if a result is to be invalidated.

Key Steps in Evaluating Laboratory Error

1. Review of Test Method and Procedure

  • Examine the standard operating procedure (SOP) for the test method
  • Verify that all steps were followed correctly
  • Check for any deviations from the established procedure

2. Evaluation of Equipment and Materials

Evaluation of Equipment and Materials is a critical step in determining whether laboratory error caused an out-of-specification (OOS) result, particularly for bioburden, endotoxin, or environmental monitoring tests. Here’s a detailed approach to performing this evaluation:

Equipment Assessment

Functionality Check
  • Run performance verification tests on key equipment used in the analysis
  • Review equipment logs for any recent malfunctions or irregularities
  • Verify that all equipment settings were correct for the specific test performed
Calibration Review
  • Check calibration records to ensure equipment was within its calibration period
  • Verify that calibration standards used were traceable and not expired
  • Review any recent calibration data for trends or shifts
Maintenance Evaluation
  • Examine maintenance logs for adherence to scheduled maintenance
  • Look for any recent repairs or adjustments that could affect performance
  • Verify that all preventive maintenance tasks were completed as required

Materials Evaluation

Reagent Quality Control
  • Check expiration dates of all reagents used in the test
  • Review storage conditions to ensure reagents were stored properly
  • Verify that quality control checks were performed on reagents before use
Media Assessment (for Bioburden and Environmental Monitoring)
  • Review growth promotion test results for culture media
  • Check pH and sterility of prepared media
  • Verify that media was stored at the correct temperature
Water Quality (for Endotoxin Testing)
  • Review records of water quality used for reagent preparation
  • Check for any recent changes in water purification systems
  • Verify endotoxin levels in water used for testing

Environmental Factors

Laboratory Conditions
  • Review temperature and humidity logs for the testing area
  • Check for any unusual events (e.g., power outages, HVAC issues) around the time of testing
  • Verify that environmental conditions met the requirements for the test method
Contamination Control
  • Examine cleaning logs for the laboratory area and equipment
  • Review recent environmental monitoring results for the testing area
  • Check for any breaches in aseptic technique during testing

Documentation Review

Standard Operating Procedures (SOPs)
  • Verify that the most current version of the SOP was used
  • Check for any recent changes to the SOP that might affect the test
  • Ensure all steps in the SOP were followed and documented
Equipment and Material Certifications
  • Review certificates of analysis for critical reagents and standards
  • Check equipment qualification documents (IQ/OQ/PQ) for compliance
  • Verify that all required certifications were current at the time of testing

By thoroughly evaluating equipment and materials using these detailed steps, laboratories can more conclusively determine whether an OOS result was due to laboratory error or represents a true product quality issue. This comprehensive approach helps ensure the integrity of microbiological testing and supports robust quality control in pharmaceutical manufacturing.

3. Assessment of Analyst Performance

Here are key aspects to consider when evaluating analyst performance during an OOS investigation:

Review Training Records

  • Examine the analyst’s training documentation to ensure they are qualified to perform the specific test method.
  • Verify that the analyst has completed all required periodic refresher training.
  • Check if the analyst has demonstrated proficiency in the particular test method recently.

Evaluate Recent Performance History

  • Review the analyst’s performance on similar tests over the past few months.
  • Look for any patterns or trends in the analyst’s results, such as consistently high or low readings.
  • Compare the analyst’s results with those of other analysts performing the same tests.

Conduct Interviews

  • Interview the analyst who performed the test to gather detailed information about the testing process.
  • Ask open-ended questions to encourage the analyst to describe any unusual occurrences or deviations from standard procedures.
  • Inquire about the analyst’s workload and any potential distractions during testing.

Observe Technique

  • If possible, have the analyst demonstrate the test method while being observed by a supervisor or senior analyst.
  • Pay attention to the analyst’s technique, including sample handling, reagent preparation, and equipment operation.
  • Note any deviations from standard operating procedures (SOPs) or good practices.

Review Documentation Practices

  • Examine the analyst’s laboratory notebooks and test records for completeness and accuracy.
  • Verify that all required information was recorded contemporaneously.
  • Check for any unusual notations or corrections in the documentation.

Assess Knowledge of Method and Equipment

  • Quiz the analyst on critical aspects of the test method and equipment operation.
  • Verify their understanding of acceptance criteria, potential sources of error, and troubleshooting procedures.
  • Ensure the analyst is aware of recent changes to SOPs or equipment calibration requirements.

Evaluate Workload and Environment

  • Consider the analyst’s workload at the time of testing, including any time pressures or competing priorities.
  • Assess the laboratory environment for potential distractions or interruptions that could have affected performance.
  • Review any recent changes in the analyst’s responsibilities or work schedule.

Perform Comparative Testing

  • Have another qualified analyst repeat the test using the same sample and equipment, if possible.
  • Compare the results to determine if there are significant discrepancies between analysts.
  • If discrepancies exist, investigate potential reasons for the differences.

Review Equipment Use Records

  • Check equipment logbooks to verify proper use and any noted issues during the time of testing.
  • Confirm that the analyst used the correct equipment and that it was properly calibrated and maintained.

Consider Human Factors

  • Assess any personal factors that could have affected the analyst’s performance, such as fatigue, illness, or personal stress.
  • Review the analyst’s work schedule leading up to the OOS result for any unusual patterns or extended hours.

By thoroughly assessing analyst performance using these methods, investigators can determine whether human error contributed to the OOS result and identify areas for improvement in training, procedures, or work environment. It’s important to approach this assessment objectively and supportively, focusing on systemic improvements rather than individual blame.

4. Examination of Environmental Factors

  • Review environmental monitoring data for the testing area
  • Check for any unusual events or conditions that could have affected the test

5. Data Analysis and Trending

  • Compare the OOS result with historical data and trends
  • Look for any patterns or anomalies that might explain the result

Conclusive vs. Inconclusive Evidence

Conclusive Evidence of Laboratory Error

To conclusively demonstrate laboratory error, you should be able to:

  • Identify a specific, documented error in the testing process
  • Reproduce the error and show how it leads to the OOS result
  • Demonstrate that correcting the error leads to an in-specification result

Examples of conclusive evidence might include:

  • Documented use of an expired reagent
  • Verified malfunction of testing equipment
  • Confirmed contamination of a negative control

Inconclusive Evidence

If the investigation reveals potential issues but cannot definitively link them to the OOS result, the evidence is considered inconclusive. This might include:

  • Minor deviations from SOPs that don’t clearly impact the result
  • Slight variations in environmental conditions
  • Analyst performance issues that aren’t directly tied to the specific test

Special Considerations for Microbiological Testing

Bioburden, endotoxin, and environmental monitoring tests present unique challenges due to their biological nature.

Bioburden Testing

  • Consider the possibility of sample contamination during collection or processing
  • Evaluate the recovery efficiency of the test method
  • Assess the potential for microbial growth during sample storage

Endotoxin Testing

  • Review the sample preparation process, including any dilution steps
  • Evaluate the potential for endotoxin masking or enhancement
  • Consider the impact of product formulation on the test method

Environmental Monitoring

  • Assess the sampling technique and equipment used
  • Consider the potential for transient environmental contamination
  • Evaluate the impact of recent cleaning or maintenance activities

Documenting the Investigation

Regardless of the outcome, it’s crucial to thoroughly document the investigation process. This documentation should include:

  • A clear description of the OOS result and initial observations
  • Detailed accounts of all investigative steps taken
  • Raw data and analytical results from the investigation
  • A comprehensive analysis of the evidence
  • A scientifically justified conclusion

Conclusion

Determining whether an invalidated OOS result conclusively demonstrates causative laboratory error requires a systematic, thorough, and well-documented investigation. For microbiological tests like bioburden, endotoxin, and environmental monitoring, this process can be particularly challenging due to the complex and sometimes variable nature of biological systems.

Remember, the goal is not to simply invalidate OOS results, but to understand the root cause and implement corrective and preventive actions. Only through rigorous investigation and continuous improvement can we ensure the quality and safety of pharmaceutical products. When investigating environmental and in-process results we are investigating the whole house of contamination control.