Over the past decades, as I’ve grown and now led quality organizations in biotechnology, I’ve encountered many thinkers who’ve shaped my approach to investigation and risk management. But few have fundamentally altered my perspective like Sidney Dekker. His work didn’t just add to my toolkit—it forced me to question some of my most basic assumptions about human error, system failure, and what it means to create genuinely effective quality systems.
Dekker’s challenge to move beyond “safety theater” toward authentic learning resonates deeply with my own frustrations about quality systems that look impressive on paper but fail when tested by real-world complexity.
Why Dekker Matters for Quality Leaders
Professor Sidney Dekker brings a unique combination of academic rigor and operational experience to safety science. As both a commercial airline pilot and the Director of the Safety Science Innovation Lab at Griffith University, he understands the gap between how work is supposed to happen and how it actually gets done. This dual perspective—practitioner and scholar—gives his critiques of traditional safety approaches unusual credibility.
But what initially drew me to Dekker’s work wasn’t his credentials. It was his ability to articulate something I’d been experiencing but couldn’t quite name: the growing disconnect between our increasingly sophisticated compliance systems and our actual ability to prevent quality problems. His concept of “drift into failure” provided a framework for understanding why organizations with excellent procedures and well-trained personnel still experience systemic breakdowns.
The “New View” Revolution
Dekker’s most fundamental contribution is what he calls the “new view” of human error—a complete reframing of how we understand system failures. Having spent years investigating deviations and CAPAs, I can attest to how transformative this shift in perspective can be.
The Traditional Approach I Used to Take:
Human error causes problems
People are unreliable; systems need protection from human variability
Solutions focus on better training, clearer procedures, more controls
Dekker’s New View That Changed My Practice:
Human error is a symptom of deeper systemic issues
People are the primary source of system reliability, not the threat to it
Variability and adaptation are what make complex systems work
This isn’t just academic theory—it has practical implications for every investigation I lead. When I encounter “operator error” in a deviation investigation, Dekker’s framework pushes me to ask different questions: What made this action reasonable to the operator at the time? What system conditions shaped their decision-making? How did our procedures and training actually perform under real-world conditions?
This shift aligns perfectly with the causal reasoning approaches I’ve been developing on this blog. Instead of stopping at “failure to follow procedure,” we dig into the specific mechanisms that drove the event—exactly what Dekker’s view demands.
Drift Into Failure: Why Good Organizations Go Bad
Perhaps Dekker’s most powerful concept for quality leaders is “drift into failure”—the idea that organizations gradually migrate toward disaster through seemingly rational local decisions. This isn’t sudden catastrophic failure; it’s incremental erosion of safety margins through competitive pressure, resource constraints, and normalized deviance.
I’ve seen this pattern repeatedly. For example, a cleaning validation program starts with robust protocols, but over time, small shortcuts accumulate: sampling points that are “difficult to access” get moved, hold times get shortened when production pressure increases, acceptance criteria get “clarified” in ways that gradually expand limits.
Each individual decision seems reasonable in isolation. But collectively, they represent drift—a gradual migration away from the original safety margins toward conditions that enable failure. The contamination events and data integrity issues that plague our industry often represent the endpoint of these drift processes, not sudden breakdowns in otherwise reliable systems.
Traditional root cause analysis seeks the single factor that “caused” an event, but complex system failures emerge from multiple interacting conditions. The take-the-best heuristic I’ve been exploring on this blog—focusing on the most causally powerful factor—builds directly on Dekker’s insight that we need to understand mechanisms, not hunt for someone to blame.
When I investigate a failure now, I’m not looking for THE root cause. I’m trying to understand how various factors combined to create conditions for failure. What pressures were operators experiencing? How did procedures perform under actual conditions? What information was available to decision-makers? What made their actions reasonable given their understanding of the situation?
This approach generates investigations that actually help prevent recurrence rather than just satisfying regulatory expectations for “complete” investigations.
Just Culture: Moving Beyond Blame
Dekker’s evolution of just culture thinking has been particularly influential in my leadership approach. His latest work moves beyond simple “blame-free” environments toward restorative justice principles—asking not “who broke the rule” but “who was hurt and how can we address underlying needs.”
This shift has practical implications for how I handle deviations and quality events. Instead of focusing on disciplinary action, I’m asking: What systemic conditions contributed to this outcome? What support do people need to succeed? How can we address the underlying vulnerabilities this event revealed?
This doesn’t mean eliminating accountability—it means creating accountability systems that actually improve performance rather than just satisfying our need to assign blame.
Safety Theater: The Problem with Compliance Performance
Dekker’s most recent work on “safety theater” hits particularly close to home in our regulated environment. He defines safety theater as the performance of compliance when under surveillance that retreats to actual work practices when supervision disappears.
I’ve watched organizations prepare for inspections by creating impressive documentation packages that bear little resemblance to how work actually gets done. Procedures get rewritten to sound more rigorous, training records get updated, and everyone rehearses the “right” answers for auditors. But once the inspection ends, work reverts to the adaptive practices that actually make operations function.
This theater emerges from our desire for perfect, controllable systems, but it paradoxically undermines genuine safety by creating inauthenticity. People learn to perform compliance rather than create genuine safety and quality outcomes.
The falsifiable quality systems I’ve been advocating on this blog represent one response to this problem—creating systems that can be tested and potentially proven wrong rather than just demonstrated as compliant.
Six Practical Takeaways for Quality Leaders
After years of applying Dekker’s insights in biotechnology manufacturing, here are the six most practical lessons for quality professionals:
1. Treat “Human Error” as the Beginning of Investigation, Not the End
When investigations conclude with “human error,” they’ve barely started. This should prompt deeper questions: Why did this action make sense? What system conditions shaped this decision? What can we learn about how our procedures and training actually perform under pressure?
2. Understand Work-as-Done, Not Just Work-as-Imagined
There’s always a gap between procedures (work-as-imagined) and actual practice (work-as-done). Understanding this gap and why it exists is more valuable than trying to force compliance with unrealistic procedures. Some of the most important quality improvements I’ve implemented came from understanding how operators actually solve problems under real conditions.
3. Measure Positive Capacities, Not Just Negative Events
Traditional quality metrics focus on what didn’t happen—no deviations, no complaints, no failures. I’ve started developing metrics around investigation quality, learning effectiveness, and adaptive capacity rather than just counting problems. How quickly do we identify and respond to emerging issues? How effectively do we share learning across sites? How well do our people handle unexpected situations?
4. Create Psychological Safety for Learning
Fear and punishment shut down the flow of safety-critical information. Organizations that want to learn from failures must create conditions where people can report problems, admit mistakes, and share concerns without fear of retribution. This is particularly challenging in our regulated environment, but it’s essential for moving beyond compliance theater toward genuine learning.
5. Focus on Contributing Conditions, Not Root Causes
Complex failures emerge from multiple interacting factors, not single root causes. The take-the-best approach I’ve been developing helps identify the most causally powerful factor while avoiding the trap of seeking THE cause. Understanding mechanisms is more valuable than finding someone to blame.
6. Embrace Adaptive Capacity Instead of Fighting Variability
People’s ability to adapt and respond to unexpected conditions is what makes complex systems work, not a threat to be controlled. Rather than trying to eliminate human variability through ever-more-prescriptive procedures, we should understand how that variability creates resilience and design systems that support rather than constrain adaptive problem-solving.
Connection to Investigation Excellence
Dekker’s work provides the theoretical foundation for many approaches I’ve been exploring on this blog. His emphasis on testable hypotheses rather than compliance theater directly supports falsifiable quality systems. His new view framework underlies the causal reasoning methods I’ve been developing. His focus on understanding normal work, not just failures, informs my approach to risk management.
Most importantly, his insistence on moving beyond negative reasoning (“what didn’t happen”) to positive causal statements (“what actually happened and why”) has transformed how I approach investigations. Instead of documenting failures to follow procedures, we’re understanding the specific mechanisms that drove events—and that makes all the difference in preventing recurrence.
Essential Reading for Quality Leaders
If you’re leading quality organizations in today’s complex regulatory environment, these Dekker works are essential:
Dekker’s work challenges us as quality leaders to move beyond the comfortable certainty of compliance-focused approaches toward the more demanding work of creating genuine learning systems. This requires admitting that our procedures and training might not work as intended. It means supporting people when they make mistakes rather than just punishing them. It demands that we measure our success by how well we learn and adapt, not just how well we document compliance.
This isn’t easy work. It requires the kind of organizational humility that Amy Edmondson and other leadership researchers emphasize—the willingness to be proven wrong in service of getting better. But in my experience, organizations that embrace this challenge develop more robust quality systems and, ultimately, better outcomes for patients.
The question isn’t whether Sidney Dekker is right about everything—it’s whether we’re willing to test his ideas and learn from the results. That’s exactly the kind of falsifiable approach that both his work and effective quality systems demand.
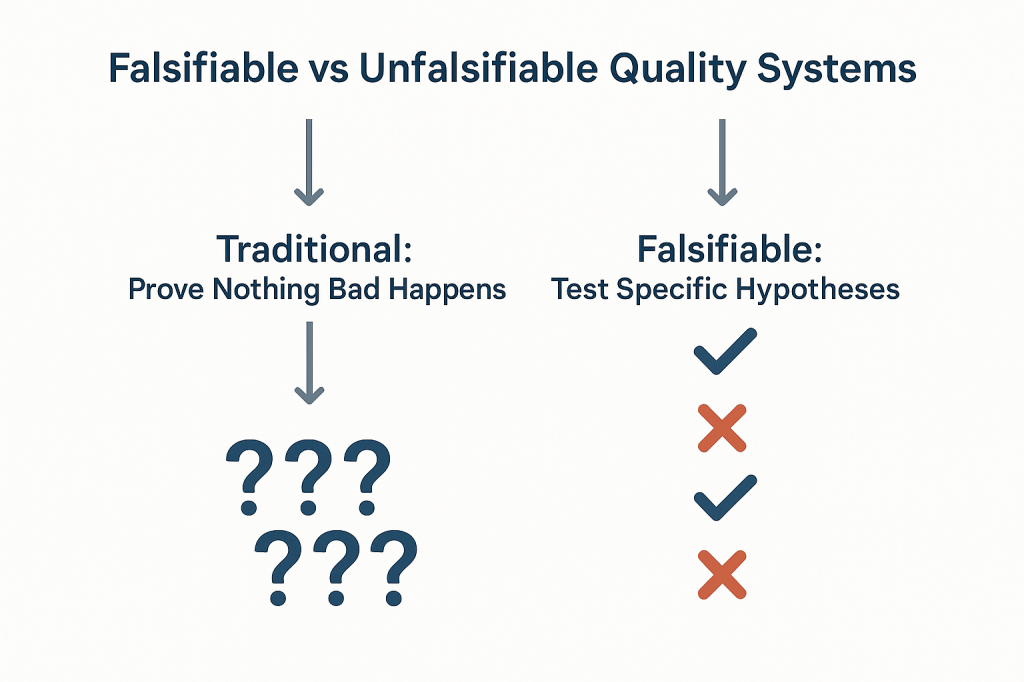
The pharmaceutical industry has long operated under a fundamental epistemological fallacy that undermines our ability to truly understand the effectiveness of our quality systems. We celebrate zero deviations, zero recalls, zero adverse events, and zero regulatory observations as evidence that our systems are working. But a fundamental fact we tend to ignore is that we are confusing the absence of evidence with evidence of absence—a logical error that not only fails to prove effectiveness but actively impedes our ability to build more robust, science-based quality systems.
This challenge strikes at the heart of how we approach quality risk management. When our primary evidence of “success” is that nothing bad happened, we create unfalsifiable systems that can never truly be proven wrong.
The Philosophical Foundation: Falsifiability in Quality Risk Management
Karl Popper’s theory of falsification fundamentally challenges how we think about scientific validity. For Popper, the distinguishing characteristic of genuine scientific theories is not that they can be proven true, but that they can be proven false. A theory that cannot conceivably be refuted by any possible observation is not scientific—it’s metaphysical speculation.
Applied to quality risk management, this creates an uncomfortable truth: most of our current approaches to demonstrating system effectiveness are fundamentally unscientific. When we design quality systems around preventing negative outcomes and then use the absence of those outcomes as evidence of effectiveness, we create what Popper would call unfalsifiable propositions. No possible observation could ever prove our system ineffective as long as we frame effectiveness in terms of what didn’t happen.
Consider the typical pharmaceutical quality narrative: “Our manufacturing process is validated because we haven’t had any quality failures in twelve months.” This statement is unfalsifiable because it can always accommodate new information. If a failure occurs next month, we simply adjust our understanding of the system’s reliability without questioning the fundamental assumption that absence of failure equals validation. We might implement corrective actions, but we rarely question whether our original validation approach was capable of detecting the problems that eventually manifested.
Most of our current risk models are either highly predictive but untestable (making them useful for operational decisions but scientifically questionable) or neither predictive nor testable (making them primarily compliance exercises). The goal should be to move toward models are both scientifically rigorous and practically useful.
This philosophical foundation has practical implications for how we design and evaluate quality risk management systems. Instead of asking “How can we prevent bad things from happening?” we should be asking “How can we design systems that will fail in predictable ways when our underlying assumptions are wrong?” The first question leads to unfalsifiable defensive strategies; the second leads to falsifiable, scientifically valid approaches to quality assurance.
Why “Nothing Bad Happened” Isn’t Evidence of Effectiveness
The fundamental problem with using negative evidence to prove positive claims extends far beyond philosophical niceties, it creates systemic blindness that prevents us from understanding what actually drives quality outcomes. When we frame effectiveness in terms of absence, we lose the ability to distinguish between systems that work for the right reasons and systems that appear to work due to luck, external factors, or measurement limitations.
Scenario
Null Hypothesis
What Rejection Proves
What Non-Rejection Proves
Popperian Assessment
Traditional Efficacy Testing
No difference between treatment and control
Treatment is effective
Cannot prove effectiveness
Falsifiable and useful
Traditional Safety Testing
No increased risk
Treatment increases risk
Cannot prove safety
Unfalsifiable for safety
Absence of Events (Current)
No safety signal detected
Cannot prove anything
Cannot prove safety
Unfalsifiable
Non-inferiority Approach
Excess risk > acceptable margin
Treatment is acceptably safe
Cannot prove safety
Partially falsifiable
Falsification-Based Safety
Safety controls are inadequate
Current safety measures fail
Safety controls are adequate
Falsifiable and actionable
The table above demonstrates how traditional safety and effectiveness assessments fall into unfalsifiable categories. Traditional safety testing, for example, attempts to prove that something doesn’t increase risk, but this can never be definitively demonstrated—we can only fail to detect increased risk within the limitations of our study design. This creates a false confidence that may not be justified by the actual evidence.
The Sampling Illusion: When we observe zero deviations in a batch of 1000 units, we often conclude that our process is in control. But this conclusion conflates statistical power with actual system performance. With typical sampling strategies, we might have only 10% power to detect a 1% defect rate. The “zero observations” reflect our measurement limitations, not process capability.
The Survivorship Bias: Systems that appear effective may be surviving not because they’re well-designed, but because they haven’t yet encountered the conditions that would reveal their weaknesses. Our quality systems are often validated under ideal conditions and then extrapolated to real-world operations where different failure modes may dominate.
The Attribution Problem: When nothing bad happens, we attribute success to our quality systems without considering alternative explanations. Market forces, supplier improvements, regulatory changes, or simple random variation might be the actual drivers of observed outcomes.
Observable Outcome
Traditional Interpretation
Popperian Critique
What We Actually Know
Testable Alternative
Zero adverse events in 1000 patients
“The drug is safe”
Absence of evidence does not equal Evidence of absence
No events detected in this sample
Test limits of safety margin
Zero manufacturing deviations in 12 months
“The process is in control”
No failures observed does not equal a Failure-proof system
No deviations detected with current methods
Challenge process with stress conditions
Zero regulatory observations
“The system is compliant”
No findings does not equal No problems exist
No issues found during inspection
Audit against specific failure modes
Zero product recalls
“Quality is assured”
No recalls does not equal No quality issues
No quality failures reached market
Test recall procedures and detection
Zero patient complaints
“Customer satisfaction achieved”
No complaints does not equal No problems
No complaints received through channels
Actively solicit feedback mechanisms
This table illustrates how traditional interpretations of “positive” outcomes (nothing bad happened) fail to provide actionable knowledge. The Popperian critique reveals that these observations tell us far less than we typically assume, and the testable alternatives provide pathways toward more rigorous evaluation of system effectiveness.
The pharmaceutical industry’s reliance on these unfalsifiable approaches creates several downstream problems. First, it prevents genuine learning and improvement because we can’t distinguish effective interventions from ineffective ones. Second, it encourages defensive mindsets that prioritize risk avoidance over value creation. Third, it undermines our ability to make resource allocation decisions based on actual evidence of what works.
The Model Usefulness Problem: When Predictions Don’t Match Reality
George Box’s famous aphorism that “all models are wrong, but some are useful” provides a pragmatic framework for this challenge, but it doesn’t resolve the deeper question of how to determine when a model has crossed from “useful” to “misleading.” Popper’s falsifiability criterion offers one approach: useful models should make specific, testable predictions that could potentially be proven wrong by future observations.
The challenge in pharmaceutical quality management is that our models often serve multiple purposes that may be in tension with each other. Models used for regulatory submission need to demonstrate conservative estimates of risk to ensure patient safety. Models used for operational decision-making need to provide actionable insights for process optimization. Models used for resource allocation need to enable comparison of risks across different areas of the business.
When the same model serves all these purposes, it often fails to serve any of them well. Regulatory models become so conservative that they provide little guidance for actual operations. Operational models become so complex that they’re difficult to validate or falsify. Resource allocation models become so simplified that they obscure important differences in risk characteristics.
The solution isn’t to abandon modeling, but to be more explicit about the purpose each model serves and the criteria by which its usefulness should be judged. For regulatory purposes, conservative models that err on the side of safety may be appropriate even if they systematically overestimate risks. For operational decision-making, models should be judged primarily on their ability to correctly rank-order interventions by their impact on relevant outcomes. For scientific understanding, models should be designed to make falsifiable predictions that can be tested through controlled experiments or systematic observation.
Consider the example of cleaning validation, where we use models to predict the probability of cross-contamination between manufacturing campaigns. Traditional approaches focus on demonstrating that residual contamination levels are below acceptance criteria—essentially proving a negative. But this approach tells us nothing about the relative importance of different cleaning parameters, the margin of safety in our current procedures, or the conditions under which our cleaning might fail.
A more falsifiable approach would make specific predictions about how changes in cleaning parameters affect contamination levels. We might hypothesize that doubling the rinse time reduces contamination by 50%, or that certain product sequences create systematically higher contamination risks. These hypotheses can be tested and potentially falsified, providing genuine learning about the underlying system behavior.
From Defensive to Testable Risk Management
The evolution from defensive to testable risk management represents a fundamental shift in how we conceptualize quality systems. Traditional defensive approaches ask, “How can we prevent failures?” Testable approaches ask, “How can we design systems that fail predictably when our assumptions are wrong?” This shift moves us from unfalsifiable defensive strategies toward scientifically rigorous quality management.
This transition aligns with the broader evolution in risk thinking documented in ICH Q9(R1) and ISO 31000, which recognize risk as “the effect of uncertainty on objectives” where that effect can be positive, negative, or both. By expanding our definition of risk to include opportunities as well as threats, we create space for falsifiable hypotheses about system performance.
The integration of opportunity-based thinking with Popperian falsifiability creates powerful synergies. When we hypothesize that a particular quality intervention will not only reduce defects but also improve efficiency, we create multiple testable predictions. If the intervention reduces defects but doesn’t improve efficiency, we learn something important about the underlying system mechanics. If it improves efficiency but doesn’t reduce defects, we gain different insights. If it does neither, we discover that our fundamental understanding of the system may be flawed.
This approach requires a cultural shift from celebrating the absence of problems to celebrating the presence of learning. Organizations that embrace falsifiable quality management actively seek conditions that would reveal the limitations of their current systems. They design experiments to test the boundaries of their process capabilities. They view unexpected results not as failures to be explained away, but as opportunities to refine their understanding of system behavior.
The practical implementation of testable risk management involves several key elements:
Hypothesis-Driven Validation: Instead of demonstrating that processes meet specifications, validation activities should test specific hypotheses about process behavior. For example, rather than proving that a sterilization cycle achieves a 6-log reduction, we might test the hypothesis that cycle modifications affect sterility assurance in predictable ways. Instead of demonstrating that the CHO cell culture process consistently produces mAb drug substance meeting predetermined specifications, hypothesis-driven validation would test the specific prediction that maintaining pH at 7.0 ± 0.05 during the production phase will result in final titers that are 15% ± 5% higher than pH maintained at 6.9 ± 0.05, creating a falsifiable hypothesis that can be definitively proven wrong if the predicted titer improvement fails to materialize within the specified confidence intervals
Falsifiable Control Strategies: Control strategies should include specific predictions about how the system will behave under different conditions. These predictions should be testable and potentially falsifiable through routine monitoring or designed experiments.
Learning-Oriented Metrics: Key indicators should be designed to detect when our assumptions about system behavior are incorrect, not just when systems are performing within specification. Metrics that only measure compliance tell us nothing about the underlying system dynamics.
Proactive Stress Testing: Rather than waiting for problems to occur naturally, we should actively probe the boundaries of system performance through controlled stress conditions. This approach reveals failure modes before they impact patients while providing valuable data about system robustness.
Designing Falsifiable Quality Systems
The practical challenge of designing falsifiable quality systems requires a fundamental reconceptualization of how we approach quality assurance. Instead of building systems designed to prevent all possible failures, we need systems designed to fail in instructive ways when our underlying assumptions are incorrect.
This approach starts with making our assumptions explicit and testable. Traditional quality systems often embed numerous unstated assumptions about process behavior, material characteristics, environmental conditions, and human performance. These assumptions are rarely articulated clearly enough to be tested, making the systems inherently unfalsifiable. A falsifiable quality system makes these assumptions explicit and designs tests to evaluate their validity.
Consider the design of a typical pharmaceutical manufacturing process. Traditional approaches focus on demonstrating that the process consistently produces product meeting specifications under defined conditions. This demonstration typically involves process validation studies that show the process works under idealized conditions, followed by ongoing monitoring to detect deviations from expected performance.
A falsifiable approach would start by articulating specific hypotheses about what drives process performance. We might hypothesize that product quality is primarily determined by three critical process parameters, that these parameters interact in predictable ways, and that environmental variations within specified ranges don’t significantly impact these relationships. Each of these hypotheses can be tested and potentially falsified through designed experiments or systematic observation of process performance.
The key insight is that falsifiable quality systems are designed around testable theories of what makes quality systems effective, rather than around defensive strategies for preventing all possible problems. This shift enables genuine learning and continuous improvement because we can distinguish between interventions that work for the right reasons and those that appear to work for unknown or incorrect reasons.
Structured Hypothesis Formation: Quality requirements should be built around explicit hypotheses about cause-and-effect relationships in critical processes. These hypotheses should be specific enough to be tested and potentially falsified through systematic observation or experimentation.
Predictive Monitoring: Instead of monitoring for compliance with specifications, systems should monitor for deviations from predicted behavior. When predictions prove incorrect, this provides valuable information about the accuracy of our underlying process understanding.
Experimental Integration: Routine operations should be designed to provide ongoing tests of system hypotheses. Process changes, material variations, and environmental fluctuations should be treated as natural experiments that provide data about system behavior rather than disturbances to be minimized.
Failure Mode Anticipation: Quality systems should explicitly anticipate the ways failures might happen and design detection mechanisms for these failure modes. This proactive approach contrasts with reactive systems that only detect problems after they occur.
The Evolution of Risk Assessment: From Compliance to Science
The evolution of pharmaceutical risk assessment from compliance-focused activities to genuine scientific inquiry represents one of the most significant opportunities for improving quality outcomes. Traditional risk assessments often function primarily as documentation exercises designed to satisfy regulatory requirements rather than tools for genuine learning and improvement.
ICH Q9(R1) recognizes this limitation and calls for more scientifically rigorous approaches to quality risk management. The updated guidance emphasizes the need for risk assessments to be based on scientific knowledge and to provide actionable insights for quality improvement. This represents a shift away from checklist-based compliance activities toward hypothesis-driven scientific inquiry.
The integration of falsifiability principles with ICH Q9(R1) requirements creates opportunities for more rigorous and useful risk assessments. Instead of asking generic questions about what could go wrong, falsifiable risk assessments develop specific hypotheses about failure modes and design tests to evaluate these hypotheses. This approach provides more actionable insights while meeting regulatory expectations for systematic risk evaluation.
Consider the evolution of Failure Mode and Effects Analysis (FMEA) from a traditional compliance tool to a falsifiable risk assessment method. Traditional FMEA often devolves into generic lists of potential failures with subjective probability and impact assessments. The results provide limited insight because the assessments can’t be systematically tested or validated.
A falsifiable FMEA would start with specific hypotheses about failure mechanisms and their relationships to process parameters, material characteristics, or operational conditions. These hypotheses would be tested through historical data analysis, designed experiments, or systematic monitoring programs. The results would provide genuine insights into system behavior while creating a foundation for continuous improvement.
This evolution requires changes in how we approach several key risk assessment activities:
Hazard Identification: Instead of brainstorming all possible things that could go wrong, risk identification should focus on developing testable hypotheses about specific failure mechanisms and their triggers.
Risk Analysis: Probability and impact assessments should be based on testable models of system behavior rather than subjective expert judgment. When models prove inaccurate, this provides valuable information about the need to revise our understanding of system dynamics.
Risk Control: Control measures should be designed around testable theories of how interventions affect system behavior. The effectiveness of controls should be evaluated through systematic monitoring and periodic testing rather than assumed based on their implementation.
Risk Review: Risk review activities should focus on testing the accuracy of previous risk predictions and updating risk models based on new evidence. This creates a learning loop that continuously improves the quality of risk assessments over time.
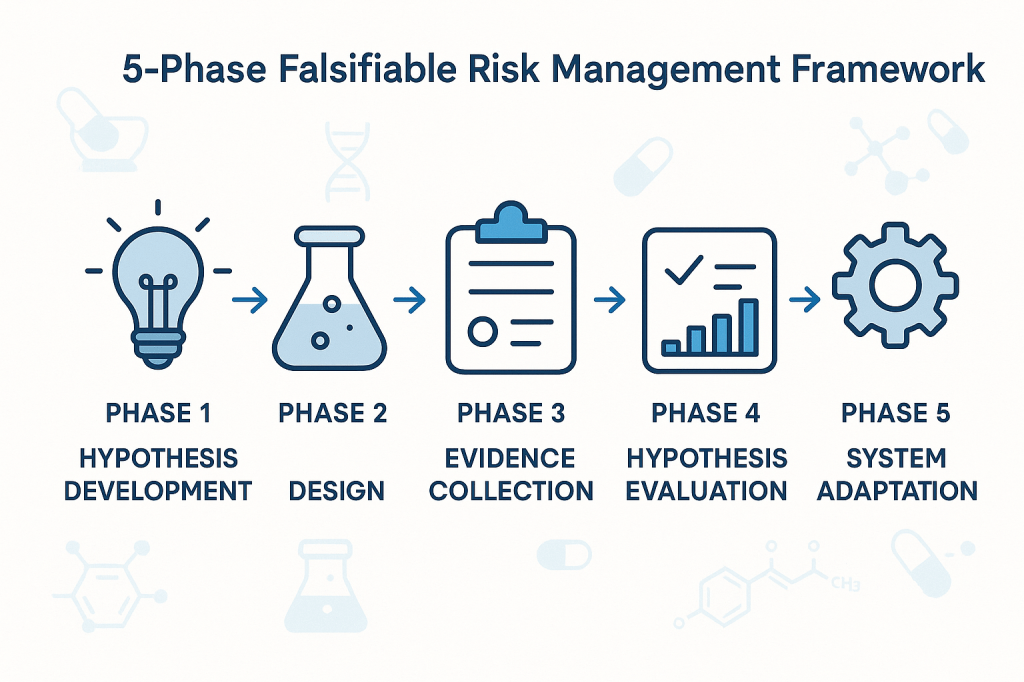
Practical Framework for Falsifiable Quality Risk Management
The implementation of falsifiable quality risk management requires a systematic framework that integrates Popperian principles with practical pharmaceutical quality requirements. This framework must be sophisticated enough to generate genuine scientific insights while remaining practical for routine quality management activities.
The foundation of this framework rests on the principle that effective quality systems are built around testable theories of what drives quality outcomes. These theories should make specific predictions that can be evaluated through systematic observation, controlled experimentation, or historical data analysis. When predictions prove incorrect, this provides valuable information about the need to revise our understanding of system behavior.
Phase 1: Hypothesis Development
The first phase involves developing specific, testable hypotheses about system behavior. These hypotheses should address fundamental questions about what drives quality outcomes in specific operational contexts. Rather than generic statements about quality risks, hypotheses should make specific predictions about relationships between process parameters, material characteristics, environmental conditions, and quality outcomes.
For example, instead of the generic hypothesis that “temperature variations affect product quality,” a falsifiable hypothesis might state that “temperature excursions above 25°C for more than 30 minutes during the mixing phase increase the probability of out-of-specification results by at least 20%.” This hypothesis is specific enough to be tested and potentially falsified through systematic data collection and analysis.
Phase 2: Experimental Design
The second phase involves designing systematic approaches to test the hypotheses developed in Phase 1. This might involve controlled experiments, systematic analysis of historical data, or structured monitoring programs designed to capture relevant data about hypothesis validity.
The key principle is that testing approaches should be capable of falsifying the hypotheses if they are incorrect. This requires careful attention to statistical power, measurement systems, and potential confounding factors that might obscure true relationships between variables.
Phase 3: Evidence Collection
The third phase focuses on systematic collection of evidence relevant to hypothesis testing. This evidence might come from designed experiments, routine monitoring data, or systematic analysis of historical performance. The critical requirement is that evidence collection should be structured around hypothesis testing rather than generic performance monitoring.
Evidence collection systems should be designed to detect when hypotheses are incorrect, not just when systems are performing within specifications. This requires more sophisticated approaches to data analysis and interpretation than traditional compliance-focused monitoring.
Phase 4: Hypothesis Evaluation
The fourth phase involves systematic evaluation of evidence against the hypotheses developed in Phase 1. This evaluation should follow rigorous statistical methods and should be designed to reach definitive conclusions about hypothesis validity whenever possible.
When hypotheses are falsified, this provides valuable information about the need to revise our understanding of system behavior. When hypotheses are supported by evidence, this provides confidence in our current understanding while suggesting areas for further testing and refinement.
Phase 5: System Adaptation
The final phase involves adapting quality systems based on the insights gained through hypothesis testing. This might involve modifying control strategies, updating risk assessments, or redesigning monitoring programs based on improved understanding of system behavior.
The critical principle is that system adaptations should be based on genuine learning about system behavior rather than reactive responses to compliance issues or external pressures. This creates a foundation for continuous improvement that builds cumulative knowledge about what drives quality outcomes.
Implementation Challenges
The transition to falsifiable quality risk management faces several practical challenges that must be addressed for successful implementation. These challenges range from technical issues related to experimental design and statistical analysis to cultural and organizational barriers that may resist more scientifically rigorous approaches to quality management.
Technical Challenges
The most immediate technical challenge involves designing falsifiable hypotheses that are relevant to pharmaceutical quality management. Many quality professionals have extensive experience with compliance-focused activities but limited experience with experimental design and hypothesis testing. This skills gap must be addressed through targeted training and development programs.
Statistical power represents another significant technical challenge. Many quality systems operate with very low baseline failure rates, making it difficult to design experiments with adequate power to detect meaningful differences in system performance. This requires sophisticated approaches to experimental design and may necessitate longer observation periods or larger sample sizes than traditionally used in quality management.
Measurement systems present additional challenges. Many pharmaceutical quality attributes are difficult to measure precisely, introducing uncertainty that can obscure true relationships between process parameters and quality outcomes. This requires careful attention to measurement system validation and uncertainty quantification.
Cultural and Organizational Challenges
Perhaps more challenging than technical issues are the cultural and organizational barriers to implementing more scientifically rigorous quality management approaches. Many pharmaceutical organizations have deeply embedded cultures that prioritize risk avoidance and compliance over learning and improvement.
The shift to falsifiable quality management requires cultural change that embraces controlled failure as a learning opportunity rather than something to be avoided at all costs. This represents a fundamental change in how many organizations think about quality management and may encounter significant resistance.
Regulatory relationships present additional organizational challenges. Many quality professionals worry that more rigorous scientific approaches to quality management might raise regulatory concerns or create compliance burdens. This requires careful communication with regulatory agencies to demonstrate that falsifiable approaches enhance rather than compromise patient safety.
Strategic Solutions
Successfully implementing falsifiable quality risk management requires strategic approaches that address both technical and cultural challenges. These solutions must be tailored to specific organizational contexts while maintaining scientific rigor and regulatory compliance.
Pilot Programs: Implementation should begin with carefully selected pilot programs in areas where falsifiable approaches can demonstrate clear value. These pilots should be designed to generate success stories that support broader organizational adoption while building internal capability and confidence.
Training and Development: Comprehensive training programs should be developed to build organizational capability in experimental design, statistical analysis, and hypothesis testing. These programs should be tailored to pharmaceutical quality contexts and should emphasize practical applications rather than theoretical concepts.
Regulatory Engagement: Proactive engagement with regulatory agencies should emphasize how falsifiable approaches enhance patient safety through improved understanding of system behavior. This communication should focus on the scientific rigor of the approach rather than on business benefits that might appear secondary to regulatory objectives.
Cultural Change Management: Systematic change management programs should address cultural barriers to embracing controlled failure as a learning opportunity. These programs should emphasize how falsifiable approaches support regulatory compliance and patient safety rather than replacing these priorities with business objectives.
Case Studies: Falsifiability in Practice
The practical application of falsifiable quality risk management can be illustrated through several case studies that demonstrate how Popperian principles can be integrated with routine pharmaceutical quality activities. These examples show how hypotheses can be developed, tested, and used to improve quality outcomes while maintaining regulatory compliance.
Case Study 1: Cleaning Validation Optimization
A biologics manufacturer was experiencing occasional cross-contamination events despite having validated cleaning procedures that consistently met acceptance criteria. Traditional approaches focused on demonstrating that cleaning procedures reduced contamination below specified limits, but provided no insight into the factors that occasionally caused this system to fail.
The falsifiable approach began with developing specific hypotheses about cleaning effectiveness. The team hypothesized that cleaning effectiveness was primarily determined by three factors: contact time with cleaning solution, mechanical action intensity, and rinse water temperature. They further hypothesized that these factors interacted in predictable ways and that current procedures provided a specific margin of safety above minimum requirements.
These hypotheses were tested through a designed experiment that systematically varied each cleaning parameter while measuring residual contamination levels. The results revealed that current procedures were adequate under ideal conditions but provided minimal margin of safety when multiple factors were simultaneously at their worst-case levels within specified ranges.
Based on these findings, the cleaning procedure was modified to provide greater margin of safety during worst-case conditions. More importantly, ongoing monitoring was redesigned to test the continued validity of the hypotheses about cleaning effectiveness rather than simply verifying compliance with acceptance criteria.
Case Study 2: Process Control Strategy Development
A pharmaceutical manufacturer was developing a control strategy for a new manufacturing process. Traditional approaches would have focused on identifying critical process parameters and establishing control limits based on process validation studies. Instead, the team used a falsifiable approach that started with explicit hypotheses about process behavior.
The team hypothesized that product quality was primarily controlled by the interaction between temperature and pH during the reaction phase, that these parameters had linear effects on product quality within the normal operating range, and that environmental factors had negligible impact on these relationships.
These hypotheses were tested through systematic experimentation during process development. The results confirmed the importance of the temperature-pH interaction but revealed nonlinear effects that weren’t captured in the original hypotheses. More importantly, environmental humidity was found to have significant effects on process behavior under certain conditions.
The control strategy was designed around the revised understanding of process behavior gained through hypothesis testing. Ongoing process monitoring was structured to continue testing key assumptions about process behavior rather than simply detecting deviations from target conditions.
Case Study 3: Supplier Quality Management
A biotechnology company was managing quality risks from a critical raw material supplier. Traditional approaches focused on incoming inspection and supplier auditing to verify compliance with specifications and quality system requirements. However, occasional quality issues suggested that these approaches weren’t capturing all relevant quality risks.
The falsifiable approach started with specific hypotheses about what drove supplier quality performance. The team hypothesized that supplier quality was primarily determined by their process control during critical manufacturing steps, that certain environmental conditions increased the probability of quality issues, and that supplier quality system maturity was predictive of long-term quality performance.
These hypotheses were tested through systematic analysis of supplier quality data, enhanced supplier auditing focused on specific process control elements, and structured data collection about environmental conditions during material manufacturing. The results revealed that traditional quality system assessments were poor predictors of actual quality performance, but that specific process control practices were strongly predictive of quality outcomes.
The supplier management program was redesigned around the insights gained through hypothesis testing. Instead of generic quality system requirements, the program focused on specific process control elements that were demonstrated to drive quality outcomes. Supplier performance monitoring was structured around testing continued validity of the relationships between process control and quality outcomes.
Measuring Success in Falsifiable Quality Systems
The evaluation of falsifiable quality systems requires fundamentally different approaches to performance measurement than traditional compliance-focused systems. Instead of measuring the absence of problems, we need to measure the presence of learning and the accuracy of our predictions about system behavior.
Traditional quality metrics focus on outcomes: defect rates, deviation frequencies, audit findings, and regulatory observations. While these metrics remain important for regulatory compliance and business performance, they provide limited insight into whether our quality systems are actually effective or merely lucky. Falsifiable quality systems require additional metrics that evaluate the scientific validity of our approach to quality management.
Predictive Accuracy Metrics
The most direct measure of a falsifiable quality system’s effectiveness is the accuracy of its predictions about system behavior. These metrics evaluate how well our hypotheses about quality system behavior match observed outcomes. High predictive accuracy suggests that we understand the underlying drivers of quality outcomes. Low predictive accuracy indicates that our understanding needs refinement.
Predictive accuracy metrics might include the percentage of process control predictions that prove correct, the accuracy of risk assessments in predicting actual quality issues, or the correlation between predicted and observed responses to process changes. These metrics provide direct feedback about the validity of our theoretical understanding of quality systems.
Learning Rate Metrics
Another important category of metrics evaluates how quickly our understanding of quality systems improves over time. These metrics measure the rate at which falsified hypotheses lead to improved system performance or more accurate predictions. High learning rates indicate that the organization is effectively using falsifiable approaches to improve quality outcomes.
Learning rate metrics might include the time required to identify and correct false assumptions about system behavior, the frequency of successful process improvements based on hypothesis testing, or the rate of improvement in predictive accuracy over time. These metrics evaluate the dynamic effectiveness of falsifiable quality management approaches.
Hypothesis Quality Metrics
The quality of hypotheses generated by quality risk management processes represents another important performance dimension. High-quality hypotheses are specific, testable, and relevant to important quality outcomes. Poor-quality hypotheses are vague, untestable, or focused on trivial aspects of system performance.
Hypothesis quality can be evaluated through structured peer review processes, assessment of testability and specificity, and evaluation of relevance to critical quality attributes. Organizations with high-quality hypothesis generation processes are more likely to gain meaningful insights from their quality risk management activities.
System Robustness Metrics
Falsifiable quality systems should become more robust over time as learning accumulates and system understanding improves. Robustness can be measured through the system’s ability to maintain performance despite variations in operating conditions, changes in materials or equipment, or other sources of uncertainty.
Robustness metrics might include the stability of process performance across different operating conditions, the effectiveness of control strategies under stress conditions, or the system’s ability to detect and respond to emerging quality risks. These metrics evaluate whether falsifiable approaches actually lead to more reliable quality systems.
Regulatory Implications and Opportunities
The integration of falsifiable principles with pharmaceutical quality risk management creates both challenges and opportunities in regulatory relationships. While some regulatory agencies may initially view scientific approaches to quality management with skepticism, the ultimate result should be enhanced regulatory confidence in quality systems that can demonstrate genuine understanding of what drives quality outcomes.
The key to successful regulatory engagement lies in emphasizing how falsifiable approaches enhance patient safety rather than replacing regulatory compliance with business optimization. Regulatory agencies are primarily concerned with patient safety and product quality. Falsifiable quality systems support these objectives by providing more rigorous and reliable approaches to ensuring quality outcomes.
Enhanced Regulatory Submissions
Regulatory submissions based on falsifiable quality systems can provide more compelling evidence of system effectiveness than traditional compliance-focused approaches. Instead of demonstrating that systems meet minimum requirements, falsifiable approaches can show genuine understanding of what drives quality outcomes and how systems will behave under different conditions.
This enhanced evidence can support regulatory flexibility in areas such as process validation, change control, and ongoing monitoring requirements. Regulatory agencies may be willing to accept risk-based approaches to these activities when they’re supported by rigorous scientific evidence rather than generic compliance activities.
Proactive Risk Communication
Falsifiable quality systems enable more proactive and meaningful communication with regulatory agencies about quality risks and mitigation strategies. Instead of reactive communication about compliance issues, organizations can engage in scientific discussions about system behavior and improvement strategies.
This proactive communication can build regulatory confidence in organizational quality management capabilities while providing opportunities for regulatory agencies to provide input on scientific approaches to quality improvement. The result should be more collaborative regulatory relationships based on shared commitment to scientific rigor and patient safety.
Regulatory Science Advancement
The pharmaceutical industry’s adoption of more scientifically rigorous approaches to quality management can contribute to the advancement of regulatory science more broadly. Regulatory agencies benefit from industry innovations in risk assessment, process understanding, and quality assurance methods.
Organizations that successfully implement falsifiable quality risk management can serve as case studies for regulatory guidance development and can provide evidence for the effectiveness of science-based approaches to quality assurance. This contribution to regulatory science advancement creates value that extends beyond individual organizational benefits.
Toward a More Scientific Quality Culture
The long-term vision for falsifiable quality risk management extends beyond individual organizational implementations to encompass fundamental changes in how the pharmaceutical industry approaches quality assurance. This vision includes more rigorous scientific approaches to quality management, enhanced collaboration between industry and regulatory agencies, and continuous advancement in our understanding of what drives quality outcomes.
Industry-Wide Learning Networks
One promising direction involves the development of industry-wide learning networks that share insights from falsifiable quality management implementations. These networks facilitate collaborative hypothesis testing, shared learning from experimental results, and development of common methodologies for scientific approaches to quality assurance.
Such networks accelerate the advancement of quality science while maintaining appropriate competitive boundaries. Organizations should share methodological insights and general findings while protecting proprietary information about specific processes or products. The result would be faster advancement in quality management science that benefits the entire industry.
Advanced Analytics Integration
The integration of advanced analytics and machine learning techniques with falsifiable quality management approaches represents another promising direction. These technologies can enhance our ability to develop testable hypotheses, design efficient experiments, and analyze complex datasets to evaluate hypothesis validity.
Machine learning approaches are particularly valuable for identifying patterns in complex quality datasets that might not be apparent through traditional analysis methods. However, these approaches must be integrated with falsifiable frameworks to ensure that insights can be validated and that predictive models can be systematically tested and improved.
Regulatory Harmonization
The global harmonization of regulatory approaches to science-based quality management represents a significant opportunity for advancing patient safety and regulatory efficiency. As individual regulatory agencies gain experience with falsifiable quality management approaches, there are opportunities to develop harmonized guidance that supports consistent global implementation.
ICH Q9(r1) was a great step. I would love to see continued work in this area.
Embracing the Discomfort of Scientific Rigor
The transition from compliance-focused to scientifically rigorous quality risk management represents more than a methodological change—it requires fundamentally rethinking how we approach quality assurance in pharmaceutical manufacturing. By embracing Popper’s challenge that genuine scientific theories must be falsifiable, we move beyond the comfortable but ultimately unhelpful world of proving negatives toward the more demanding but ultimately more rewarding world of testing positive claims about system behavior.
The effectiveness paradox that motivates this discussion—the problem of determining what works when our primary evidence is that “nothing bad happened”—cannot be resolved through better compliance strategies or more sophisticated documentation. It requires genuine scientific inquiry into the mechanisms that drive quality outcomes. This inquiry must be built around testable hypotheses that can be proven wrong, not around defensive strategies that can always accommodate any possible outcome.
The practical implementation of falsifiable quality risk management is not without challenges. It requires new skills, different cultural approaches, and more sophisticated methodologies than traditional compliance-focused activities. However, the potential benefits—genuine learning about system behavior, more reliable quality outcomes, and enhanced regulatory confidence—justify the investment required for successful implementation.
Perhaps most importantly, the shift to falsifiable quality management moves us toward a more honest assessment of what we actually know about quality systems versus what we merely assume or hope to be true. This honesty is uncomfortable but essential for building quality systems that genuinely serve patient safety rather than organizational comfort.
The question is not whether pharmaceutical quality management will eventually embrace more scientific approaches—the pressures of regulatory evolution, competitive dynamics, and patient safety demands make this inevitable. The question is whether individual organizations will lead this transition or be forced to follow. Those that embrace the discomfort of scientific rigor now will be better positioned to thrive in a future where quality management is evaluated based on genuine effectiveness rather than compliance theater.
As we continue to navigate an increasingly complex regulatory and competitive environment, the organizations that master the art of turning uncertainty into testable knowledge will be best positioned to deliver consistent quality outcomes while maintaining the flexibility needed for innovation and continuous improvement. The integration of Popperian falsifiability with modern quality risk management provides a roadmap for achieving this mastery while maintaining the rigorous standards our industry demands.
The path forward requires courage to question our current assumptions, discipline to design rigorous tests of our theories, and wisdom to learn from both our successes and our failures. But for those willing to embrace these challenges, the reward is quality systems that are not only compliant but genuinely effective. Systems that we can defend not because they’ve never been proven wrong, but because they’ve been proven right through systematic, scientific inquiry.
In the highly regulated pharmaceutical industry, ensuring the quality, safety, and efficacy of products is paramount. Two critical components of pharmaceutical quality management are Quality Assurance (QA) and Quality Control (QC). While these terms are sometimes used interchangeably, they represent distinct approaches with different focuses, methodologies, and objectives within pharmaceutical manufacturing. Understanding the differences between QA and QC is essential for pharmaceutical companies to effectively manage their quality processes and meet regulatory requirements.
Quality Assurance (QA) and Quality Control (QC) are both essential and complementary pillars of pharmaceutical quality management, each playing a distinct yet interconnected role in ensuring product safety, efficacy, and regulatory compliance. QA establishes the systems, procedures, and preventive measures that form the foundation for consistent quality throughout the manufacturing process, while QC verifies the effectiveness of these systems by testing and inspecting products to ensure they meet established standards. The synergy between QA and QC creates a robust feedback loop: QC identifies deviations or defects through analytical testing, and QA uses this information to drive process improvements, update protocols, and implement corrective and preventive actions. This collaboration not only helps prevent the release of substandard products but also fosters a culture of continuous improvement, risk mitigation, and regulatory compliance, making both QA and QC indispensable for maintaining the highest standards in pharmaceutical manufacturing.
Definition and Scope
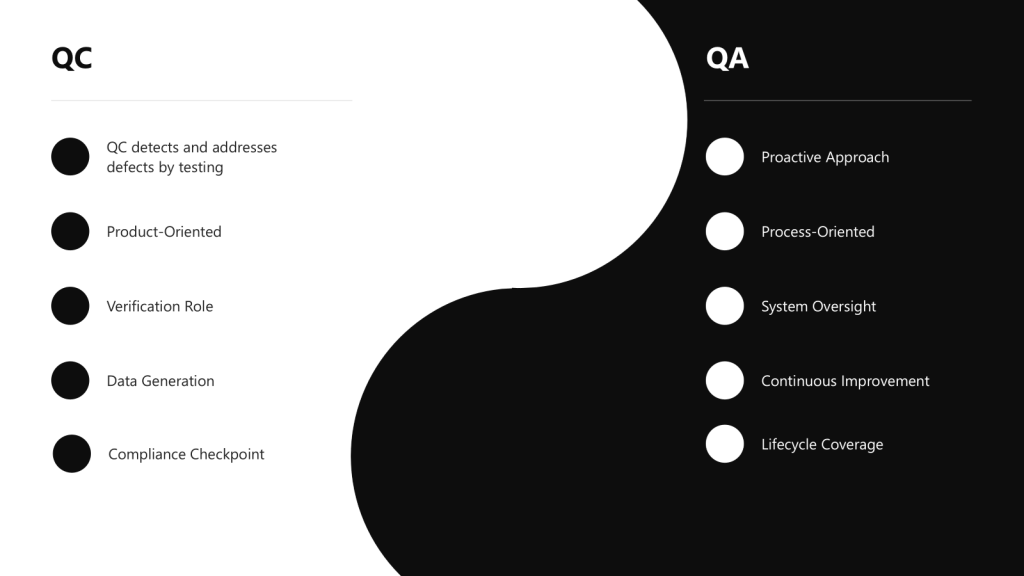
Quality Assurance (QA) is a comprehensive, proactive approach focused on preventing defects by establishing robust systems and processes throughout the entire product lifecycle. It encompasses the totality of arrangements made to ensure pharmaceutical products meet the quality required for their intended use. QA is process-oriented and aims to build quality into every stage of development and manufacturing.
Quality Control (QC) is a reactive, product-oriented approach that involves testing, inspection, and verification of finished products to detect and address defects or deviations from established standards. QC serves as a checkpoint to identify any issues that may have slipped through the manufacturing process.
Approach: Proactive vs. Reactive
One of the most fundamental differences between QA and QC lies in their approach to quality management:
QA takes a proactive approach by focusing on preventing defects and deviations before they occur. It establishes robust quality management systems, procedures, and processes to minimize the risk of quality issues.
QC takes a reactive approach by focusing on detecting and addressing deviations and defects after they have occurred. It involves testing, sampling, and inspection activities to identify non-conformities and ensure products meet established quality standards.
Focus: Process vs. Product
QA is process-oriented, focusing on establishing and maintaining robust processes and procedures to ensure consistent product quality. It involves developing standard operating procedures (SOPs), documentation, and validation protocols.
QC is product-oriented, focusing on verifying the quality of finished products through testing and inspection. It ensures that the final product meets predetermined specifications before release to the market.
Comparison Table: QA vs. QC in Pharmaceutical Manufacturing
Aspect
Quality Assurance (QA)
Quality Control (QC)
Definition
A comprehensive, proactive approach focused on preventing defects by establishing robust systems and processes
A reactive, product-oriented approach that involves testing and verification of finished products
Focus
Process-oriented, focusing on how products are made
Product-oriented, focusing on what is produced
Approach
Proactive – prevents defects before they occur
Reactive – detects defects after they occur
Timing
Before and during production
During and after production
Responsibility
Establishing systems, procedures, and documentation
To build quality into every stage of development and manufacturing
To identify non-conformities and ensure products meet specifications
Methodology
Establishing SOPs, validation protocols, and quality management systems
Sampling, testing, inspection, and verification activities
Scope
Spans the entire product lifecycle from development to discontinuation
Primarily focused on manufacturing and finished products
Relationship to GMP
Ensures GMP implementation through systems and processes
Verifies GMP compliance through testing and inspection
The Quality Continuum: QA and QC as Complementary Approaches
Rather than viewing QA and QC as separate entities, modern pharmaceutical quality systems recognize them as part of a continuous spectrum of quality management activities. This continuum spans the entire product lifecycle, from development through manufacturing to post-market surveillance.
The Integrated Quality Approach
QA and QC represent different points on the quality continuum but work together to ensure comprehensive quality management. The overlap between QA and QC creates an integrated quality approach where both preventive and detective measures work in harmony. This integration is essential for maintaining what regulators call a “state of control” – a condition in which the set of controls consistently provides assurance of continued process performance and product quality.
Quality Risk Management as a Bridge
Quality Risk Management (QRM) serves as a bridge between QA and QC activities, providing a systematic approach to quality decision-making. By identifying, assessing, and controlling risks throughout the product lifecycle, QRM helps determine where QA preventive measures and QC detective measures should be applied most effectively.
The concept of a “criticality continuum” further illustrates how QA and QC work together. Rather than categorizing quality attributes and process parameters as simply critical or non-critical, this approach recognizes varying degrees of criticality that require different levels of control and monitoring.
Organizational Models for QA and QC in Pharmaceutical Companies
Pharmaceutical companies employ various organizational structures to manage their quality functions. The choice of structure depends on factors such as company size, product portfolio complexity, regulatory requirements, and corporate culture.
Common Organizational Models
Integrated Quality Unit
In this model, QA and QC functions are combined under a single Quality Unit with shared leadership and resources. This approach promotes streamlined communication and a unified approach to quality management. However, it may present challenges related to potential conflicts of interest and lack of independent verification.
Separate QA and QC Departments
Many pharmaceutical companies maintain separate QA and QC departments, each with distinct leadership reporting to a higher-level quality executive. This structure provides clear separation of responsibilities and specialized focus but may create communication barriers and resource inefficiencies.
QA as a Standalone Department, QC Integrated with Operations
In this organizational model, the Quality Assurance (QA) function operates as an independent department, while Quality Control (QC) is grouped within the same department as other operations functions, such as manufacturing and production. This structure is designed to balance independent oversight with operational efficiency.
Centralized Quality Organization
Large pharmaceutical companies often adopt a centralized quality organization where quality functions are consolidated at the corporate level with standardized processes across all manufacturing sites. This model ensures consistent quality standards and efficient knowledge sharing but may be less adaptable to site-specific needs.
Decentralized Quality Organization
In contrast, some companies distribute quality functions across manufacturing sites with site-specific quality teams. This approach allows for site-specific quality focus and faster decision-making but may lead to inconsistent quality practices and regulatory compliance challenges.
Matrix Quality Organization
A matrix quality organization combines elements of both centralized and decentralized models. Quality personnel report to both functional quality leaders and operational/site leaders, providing a balance between standardization and site-specific needs. However, this structure can create complex reporting relationships and potential conflicts in priorities.
The Quality Unit: Overarching Responsibility for Pharmaceutical Quality
Concept and Definition of the Quality Unit
The Quality Unit is a fundamental concept in pharmaceutical manufacturing, representing the organizational entity responsible for overseeing all quality-related activities. According to FDA guidance, the Quality Unit is “any person or organizational element designated by the firm to be responsible for the duties relating to quality control”.
The concept of a Quality Unit was solidified in FDA’s 2006 guidance, “Quality Systems Approach to Pharmaceutical Current Good Manufacturing Practice Regulations,” which defined it as the entity responsible for creating, monitoring, and implementing a quality system.
Independence and Authority of the Quality Unit
Regulatory agencies emphasize that the Quality Unit must maintain independence from production operations to ensure objective quality oversight. This independence is critical for the Quality Unit to fulfill its responsibility of approving or rejecting materials, processes, and products without undue influence from production pressures.
The Quality Unit must have sufficient authority and resources to carry out its responsibilities effectively. This includes the authority to investigate quality issues, implement corrective actions, and make final decisions regarding product release.
How QA and QC Contribute to Environmental Monitoring and Contamination Control
Environmental monitoring (EM) and contamination control are critical pillars of pharmaceutical manufacturing quality systems, requiring the coordinated efforts of both Quality Assurance (QA) and Quality Control (QC) functions. While QA focuses on establishing preventive systems and procedures, QC provides the verification and testing that ensures these systems are effective. Together, they create a comprehensive framework for maintaining aseptic manufacturing environments and protecting product integrity. This also serves as a great example of the continuum in action.
QA Contributions to Environmental Monitoring and Contamination Control
System Design and Program Development
Quality Assurance takes the lead in establishing the foundational framework for environmental monitoring programs. QA is responsible for designing comprehensive EM programs that include sampling plans, alert and action limits, and risk-based monitoring locations. This involves developing a systematic approach that addresses all critical elements including types of monitoring methods, culture media and incubation conditions, frequency of environmental monitoring, and selection of sample sites.
For example, QA establishes the overall contamination control strategy (CCS) that defines and assesses the effectiveness of all critical control points, including design, procedural, technical, and organizational controls employed to manage contamination risks. This strategy encompasses the entire facility and provides a comprehensive framework for contamination prevention.
Risk Management and Assessment
QA implements quality risk management principles to provide a proactive means of identifying, scientifically evaluating, and controlling potential risks to quality. This involves conducting thorough risk assessments that cover all human interactions with clean room areas, equipment placement and ergonomics, and air quality considerations. The risk-based approach ensures that monitoring efforts are focused on the most critical areas and processes where contamination could have the greatest impact on product quality.
QA also establishes risk-based environmental monitoring programs that are re-evaluated at defined intervals to confirm effectiveness, considering factors such as facility aging, barrier and cleanroom design optimization, and personnel changes. This ongoing assessment ensures that the monitoring program remains relevant and effective as conditions change over time.
Procedural Oversight and Documentation
QA ensures the development and maintenance of standardized operating procedures (SOPs) for all aspects of environmental monitoring, including air sampling, surface sampling, and personnel sampling protocols. These procedures ensure consistency in monitoring activities and provide clear guidance for personnel conducting environmental monitoring tasks.
The documentation responsibilities of QA extend to creating comprehensive quality management plans that clearly define responsibilities and duties to ensure that environmental monitoring data generated are of the required type, quality, and quantity. This includes establishing procedures for data analysis, trending, investigative responses to action level excursions, and appropriate corrective and preventative actions.
Compliance Assurance and Regulatory Alignment
QA ensures that environmental monitoring protocols meet Good Manufacturing Practice (GMP) requirements and align with current regulatory expectations such as the EU Annex 1 guidelines.
QA also manages the overall quality system to ensure that environmental monitoring activities support regulatory compliance and facilitate successful inspections and audits. This involves maintaining proper documentation, training records, and quality improvement processes that demonstrate ongoing commitment to contamination control.
QC Contributions to Environmental Monitoring and Contamination Control
Execution of Testing and Sampling
Quality Control is responsible for the hands-on execution of environmental monitoring testing protocols. QC personnel conduct microbiological testing including bioburden and endotoxin testing, as well as particle counting for non-viable particulate monitoring. This includes performing microbial air sampling using techniques such as active air sampling and settle plates, along with surface and personnel sampling using swabbing and contact plates.
For example, QC technicians perform routine environmental monitoring of classified manufacturing and filling areas, conducting both routine and investigational sampling to assess environmental conditions. They utilize calibrated active air samplers and strategically placed settle plates throughout cleanrooms, while also conducting surface and personnel sampling periodically, especially after critical interventions.
Data Analysis and Trend Monitoring
QC plays a crucial role in analyzing environmental monitoring data and identifying trends that may indicate potential contamination issues. When alert or action limits are exceeded, QC personnel initiate immediate investigations and document findings according to established protocols. This includes performing regular trend analysis on collected data to understand the state of control in cleanrooms and identify potential contamination risks before they lead to significant problems.
QC also maintains environmental monitoring programs and ensures all data is properly logged into Laboratory Information Management Systems (LIMS) for comprehensive tracking and analysis . This systematic approach to data management enables effective trending and supports decision-making processes related to contamination control.
Validation and Verification Activities
QC conducts critical validation activities to simulate aseptic processes and verify the effectiveness of contamination control measures. These activities provide direct evidence that manufacturing processes maintain sterility and/or bioburden control and that environmental controls are functioning as intended.
QC also performs specific testing protocols including dissolution testing, stability testing, and comprehensive analysis of finished products to ensure they meet quality specifications and are free from contamination. This testing provides the verification that QA-established systems are effectively preventing contamination.
Real-Time Monitoring and Response
QC supports continuous monitoring efforts through the implementation of Process Analytical Technology (PAT) for real-time quality verification. This includes continuous monitoring of non-viable particulates, which helps detect events that could potentially increase contamination risk and enables immediate corrective measures.
When deviations occur, QC personnel immediately report findings and place products on hold for further evaluation, providing documented reports and track-and-trend data to support decision-making processes. This rapid response capability is essential for preventing contaminated products from reaching the market.
Conclusion
While Quality Assurance and Quality Control in pharmaceutical manufacturing represent distinct processes with different focuses and approaches, they form a complementary continuum that ensures product quality throughout the lifecycle. QA is proactive, process-oriented, and focused on preventing quality issues through robust systems and procedures. QC is reactive, product-oriented, and focused on detecting and addressing quality issues through testing and inspection.
The organizational structure of quality functions in pharmaceutical companies varies, with models ranging from integrated quality units to separate departments, centralized or decentralized organizations, and matrix structures. Regardless of the organizational model, the Quality Unit plays a critical role in overseeing all quality-related activities and ensuring compliance with regulatory requirements.
The Pharmaceutical Quality System provides an overarching framework that integrates QA and QC activities within a comprehensive approach to quality management. By implementing effective quality systems and fostering a culture of quality, pharmaceutical companies can ensure the safety, efficacy, and quality of their products while meeting regulatory requirements and continuously improving their processes.
In manufacturing circles, “First-Time Right” (FTR) has become something of a sacred cow-a philosophy so universally accepted that questioning it feels almost heretical. Yet as continuous manufacturing processes increasingly replace traditional batch production, we need to critically examine whether this cherished doctrine serves us well or creates dangerous blind spots in our quality assurance frameworks.
The Seductive Promise of First-Time Right
Let’s start by acknowledging the compelling appeal of FTR. As commonly defined, First-Time Right is both a manufacturing principle and KPI that denotes the percentage of end-products leaving production without quality defects. The concept promises a manufacturing utopia: zero waste, minimal costs, maximum efficiency, and delighted customers receiving perfect products every time.
The math seems straightforward. If you produce 1,000 units and 920 are defect-free, your FTR is 92%. Continuous improvement efforts should steadily drive that percentage upward, reducing the resources wasted on imperfect units.
This principle finds its intellectual foundation in Six Sigma methodology, which can tend to give it an air of scientific inevitability. Yet even Six Sigma acknowledges that perfection remains elusive. This subtle but crucial nuance often gets lost when organizations embrace FTR as an absolute expectation rather than an aspiration.
First-Time Right in biologics drug substance manufacturing refers to the principle and performance metric of producing a biological drug substance that meets all predefined quality attributes and regulatory requirements on the first attempt, without the need for rework, reprocessing, or batch rejection. In this context, FTR emphasizes executing each step of the complex, multi-stage biologics manufacturing process correctly from the outset-starting with cell line development, through upstream (cell culture/fermentation) and downstream (purification, formulation) operations, to the final drug substance release.
Achieving FTR is especially challenging in biologics because these products are made from living systems and are highly sensitive to variations in raw materials, process parameters, and environmental conditions. Even minor deviations can lead to significant quality issues such as contamination, loss of potency, or batch failure, often requiring the entire batch to be discarded.
In biologics manufacturing, FTR is not just about minimizing waste and cost; it is critical for patient safety, regulatory compliance, and maintaining supply reliability. However, due to the inherent variability and complexity of biologics, FTR is best viewed as a continuous improvement goal rather than an absolute expectation. The focus is on designing and controlling processes to consistently deliver drug substances that meet all critical quality attributes-recognizing that, despite best efforts, some level of process variation and deviation is inevitable in biologics production
The Unique Complexities of Continuous Manufacturing
Traditional batch processing creates natural boundaries-discrete points where production pauses, quality can be assessed, and decisions about proceeding can be made. In contrast, continuous manufacturing operates without these convenient checkpoints, as raw materials are continuously fed into the manufacturing system, and finished products are continuously extracted, without interruption over the life of the production run.
This fundamental difference requires a complete rethinking of quality assurance approaches. In continuous environments:
Quality must be monitored and controlled in real-time, without stopping production
Deviations must be detected and addressed while the process continues running
The interconnected nature of production steps means issues can propagate rapidly through the system
Traceability becomes vastly more complex
Regulatory agencies recognize these unique challenges, acknowledging that understanding and managing risks is central to any decision to greenlight CM in a production-ready environment. When manufacturing processes never stop, quality assurance cannot rely on the same methodologies that worked for discrete batches.
The Dangerous Complacency of Perfect-First-Time Thinking
The most insidious danger of treating FTR as an achievable absolute is the complacency it breeds. When leadership becomes fixated on achieving perfect FTR scores, several dangerous patterns emerge:
Overconfidence in Automation
While automation can significantly improve quality, it is important to recognize the irreplaceable value of human oversight. Automated systems, no matter how advanced, are ultimately limited by their programming, design, and maintenance. Human operators bring critical thinking, intuition, and the ability to spot subtle anomalies that machines may overlook. A vigilant human presence can catch emerging defects or process deviations before they escalate, providing a layer of judgment and adaptability that automation alone cannot replicate. Relying solely on automation creates a dangerous blind spot-one where the absence of human insight can allow issues to go undetected until they become major problems. True quality excellence comes from the synergy of advanced technology and engaged, knowledgeable people working together.
Underinvestment in Deviation Management
If perfection is expected, why invest in systems to handle imperfections? Yet robust deviation management-the processes used to identify, document, investigate, and correct deviations becomes even more critical in continuous environments where problems can cascade rapidly. Organizations pursuing FTR often underinvest in the very systems that would help them identify and address the inevitable deviations.
False Sense of Process Robustness
Process robustness refers to the ability of a manufacturing process to tolerate the variability of raw materials, process equipment, operating conditions, environmental conditions and human factors. An obsession with FTR can mask underlying fragility in processes that appear to be performing well under normal conditions. When we pretend our processes are infallible, we stop asking critical questions about their resilience under stress.
When FTR becomes dogma, teams may become reluctant to report or escalate potential issues, fearing they’ll be seen as failures. This creates a culture of silence around deviations-precisely the opposite of what’s needed for effective quality management in continuous manufacturing. When perfection is the only acceptable outcome, people hide imperfections rather than address them.
Magical Thinking in Quality Management
The belief that we can eliminate all errors in complex manufacturing processes amounts to what organizational psychologists call “magical thinking” – the delusional belief that one can do the impossible. In manufacturing, this often manifests as pretending that doing more tasks with less resources will not hurt the work quality.
This is a pattern I’ve observed repeatedly in my investigations of quality failures. When leadership subscribes to the myth that perfection is not just desirable but achievable, they create the conditions for quality disasters. Teams stop preparing for how to handle deviations and start pretending deviations won’t occur.
The irony is that this approach actually undermines the very goal of FTR. By acknowledging the possibility of failure and building systems to detect and learn from it quickly, we actually increase the likelihood of getting things right.
Building a Healthier Quality Culture for Continuous Manufacturing
Rather than chasing the mirage of perfect FTR, organizations should focus on creating systems and cultures that:
Detect deviations rapidly: Continuous monitoring through advanced process control systems becomes essential for monitoring and regulating critical parameters throughout the production process. The question isn’t whether deviations will occur but how quickly you’ll know about them.
Investigate transparently: When issues occur, the focus should be on understanding root causes rather than assigning blame. The culture must prioritize learning over blame.
Implement robust corrective actions: Deviations should be thoroughly documented including details about when and where it occurred, who identified it, a detailed description of the nonconformance, initial actions taken, results of the investigation into the cause, actions taken to correct and prevent recurrence, and a final evaluation of the effectiveness of these actions.
Learn systematically: Each deviation represents a valuable opportunity to strengthen processes and prevent similar issues in the future. The organization that learns fastest wins, not the one that pretends to be perfect.
Breaking the Groupthink Cycle
The FTR myth thrives in environments characterized by groupthink, where challenging the prevailing wisdom is discouraged. When leaders obsess over FTR metrics while punishing those who report deviations, they create the perfect conditions for quality disasters.
This connects to a theme I’ve explored repeatedly on this blog: the dangers of losing institutional memory and critical thinking in quality organizations. When we forget that imperfection is inevitable, we stop building the systems and cultures needed to manage it effectively.
Embracing Humility, Vigilance, and Continuous Learning
True quality excellence comes not from pretending that errors don’t occur, but from embracing a more nuanced reality:
Perfection is a worthy aspiration but an impossible standard
Systems must be designed not just to prevent errors but to detect and address them
A healthy quality culture prizes transparency and learning over the appearance of perfection
Continuous improvement comes from acknowledging and understanding imperfections, not denying them
The path forward requires humility to recognize the limitations of our processes, vigilance to catch deviations quickly when they occur, and an unwavering commitment to learning and improving from each experience.
In the end, the most dangerous quality issues aren’t the ones we detect and address-they’re the ones our systems and culture allow to remain hidden because we’re too invested in the myth that they shouldn’t exist at all. First-Time Right should remain an aspiration that drives improvement, not a dogma that blinds us to reality.
From Perfect to Perpetually Improving
As continuous manufacturing becomes the norm rather than the exception, we need to move beyond the simplistic FTR myth toward a more sophisticated understanding of quality. Rather than asking, “Did we get it perfect the first time?” we should be asking:
How quickly do we detect when things go wrong?
How effectively do we contain and remediate issues?
How systematically do we learn from each deviation?
How resilient are our processes to the variations they inevitably encounter?
These questions acknowledge the reality of manufacturing-that imperfection is inevitable-while focusing our efforts on what truly matters: building systems and cultures capable of detecting, addressing, and learning from deviations to drive continuous improvement.
The companies that thrive in the continuous manufacturing future won’t be those with the most impressive FTR metrics on paper. They’ll be those with the humility to acknowledge imperfection, the systems to detect and address it quickly, and the learning cultures that turn each deviation into an opportunity for improvement.
The Swiss Cheese Model, conceptualized by James Reason, fundamentally defined modern risk management by illustrating how layered defenses interact with active and latent failures to prevent or enable adverse events. This framework underpins the Four Layers of Protection, a systematic approach to mitigating risks across industries. By integrating Reason’s Theory of Active and Latent Failures with modern adaptations like resilience engineering, organizations can create robust, adaptive systems.
The Swiss Cheese Model and Reason’s Theory: A Foundation for Layered Defenses
Reason’s Theory distinguishes between active failures (immediate errors by frontline personnel) and latent failures (systemic weaknesses in design, management, or culture). The Swiss Cheese Model visualizes these failures as holes in successive layers of defense. When holes align, hazards penetrate the system. For example:
In healthcare, a mislabeled specimen (active failure) might bypass defenses if staff are overworked (latent failure) and barcode scanners malfunction (technical failure).
In aviation, a pilot’s fatigue-induced error (active) could combine with inadequate simulator training (latent) and faulty sensors (technical) to cause a near-miss.
This model emphasizes that no single layer is foolproof; redundancy and diversity across layers are critical.
2. Information Security: Aligning with ISO/IEC 27001
Inherent: Encryption embedded in software design (ISO 27001 Annex A.10).
Procedural: Regular penetration testing and access reviews (Annex A.12).
Technical: Intrusion detection systems (Annex A.13).
Organizational: Enterprise-wide risk assessments and governance (Annex A.5).
3. Biotech Manufacturing: Contamination Control
Inherent: Closed-system bioreactors with sterile welders.
Procedural: FDA-mandated Contamination Control Strategies (CCS).
Technical: Real-time viable particle monitoring with auto-alerts.
Organizational: Cross-functional teams analyzing trend data to preempt breaches.
Contamination Control and Layers of Controls Analysis (LOCA)
In contamination-critical industries, a Layers of Controls Analysis (LOCA) evaluates how failures in one layer impact others. For example:
Procedural Failure: Skipping gowning steps in a cleanroom.
Technical Compromise: HEPA filter leaks due to poor maintenance.
Organizational Gap: Inadequate staff training on updated protocols.
LOCA reveals that latent organizational failures (e.g., insufficient training budgets) often undermine technical and procedural layers. LOCA ties contamination risks to systemic resource allocation, not just frontline errors.
ISO/IEC 27001, the international standard for information security, exemplifies layered risk management:
ISO 27001 Control (Annex A)
Corresponding Layer
Example
A.8.3 (Information labeling)
Procedural
Classifying data by sensitivity
A.9.4 (Network security)
Technical
Firewalls and VPNs
A.11.1 (Physical security)
Inherent/Technical
Biometric access to server rooms
A.5.1 (Policies for IS)
Organizational
Board-level oversight of cyber risks
This alignment ensures that technical safeguards (e.g., encryption) are reinforced by procedural (e.g., audits) and organizational (e.g., governance) layers, mirroring the Swiss Cheese Model’s redundancy principle.
Resilience Engineering: Evolving the Layers
Resilience engineering moves beyond static defenses, focusing on a system’s capacity to anticipate, adapt, and recover from disruptions. It complements the Four Layers by adding dynamism:
Traditional Layer
Resilience Engineering Approach
Example
Inherent Design
Build adaptive capacity (e.g., modular systems)
Pharmaceutical plants with flexible cleanroom layouts
Procedural
Dynamic procedures adjusted via real-time data
AI-driven prescribing systems updating dosage limits during shortages
While the Swiss Cheese Model remains influential, critics argue it oversimplifies complex systems where layers interact unpredictably. For example, a malfunctioning algorithm (technical) could override procedural safeguards, necessitating organizational oversight of machine learning outputs.
Future applications will likely integrate:
Predictive Analytics: Leverages advanced algorithms, machine learning, and vast datasets to forecast future risks and opportunities, transforming risk management from a reactive to a proactive discipline. By analyzing historical and real-time data, predictive analytics identifies patterns and anomalies that signal potential threats—such as equipment failures or contamination events —enabling organizations to anticipate and mitigate risks before they escalate. The technology’s adaptability allows it to integrate internal and external data sources, providing dynamic, data-driven insights that support better decision-making, resource allocation, and compliance monitoring. As a result, predictive analytics not only enhances operational resilience and efficiency but also reduces costs associated with failures, recalls, or regulatory breaches, making it an indispensable tool for modern risk and quality management.
Human-Machine Teaming: Integrates human cognitive flexibility with machine precision to create collaborative systems that outperform isolated human or machine efforts. By framing machines as adaptive teammates rather than passive tools, HMT enables dynamic task allocation. Key benefits include accelerated decision-making through AI-driven data synthesis, reduced operational errors via automated safeguards, and enhanced resilience in complex environments. However, effective HMT requires addressing challenges such as establishing bidirectional trust through explainable AI, aligning ethical frameworks for accountability, and balancing autonomy levels through risk-categorized architectures. As HMT evolves, success hinges on designing systems that leverage human intuition and machine scalability while maintaining rigorous quality protocols.
Epistemic Governance: The processes through which actors collectively shape perceptions, validate knowledge, and steer decision-making in complex systems, particularly during crises. Rooted in the dynamic interplay between recognized reality (actors’ constructed understanding of a situation) and epistemic work (efforts to verify, apply, or challenge knowledge), this approach emphasizes adaptability over rigid frameworks. By appealing to norms like transparency and scientific rigor, epistemic governance bridges structural frameworks (e.g., ISO standards) and grassroots actions, enabling systems to address latent organizational weaknesses while fostering trust. It also confronts power dynamics in knowledge production, ensuring marginalized voices inform policies—a critical factor in sustainability and crisis management where equitable participation shapes outcomes. Ultimately, it transforms governance into a reflexive practice, balancing institutional mandates with the agility to navigate evolving threats.
Conclusion
The Four Layers of Protection, rooted in Reason’s Swiss Cheese Model, provide a versatile framework for managing risks—from data breaches to pharmaceutical contamination. By integrating standards and embracing resilience engineering, organizations can transform static defenses into adaptive systems capable of navigating modern complexities. As industries face evolving threats, the synergy between layered defenses and dynamic resilience will define the next era of risk management.