One of the best interview questions anyone ever asked me was about my tastes in fiction. Our taste in fiction reveals a great deal about who we are, reflecting our values, aspirations, and even our emotional and intellectual tendencies. Fiction serves as a mirror to our inner selves while also shaping our identity and worldview. My answer was Tinker Tailor Soldier Spy by John le Carré’.
John le Carré’s Tinker Tailor Soldier Spy is often celebrated as a masterpiece of espionage fiction, weaving a complex tale of betrayal, loyalty, and meticulous investigation. Surprisingly, the world of George Smiley’s mole hunt within MI6 shares striking parallels with the work of quality professionals. Both domains require precision, analytical thinking, and an unwavering commitment to uncovering flaws in systems.
Shared Traits: Espionage and Quality Assurance
Meticulous Investigation In Tinker Tailor Soldier Spy, George Smiley’s task is to uncover a mole embedded within the ranks of MI6. His investigation involves piecing together fragments of information, analyzing patterns, and identifying anomalies—all while navigating layers of secrecy and misdirection. Similarly, quality professionals must scrutinize processes, identify root causes of defects, and ensure systems operate flawlessly. Both roles demand a sharp eye for detail and the ability to connect disparate clues.
Risk Management Spycraft often involves operating in high-stakes environments where a single misstep could lead to catastrophic consequences. Smiley’s investigation exemplifies this as he balances discretion with urgency to protect national security. Quality assurance professionals face similar stakes when ensuring product safety or compliance with regulations. A failure in quality can lead to reputational damage or even harm to end-users.
Interpersonal Dynamics Espionage relies heavily on understanding human motivations and building trust or exploiting weaknesses. Smiley navigates complex relationships within MI6, some marked by betrayal or hidden agendas. Likewise, quality professionals often work across departments, requiring strong interpersonal skills to foster collaboration and address resistance to change.
Adaptability Both spies and quality professionals operate in ever-changing landscapes. For Smiley, this means adapting to new intelligence and countering misinformation. For quality experts, it involves staying updated on industry standards and evolving technologies while responding to unexpected challenges.
Lessons for Quality Professionals from Spy Novels
The Power of Patience Smiley’s investigation is not rushed; it is methodical and deliberate. This mirrors the importance of patience in quality assurance—thorough testing and analysis are essential to uncover hidden issues that could compromise outcomes.
Trust but Verify In Tinker Tailor Soldier Spy, trust is a fragile commodity. Smiley must verify every piece of information before acting on it. Quality professionals can adopt this mindset by implementing robust verification processes to ensure that assumptions or data are accurate.
Embrace Ambiguity Espionage thrives in gray areas where certainty is rare. Similarly, quality assurance often involves navigating incomplete data or ambiguous requirements, requiring professionals to make informed decisions amidst uncertainty.
Continuous Learning Intelligence officers must constantly refine their skills to outmaneuver adversaries6. Quality professionals benefit from a similar commitment to learning—whether through adopting new methodologies or staying informed about industry trends.
Collaboration Across Silos Just as Smiley relies on allies with diverse expertise during his mole hunt, quality assurance thrives on teamwork across departments.
Themes That Resonate
Spy novels like Tinker Tailor Soldier Spy explore themes of loyalty, duty, and the pursuit of excellence despite systemic challenges. These themes are equally relevant for quality professionals who must uphold standards even when faced with organizational resistance or resource constraints. Both fields underscore the importance of integrity—whether in safeguarding national security or ensuring product reliability.
Continuous Process Verification (CPV) represents the final and most dynamic stage of the FDA’s process validation lifecycle, designed to ensure manufacturing processes remain validated during routine production. The methodology for CPV and the selection of appropriate tools are deeply rooted in the FDA’s 2011 guidance, Process Validation: General Principles and Practices, which emphasizes a science- and risk-based approach to quality assurance. This blog post examines how CPV methodologies align with regulatory frameworks and how tools are selected to meet compliance and operational objectives.
CPV Methodology: Anchored in the FDA’s Lifecycle Approach
The FDA’s process validation framework divides activities into three stages: Process Design (Stage 1), Process Qualification (Stage 2), and Continued Process Verification (Stage 3). CPV, as Stage 3, is not an isolated activity but a continuation of the knowledge gained in earlier stages. This lifecycle approach is our framework.
Stage 1: Process Design
During Stage 1, manufacturers define Critical Quality Attributes (CQAs) and Critical Process Parameters (CPPs) through risk assessments and experimental design. This phase establishes the scientific basis for monitoring and control strategies. For example, if a parameter’s variability is inherently low (e.g., clustering near the Limit of Quantification, or LOQ), this knowledge informs later decisions about CPV tools.
Stage 2: Process Qualification
Stage 2 confirms that the process, when operated within established parameters, consistently produces quality products. Data from this stage—such as process capability indices (Cpk/Ppk)—provide baseline metrics for CPV. For instance, a high Cpk (>2) for a parameter near LOQ signals that traditional control charts may be inappropriate due to limited variability.
Stage 3: Continued Process Verification
CPV methodology is defined by two pillars:
Ongoing Monitoring: Continuous collection and analysis of CPP/CQA data.
Adaptive Control: Adjustments to maintain process control, informed by statistical and risk-based insights.
Regulatory agencies require that CPV methodologies must be tailored to the process’s unique characteristics. For example, a parameter with data clustered near LOQ (as in the case study) demands a different approach than one with normal variability.
Selecting CPV Tools: Aligning with Data and Risk
The framework emphasizes that CPV tools must be scientifically justified, with selection criteria based on data suitability, risk criticality, and regulatory alignment.
Data Suitability Assessments
Data suitability assessments form the bedrock of effective Continuous Process Verification (CPV) programs, ensuring that monitoring tools align with the statistical and analytical realities of the process. These assessments are not merely technical exercises but strategic activities rooted in regulatory expectations, scientific rigor, and risk management. Below, we explore the three pillars of data suitability—distribution analysis, process capability evaluation, and analytical performance considerations—and their implications for CPV tool selection.
The foundation of any statistical monitoring system lies in understanding the distribution of the data being analyzed. Many traditional tools, such as control charts, assume that data follows a normal (Gaussian) distribution. This assumption underpins the calculation of control limits (e.g., ±3σ) and the interpretation of rule violations. To validate this assumption, manufacturers employ tests such as the Shapiro-Wilk test or Anderson-Darling test, which quantitatively assess normality. Visual tools like Q-Q plots or histograms complement these tests by providing intuitive insights into data skewness, kurtosis, or clustering.
When data deviates significantly from normality—common in parameters with values clustered near detection or quantification limits (e.g., LOQ)—the use of parametric tools like control charts becomes problematic. For instance, a parameter with 95% of its data below the LOQ may exhibit a left-skewed distribution, where the calculated mean and standard deviation are distorted by the analytical method’s noise rather than reflecting true process behavior. In such cases, traditional control charts generate misleading signals, such as Rule 1 violations (±3σ), which flag analytical variability rather than process shifts.
To address non-normal data, manufacturers must transition to non-parametric methods that do not rely on distributional assumptions. Tolerance intervals, which define ranges covering a specified proportion of the population with a given confidence level, are particularly useful for skewed datasets. For example, a 95/99 tolerance interval (95% of data within 99% confidence) can replace ±3σ limits for non-normal data, reducing false positives. Bootstrapping—a resampling technique—offers another alternative, enabling robust estimation of control limits without assuming normality.
Process Capability: Aligning Tools with Inherent Variability
Process capability indices, such as Cp and Cpk, quantify a parameter’s ability to meet specifications relative to its natural variability. A high Cp (>2) indicates that the process variability is small compared to the specification range, often resulting from tight manufacturing controls or robust product designs. While high capability is desirable for quality, it complicates CPV tool selection. For example, a parameter with a Cp of 3 and data clustered near the LOQ will exhibit minimal variability, rendering control charts ineffective. The narrow spread of data means that control limits shrink, increasing the likelihood of false alarms from minor analytical noise.
In such scenarios, traditional SPC tools like control charts lose their utility. Instead, manufacturers should adopt attribute-based monitoring or batch-wise trending. Attribute-based approaches classify results as pass/fail against predefined thresholds (e.g., LOQ breaches), simplifying signal interpretation. Batch-wise trending aggregates data across production lots, identifying shifts over time without overreacting to individual outliers. For instance, a manufacturer with a high-capability dissolution parameter might track the percentage of batches meeting dissolution criteria monthly, rather than plotting individual tablet results.
The FDA’s emphasis on risk-based monitoring further supports this shift. ICH Q9 guidelines encourage manufacturers to prioritize resources for high-risk parameters, allowing low-risk, high-capability parameters to be monitored with simpler tools. This approach reduces administrative burden while maintaining compliance.
Analytical Performance: Decoupling Noise from Process Signals
Parameters operating near analytical limits of detection (LOD) or quantification (LOQ) present unique challenges. At these extremes, measurement systems contribute significant variability, often overshadowing true process signals. For example, a purity assay with an LOQ of 0.1% may report values as “<0.1%” for 98% of batches, creating a dataset dominated by the analytical method’s imprecision. In such cases, failing to decouple analytical variability from process performance leads to misguided investigations and wasted resources.
To address this, manufacturers must isolate analytical variability through dedicated method monitoring programs. This involves:
Analytical Method Validation: Rigorous characterization of precision, accuracy, and detection capabilities (e.g., determining the Practical Quantitation Limit, or PQL, which reflects real-world method performance).
Separate Trending: Implementing control charts or capability analyses for the analytical method itself (e.g., monitoring LOQ stability across batches).
Threshold-Based Alerts: Replacing statistical rules with binary triggers (e.g., investigating only results above LOQ).
For example, a manufacturer analyzing residual solvents near the LOQ might use detection capability indices to set action limits. If the analytical method’s variability (e.g., ±0.02% at LOQ) exceeds the process variability, threshold alerts focused on detecting values above 0.1% + 3σ_analytical would provide more meaningful signals than traditional control charts.
Integration with Regulatory Expectations
Regulatory agencies, including the FDA and EMA, mandate that CPV methodologies be “scientifically sound” and “statistically valid” (FDA 2011 Guidance). This requires documented justification for tool selection, including:
Normality Testing: Evidence that data distribution aligns with tool assumptions (e.g., Shapiro-Wilk test results).
Capability Analysis: Cp/Cpk values demonstrating the rationale for simplified monitoring.
A 2024 FDA warning letter highlighted the consequences of neglecting these steps. A firm using control charts for non-normal dissolution data received a 483 observation for lacking statistical rationale, underscoring the need for rigor in data suitability assessments.
Case Study Application: A manufacturer monitoring a CQA with 98% of data below LOQ initially used control charts, triggering frequent Rule 1 violations (±3σ). These violations reflected analytical noise, not process shifts. Transitioning to threshold-based alerts (investigating only LOQ breaches) reduced false positives by 72% while maintaining compliance.
Risk-Based Tool Selection
The ICH Q9 Quality Risk Management (QRM) framework provides a structured methodology for identifying, assessing, and controlling risks to pharmaceutical product quality, with a strong emphasis on aligning tool selection with the parameter’s impact on patient safety and product efficacy. Central to this approach is the principle that the rigor of risk management activities—including the selection of tools—should be proportionate to the criticality of the parameter under evaluation. This ensures resources are allocated efficiently, focusing on high-impact risks while avoiding overburdening low-risk areas.
Prioritizing Tools Through the Lens of Risk Impact
The ICH Q9 framework categorizes risks based on their potential to compromise product quality, guided by factors such as severity, detectability, and probability. Parameters with a direct impact on critical quality attributes (CQAs)—such as potency, purity, or sterility—are classified as high-risk and demand robust analytical tools. Conversely, parameters with minimal impact may require simpler methods. For example:
High-Impact Parameters: Use Failure Mode and Effects Analysis (FMEA) or Fault Tree Analysis (FTA) to dissect failure modes, root causes, and mitigation strategies.
Medium-Impact Parameters: Apply a tool such as a PHA.
Low-Impact Parameters: Utilize checklists or flowcharts for basic risk identification.
This tiered approach ensures that the complexity of the tool matches the parameter’s risk profile.
Importance: The parameter’s criticality to patient safety or product efficacy.
Complexity: The interdependencies of the system or process being assessed.
Uncertainty: Gaps in knowledge about the parameter’s behavior or controls.
For instance, a high-purity active pharmaceutical ingredient (API) with narrow specification limits (high importance) and variable raw material inputs (high complexity) would necessitate FMEA to map failure modes across the supply chain. In contrast, a non-critical excipient with stable sourcing (low uncertainty) might only require a simplified risk ranking matrix.
Implementing a Risk-Based Approach
1. Assess Parameter Criticality
Begin by categorizing parameters based on their impact on CQAs, as defined during Stage 1 (Process Design) of the FDA’s validation lifecycle. Parameters are classified as:
Critical: Directly affecting safety/efficacy
Key: Influencing quality but not directly linked to safety
Non-Critical: No measurable impact on quality
This classification informs the depth of risk assessment and tool selection.
2. Select Tools Using the ICU Framework
Importance-Driven Tools: High-importance parameters warrant tools that quantify risk severity and detectability. FMEA is ideal for linking failure modes to patient harm, while Statistical Process Control (SPC) charts monitor real-time variability.
Complexity-Driven Tools: For multi-step processes (e.g., bioreactor operations), HACCP identifies critical control points, while Ishikawa diagrams map cause-effect relationships.
Uncertainty-Driven Tools: Parameters with limited historical data (e.g., novel drug formulations) benefit from Bayesian statistical models or Monte Carlo simulations to address knowledge gaps.
3. Document and Justify Tool Selection
Regulatory agencies require documented rationale for tool choices. For example, a firm using FMEA for a high-risk sterilization process must reference its ability to evaluate worst-case scenarios and prioritize mitigations. This documentation is typically embedded in Quality Risk Management (QRM) Plans or validation protocols.
Integration with Living Risk Assessments
Living risk assessments are dynamic, evolving documents that reflect real-time process knowledge and data. Unlike static, ad-hoc assessments, they are continually updated through:
1. Ongoing Data Integration
Data from Continual Process Verification (CPV)—such as trend analyses of CPPs/CQAs—feeds directly into living risk assessments. For example, shifts in fermentation yield detected via SPC charts trigger updates to bioreactor risk profiles, prompting tool adjustments (e.g., upgrading from checklists to FMEA).
2. Periodic Review Cycles
Living assessments undergo scheduled reviews (e.g., biannually) and event-driven updates (e.g., post-deviation). A QRM Master Plan, as outlined in ICH Q9(R1), orchestrates these reviews by mapping assessment frequencies to parameter criticality. High-impact parameters may be reviewed quarterly, while low-impact ones are assessed annually.
3. Cross-Functional Collaboration
Quality, manufacturing, and regulatory teams collaborate to interpret CPV data and update risk controls. For instance, a rise in particulate matter in vials (detected via CPV) prompts a joint review of filling line risk assessments, potentially revising tooling from HACCP to FMEA to address newly identified failure modes.
Regulatory Expectations and Compliance
Regulatory agencies requires documented justification for CPV tool selection, emphasizing:
Protocol Preapproval: CPV plans must be submitted during Stage 2, detailing tool selection criteria.
Change Control: Transitions between tools (e.g., SPC → thresholds) require risk assessments and documentation.
Training: Staff must be proficient in both traditional (e.g., Shewhart charts) and modern tools (e.g., AI).
A 2024 FDA warning letter cited a firm for using control charts on non-normal data without validation, underscoring the consequences of poor tool alignment.
A Framework for Adaptive Excellence
The FDA’s CPV framework is not prescriptive but principles-based, allowing flexibility in methodology and tool selection. Successful implementation hinges on:
Science-Driven Decisions: Align tools with data characteristics and process capability.
Risk-Based Prioritization: Focus resources on high-impact parameters.
Regulatory Agility: Justify tool choices through documented risk assessments and lifecycle data.
CPV is a living system that must evolve alongside processes, leveraging tools that balance compliance with operational pragmatism. By anchoring decisions in the FDA’s lifecycle approach, manufacturers can transform CPV from a regulatory obligation into a strategic asset for quality excellence.
The allure of shiny new tools in quality management is undeniable. Like magpies drawn to glittering objects, professionals often collect methodologies and technologies without a cohesive strategy. This “magpie syndrome” creates fragmented systems—FMEA here, 5S there, Six Sigma sprinkled in—that resemble disjointed toolkits rather than coherent ecosystems. The result? Confusion, wasted resources, and quality systems that look robust on paper but crumble under scrutiny. The antidote lies in reimagining quality systems not as static machines but as living organizations that evolve, adapt, and thrive.
The Shift from Machine Logic to Organic Design
Traditional quality systems mirror 20th-century industrial thinking: rigid hierarchies, linear processes, and documents that gather dust. These systems treat organizations as predictable machines, relying on policies to command and procedures to control. Yet living systems—forests, coral reefs, cities—operate differently. They self-organize around shared purpose, adapt through feedback, and balance structure with spontaneity. Deming foresaw this shift. His System of Profound Knowledge—emphasizing psychology, variation, and systems thinking—aligns with principles of living systems: coherence without control, stability with flexibility.
At the heart of this transformation is the recognition that quality emerges not from compliance checklists but from the invisible architecture of relationships, values, and purpose. Consider how a forest ecosystem thrives: trees communicate through fungal networks, species coexist through symbiotic relationships, and resilience comes from diversity, not uniformity. Similarly, effective quality systems depend on interconnected elements working in harmony, guided by a shared “DNA” of purpose.
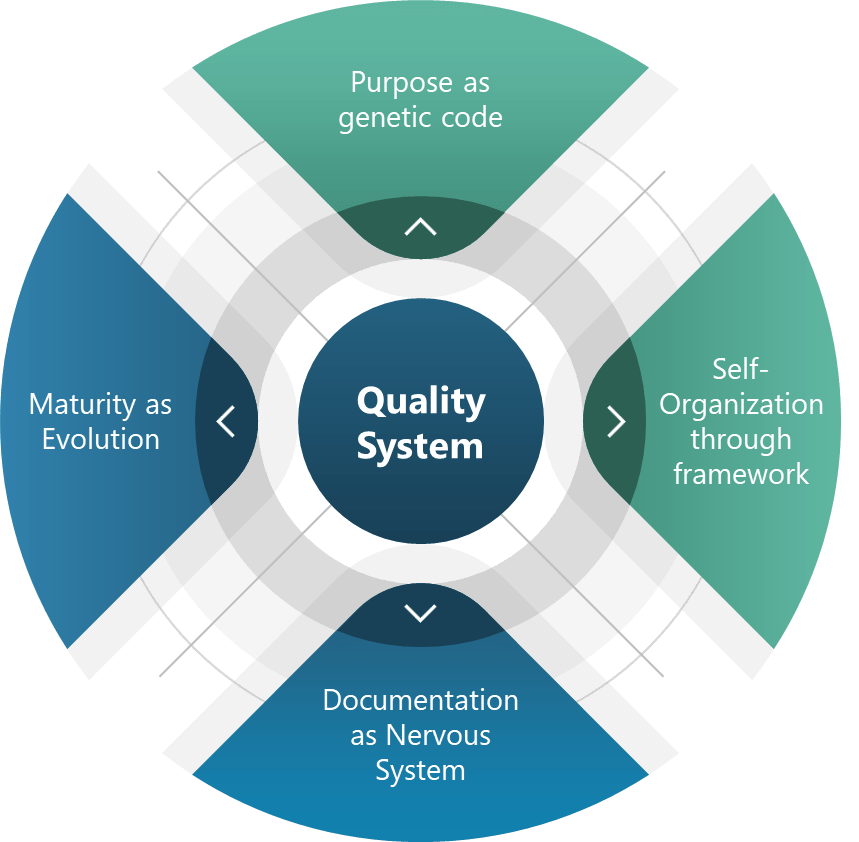
The Four Pillars of Living Quality Systems
Purpose as Genetic Code Every living system has inherent telos—an aim that guides adaptation. For quality systems, this translates to policies that act as genetic non-negotiables. For pharmaceuticals and medical devices this is “patient safety above all.”. This “DNA” allowed teams to innovate while maintaining adherence to core requirements, much like genes express differently across environments without compromising core traits.
Self-Organization Through Frameworks Complex systems achieve order through frameworks as guiding principles. Coherence emerges from shared intent. Deming’s PDSA cycles and emphasis on psychological safety create similar conditions for self-organization.
Documentation as a Nervous System The enhanced document pyramid—policies, programs, procedures, work instructions, records—acts as an organizational nervous system. Adding a “program” level between policies and procedures bridges the gap between intent and action and can transform static documents into dynamic feedback loops.
Maturity as Evolution Living systems evolve through natural selection. Maturity models serve as evolutionary markers:
Ad-hoc (Primordial): Tools collected like random mutations.
Sustainability: Planning for decade-long impacts, not quarterly audits.
Elegance: Simplifying until it hurts, then relaxing slightly.
Coordination: Cross-pollinating across the organization
Convenience: Making compliance easier than non-compliance.
These principles operationalize Deming’s wisdom. Driving out fear (Point 8) fosters psychological safety, while breaking down barriers (Point 9) enables cross-functional symbiosis.
The Quality Professional’s New Role: Gardener, Not Auditor
Quality professionals must embrace a transformative shift in their roles. Instead of functioning as traditional enforcers or document controllers, we are now called to act as stewards of living systems. This evolution requires a mindset change from one of rigid oversight to one of nurturing growth and adaptability. The modern quality professional takes on new identities such as coach, data ecologist, and systems immunologist—roles that emphasize collaboration, learning, and resilience.
To thrive in this new capacity, practical steps must be taken. First, it is essential to prune toxic practices by eliminating fear-driven reporting mechanisms and redundant tools that stifle innovation and transparency. Quality professionals should focus on fostering trust and streamlining processes to create healthier organizational ecosystems. Next, they must plant feedback loops by embedding continuous learning into daily workflows. For instance, incorporating post-meeting retrospectives can help teams reflect on successes and challenges, ensuring ongoing improvement. Lastly, cross-pollination is key to cultivating diverse perspectives and skills. Rotating staff between quality assurance, operations, and research and development encourages knowledge sharing and breaks down silos, ultimately leading to more integrated and innovative solutions.
By adopting this gardener-like approach, quality professionals can nurture the growth of resilient systems that are better equipped to adapt to change and complexity. This shift not only enhances organizational performance but also fosters a culture of continuous improvement and collaboration.
Thriving, Not Just Surviving
Quality systems that mimic life—not machinery—turn crises into growth opportunities. As Deming noted, “Learning is not compulsory… neither is survival.” By embracing living system principles, we create environments where survival is the floor, and excellence is the emergent reward.
Start small: Audit one process using living system criteria. Replace one control mechanism with a self-organizing principle. Share learnings across your organizational “species.” The future of quality isn’t in thicker binders—it’s in cultivating systems that breathe, adapt, and evolve.
ICH Q8 (Pharmaceutical Development), Q9 (Quality Risk Management), and Q10 (Pharmaceutical Quality System) provide a comprehensive framework for transforming change management from a reactive compliance exercise into a strategic enabler of quality and innovation.
The ICH Q8-Q10 triad is my favorite framework pharmaceutical quality systems: Q8’s Quality by Design (QbD) principles establish proactive identification of critical quality attributes (CQAs) and design spaces, shifting the paradigm from retrospective testing to prospective control; Q9 provides the scaffolding for risk-based decision-making, enabling organizations to prioritize resources based on severity, occurrence, and detectability of risks; and, Q10 closes the loop by embedding these concepts into a lifecycle-oriented quality system, emphasizing knowledge management and continual improvement.
These guidelines create a robust foundation for change control. Q8 ensures changes align with product and process understanding, Q9 enables risk-informed evaluation, and Q10 mandates systemic integration across the product lifecycle. This triad rejects the notion of change control as a standalone procedure, instead positioning it as a manifestation of organizational quality culture.
The PIC/S Perspective: Risk-Based Change Management
The PIC/S guidance (PI 054-1) reinforces ICH principles by offering a methodology that emphasizes effectiveness as the cornerstone of change management. It outlines four pillars:
Proposal and Impact Assessment: Systematic evaluation of cross-functional impacts, including regulatory filings, process interdependencies, and stakeholder needs.
Risk Classification: Stratifying changes as critical/major/minor based on potential effects on product quality, patient safety, and data integrity.
Implementation with Interim Controls: Bridging current and future states through mitigations like enhanced monitoring or temporary procedural adjustments.
Effectiveness Verification: Post-implementation reviews using metrics aligned with change objectives, supported by tools like statistical process control (SPC) or continued process verification (CPV).
This guidance operationalizes ICH concepts by mandating traceability from change rationale to verified outcomes, creating accountability loops that prevent “paper compliance.”
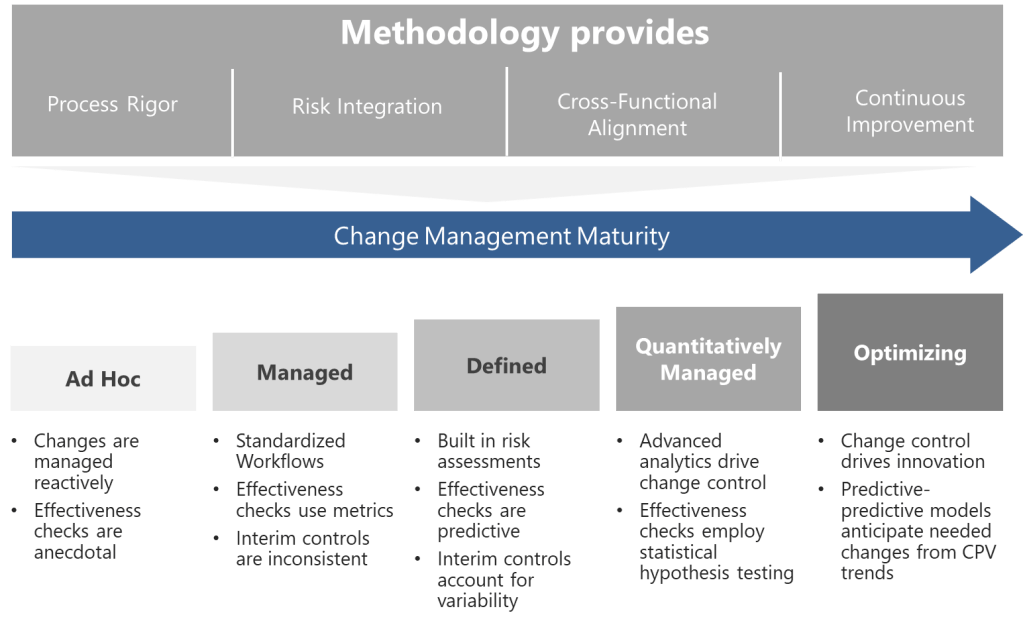
A Five-Level Maturity Model for Change Control
Building on these foundations, I propose a maturity model that evaluates organizational capability across four dimensions, each addressing critical aspects of pharmaceutical change control systems:
Process Rigor
Assesses the standardization, documentation, and predictability of change control workflows.
Higher maturity levels incorporate design space utilization (ICH Q8), automated risk thresholds, and digital tools like Monte Carlo simulations for predictive impact modeling.
Progresses from ad hoc procedures to AI-driven, self-correcting systems that preemptively identify necessary changes via CPV trends.
Risk Integration
Measures how effectively quality risk management (ICH Q9) is embedded into decision-making.
Includes risk-based classification (critical/major/minor), use of the right tool, and dynamic risk thresholds tied to process capability indices (CpK/PpK).
Evaluates collaboration between QA, regulatory, manufacturing, and supply chain teams during change evaluation.
Maturity is reflected in centralized review boards, real-time data integration (e.g., ERP/LIMS connectivity), and harmonized procedures across global sites.
Continuous Improvement
Tracks the organization’s ability to learn from past changes and innovate.
Incorporates metrics like “first-time regulatory acceptance rate” and “change-related deviation reduction.”
Top-tier organizations use post-change data to refine design spaces and update control strategies.
Level 1: Ad Hoc (Chaotic)
At this initial stage, changes are managed reactively. Procedures exist but lack standardization—departments use disparate tools, and decisions rely on individual expertise rather than systematic risk assessment. Effectiveness checks are anecdotal, often reduced to checkbox exercises. Organizations here frequently experience regulatory citations related to undocumented changes or inadequate impact assessments.
Progression Strategy: Begin by mapping all change types and aligning them with ICH Q9 risk principles. Implement a centralized change control procedure with mandatory risk classification.
Level 2: Managed (Departmental)
Changes follow standardized workflows within functions, but silos persist. Risk assessments are performed but lack cross-functional input, leading to unanticipated impacts. Effectiveness checks use basic metrics (e.g., # of changes), yet data analysis remains superficial. Interim controls are applied inconsistently, often overcompensating with excessive conservatism or being their in name only.
Progression Strategy: Establish cross-functional change review boards. Introduce the right level of formality of risk for changes and integrate CPV data into effectiveness reviews.
Level 3: Defined (Integrated)
The organization achieves horizontal integration. Changes trigger automated risk assessments using predefined criteria from ICH Q8 design spaces. Effectiveness checks leverage predictive analytics, comparing post-change performance against historical baselines. Knowledge management systems capture lessons learned, enabling proactive risk identification. Interim controls are fully operational, with clear escalation paths for unexpected variability.
Progression Strategy: Develop a unified change control platform that connects to manufacturing execution systems (MES) and laboratory information management systems (LIMS). Implement real-time dashboards for change-related KPIs.
Level 4: Quantitatively Managed (Predictive)
Advanced analytics drive change control. Machine learning models predict change impacts using historical data, reducing assessment timelines. Risk thresholds dynamically adjust based on process capability indices (CpK/PpK). Effectiveness checks employ statistical hypothesis testing, with sample sizes calculated via power analysis. Regulatory submissions for post-approval changes are partially automated through ICH Q12-enabled platforms.
Progression Strategy: Pilot digital twins for high-complexity changes, simulating outcomes before implementation. Formalize partnerships with regulators for parallel review of major changes.
Level 5: Optimizing (Self-Correcting)
Change control becomes a source of innovation. Predictive-predictive models anticipate needed changes from CPV trends. Change histories provide immutable audit trails across the product. Autonomous effectiveness checks trigger corrective actions via integrated CAPA systems. The organization contributes to industry-wide maturity through participation in various consensus standard and professional associations.
Progression Strategy: Institutionalize a “change excellence” function focused on benchmarking against emerging technologies like AI-driven root cause analysis.
Methodological Pillars: From Framework to Practice
Translating this maturity model into practice requires three methodological pillars:
1. QbD-Driven Change Design Leverage Q8’s design space concepts to predefine allowable change ranges. Changes outside the design space trigger Q9-based risk assessments, evaluating impacts on CQAs using tools like cause-effect matrices. Fully leverage Q12.
2. Risk-Based Resourcing Apply Q9’s risk prioritization to allocate resources proportionally. A minor packaging change might require a 2-hour review by QA, while a novel drug product process change engages R&D, regulatory, and supply chain teams in a multi-week analysis. Remember, the “level of effort commensurate with risk” prevents over- or under-management.
3. Closed-Loop Verification Align effectiveness checks with Q10’s lifecycle approach. Post-change monitoring periods are determined by statistical confidence levels rather than fixed durations. For instance, a formulation change might require 10 consecutive batches within CpK >1.33 before closure. PIC/S-mandated evaluations of unintended consequences are automated through anomaly detection algorithms.
Overcoming Implementation Barriers
Cultural and technical challenges abound in maturity progression. Common pitfalls include:
Overautomation: Implementing digital tools before standardizing processes, leading to “garbage in, gospel out” scenarios.
Patient-Centric Changes: Direct integration of patient-reported outcomes (PROs) into change effectiveness criteria.
Maturity as a Journey, Not a Destination
The proposed model provides a roadmap—not a rigid prescription—for advancing change control. By grounding progression in ICH Q8-Q10 and PIC/S principles, organizations can systematically enhance their change agility while maintaining compliance. Success requires viewing maturity not as a compliance milestone but as a cultural commitment to excellence, where every change becomes an opportunity to strengthen quality and accelerate innovation.
In an era of personalized medicines and decentralized manufacturing, the ability to manage change effectively will separate thriving organizations from those merely surviving. The journey begins with honest self-assessment against this model and a willingness to invest in the systems, skills, and culture that make maturity possible.
Since the Trump administration’s return to power in January 2025, the U.S. Food and Drug Administration (FDA) has faced sweeping changes to its regulatory framework, advisory processes, and workforce stability. These developments—driven by executive orders, leadership appointments, and policy shifts—have reshaped the agency’s operations during a critical period of public health challenges.
January 2025: Leadership Transition and Regulatory Freeze
The administration began with a regulatory freeze enacted on January 20, 2025, halting all new FDA rulemaking pending review by incoming leadership. This directly delayed critical updates, including medical device classifications and food safety protocols. Simultaneously, Robert F. Kennedy Jr. assumed leadership of the Department of Health and Human Services (HHS), bringing his longstanding opposition to vaccines into federal health policy. Despite pledging to maintain CDC vaccine recommendations, Kennedy declined to retract past claims linking vaccines to autism during his confirmation hearings, signaling his true intents.
Staffing cuts emerged immediately as a priority. HHS announced plans to reduce its workforce by 24%, translating to approximately 3,500 FDA positions. Early layoffs targeted probationary staff in food safety, medical devices, and tobacco divisions, exacerbating existing vacancies documented in a November 2024 GAO report. The FDA’s drug inspection workforce, already 36% smaller than pre-pandemic levels, faced further attrition, with 63% of investigators having fewer than five years of experience.
February 2025: Advisory Committee Disruptions and Workforce Pressures
February saw the cancellation of two pivotal advisory committee meetings: the FDA’s Vaccines and Related Biological Products Advisory Committee (VRBPAC) and the CDC’s Advisory Committee on Immunization Practices (ACIP). These groups, which traditionally review flu vaccine strains and public health recommendations, were sidelined despite a severe 2024–2025 flu season causing up to 92,000 deaths. The administration’s reluctance to convene independent experts marked a departure from decades of transparent vaccine policy development.
Workforce challenges deepened with the February 11 executive order mandating a 4:1 attrition-to-hiring ratio across federal agencies. At the FDA, this exacerbated recruitment struggles in specialized roles, particularly food safety inspectors—25% of whom were retirement-eligible by mid-2024. GAO data revealed the agency had conducted only 917 annual foreign food inspections since 2018, far below its 19,200-target mandate. Domestic inspection backlogs worsened as experienced staff diverted time to train new hires.
March 2025: Policy Shifts and Vaccine Oversight Changes
March brought structural reforms to FDA’s regulatory processes. Secretary Kennedy directed revisions to the Generally Recognized as Safe (GRAS) rule, specifically targeting industry self-affirmed safety determinations for food additives—a move aligned with his criticism of ultra-processed foods. Simultaneously, the FDA revoked authorization for 35 PFAS-containing food contact substances, reflecting heightened chemical safety concerns but straining already limited compliance staff.
Vaccine oversight faced indirect pressure. While no formal guidance withdrawals occurred, Kennedy’s influence raised fears of stricter development criteria for future vaccines. The Office of Vaccines Research and Review (OVRR), depleted by pre-2025 staff departures, risked slowed review timelines amid ongoing attrition. Industry analysts noted that VRBPAC’s cancellation forced manufacturers to align flu vaccine production with non-U.S. markets first, complicating domestic rollout schedules.
Ongoing Impacts: Staffing, Inspections, and Public Health Risks
Workforce and Inspection Capacity
The FDA’s inspectional workforce crisis, highlighted in multiple GAO reports, has reached critical levels. Drug inspections remain 36% below pre-pandemic volumes, with foreign site evaluations particularly lagging. Food safety inspections face similar shortfalls: FDA met only 60% of high-risk domestic facility targets in 2023, contributing to preventable outbreaks like the 2024 E. coli-linked onion crisis. Training new food inspectors requires two years, ensuring gaps will persist and get worse.
Advisory Board Erosion
The administration’s dismissal of advisory committees has introduced unpredictability into vaccine policy. By bypassing VRBPAC for the 2025–2026 flu vaccine strain selection, the FDA abandoned a 50-year precedent of transparent expert review. This politicization risks public trust, particularly as Kennedy’s team weighs revisions to vaccine development guidance without formal stakeholder input.
Regulatory Uncertainty
The regulatory freeze has stalled over 170 planned guidance documents, including updates to AI-enabled medical device oversight and compounding pharmacy rules. Combined with staffing shortages, this has delayed responses to emerging issues like long COVID therapies and drug compounding disputes.
Evaluating the Broader Impact
The Trump administration’s FDA reforms prioritize deregulation and workforce reduction, but collateral damage to public health safeguards is evident:
Food and Drug Safety Risks: Inspection backlogs increase the likelihood of undetected manufacturing violations. GAO warns that inexperienced staff may miss critical compliance issues, elevating risks of adulterated products reaching consumers.
Vaccine Development Challenges: While no direct policy reversals have occurred, the erosion of advisory input and OVRR staffing cuts threaten to delay novel vaccine approvals and strain pandemic preparedness.
Industry Adaptation Costs: Pharmaceutical and food manufacturers face uncertainty as delayed guidance and abrupt policy shifts (e.g., GRAS revisions) disrupt long-term planning.
Global Health Isolation: Withdrawal from WHO collaborations like the Medical Device Single Audit Program (MDSAP) complicates international market access for U.S. device manufacturers.
Conclusion: A Agency at a Crossroads
The FDA’s first quarter under the second Trump administration leadership reveals an agency straining to with foundational public health mandates. Workforce attrition, politicized advisory processes, and stalled rulemaking have collectively undermined the FDA’s capacity to proactively address foodborne illness, drug safety, and vaccine development. With little hope for congressional action to stabilize staffing and safeguard advisory mechanisms, the FDA risks becoming a reactive rather than preventive force in U.S. healthcare—a shift with consequences that could resonate for decades.