As we celebrate International Workers’ Day this May 1st, it is an opportune moment to reflect on the profound connection between workers’ rights and effective quality management. The pursuit of quality cannot be separated from how we treat, empower, and respect the rights of those who create that quality daily. Today’s post examines this critical relationship, drawing from the principles I’ve advocated throughout my blog, and challenges us to reimagine quality management as fundamentally worker-centered.
The Historical Connection Between Workers’ Rights and Quality
International Workers’ Day commemorates the historic struggles and gains made by workers and the labor movement. This celebration reminds us that the evolution of quality management has paralleled the fight for workers’ rights. Quality is inherently a progressive endeavor, fundamentally anti-Taylorist in nature. Frederick Taylor’s scientific management approach reduced workers to interchangeable parts in a machine, stripping them of autonomy and creativity – precisely the opposite of what modern quality management demands.
The quality movement, from Deming onwards, has recognized that treating workers as mere cogs undermines the very foundations of quality. When we champion human rights and center those whose rights are challenged, we’re not engaging in politics separate from quality – we’re acknowledging the fundamental truth that quality cannot exist without empowered, respected workers.
Driving Out Fear: The Essential Quality Right
“No one can put in his best performance unless he feels secure,” wrote Deming thirty-five years ago. Yet today, fear remains ubiquitous in corporate culture, undermining the very quality we seek to create. As quality professionals, we must confront this reality at every opportunity.
Fear in the workplace manifests in multiple ways, each destructive to quality:
Source of Fear
Description
Impact on Quality
Competition
Managers often view anxiety generated by competition between co-workers as positive, encouraging competition for scarce resources, power, and status
Undermines collaboration necessary for system-wide quality improvements
Focus on finding fault rather than improving systems, often centered around the concept of “human error”
Discourages reporting of issues, driving quality problems underground
When workers operate in fear, quality inevitably suffers. They hide mistakes rather than report them, avoid innovation for fear of failure, and focus on protecting themselves rather than improving systems. Driving out fear isn’t just humane – it’s essential for quality.
Key Worker Rights in Quality Management
Quality management systems that respect workers’ rights create environments where quality can flourish. Based on workplace investigation principles, these rights extend naturally to all quality processes.
The Right to Information
In any quality system, clarity is essential. Workers have the right to understand quality requirements, the rationale behind procedures, and how their work contributes to the overall quality system. Transparency sets the stage for collaboration, where everyone works toward a common quality goal with full understanding.
The Right to Confidentiality and Non-Retaliation
Workers must feel safe reporting quality issues without fear of punishment. This means protecting their confidentiality when appropriate and establishing clear non-retaliation policies. One of the pillars of workplace equity is ensuring that employees are shielded from retaliation when they raise concerns, reinforcing a commitment to a culture where individuals can voice quality issues without fear.
The Right to Participation and Representation
The Who-What Matrix is a powerful tool to ensure the right people are involved in quality processes. By including a wider set of people, this approach creates trust, commitment, and a sense of procedural justice-all essential for quality success. Workers deserve representation in decisions that affect their ability to produce quality work.
Worker Empowerment: The Foundation of Quality Culture
Empowerment is not just a nice-to-have; it’s a foundational element of any true quality culture. When workers are entrusted with authority to make decisions, initiate actions, and take responsibility for outcomes, both job satisfaction and quality improve. Unfortunately, empowerment rhetoric is sometimes misused within quality frameworks like TQM, Lean, and Six Sigma to justify increased work demands rather than genuinely empowering workers.
The concept of empowerment has its roots in social movements, including civil rights and women’s rights, where it described the process of gaining autonomy and self-determination for marginalized groups. In quality management, this translates to giving workers real authority to improve processes and address quality issues.
Mary Parker Follett’s Approach to Quality Through Autonomy
Follett emphasized giving workers autonomy to complete their jobs effectively, believing that when workers have freedom, they become happier, more productive, and more engaged. Her “power with” principle suggests that power should be shared broadly rather than concentrated, fostering a collaborative environment where quality can thrive.
Rejecting the Great Man Fallacy
Quality regulations often fall into the trap of the “Great Man Fallacy” – the misguided notion that one person through education, experience, and authority can ensure product safety, efficacy, and quality. This approach is fundamentally flawed.
People only perform successfully when they operate within well-built systems. Process drives success by leveraging the right people at the right time making the right decisions with the right information. No single person can ensure quality, and thinking otherwise sets up both individuals and systems for failure.
Instead, we need to build processes that leverage teams, democratize decisions, and drive reliable results. This approach aligns perfectly with respecting workers’ rights and empowering them as quality partners rather than subjects of quality control.
Quality Management as a Program: Centering Workers’ Rights
Quality needs to be managed as a program, walking a delicate line between long-term goals, short-term objectives, and day-to-day operations. As quality professionals, we must integrate workers’ rights into this program approach.
The challenges facing quality today-from hyperautomation to shifting customer expectations-can only be addressed through worker empowerment. Consider how these challenges demand a worker-centered approach:
Challenge
Impact on Quality Management
Worker-Centered Approach
Advanced Analytics
Requires holistic data analysis and application
Develop talent strategies that upskill workers rather than replacing them
Hyper-Automation
Tasks previously done by humans being automated
Involve workers in automation decisions; focus on how automation can enhance rather than replace human work
Virtualization of Work
Rethinking how quality is executed in digital environments
Ensure workers have input on how virtual quality processes are designed
Need to adapt to changing risk levels in real-time
Enable employees to make faster decisions by building quality-informed judgment
Digitally Native Workforce
Changed expectations for how work is managed
Connect quality to values employees care about: autonomy, innovation, social issues
To meet these challenges, we must shift from viewing quality as a function to quality as an interdisciplinary, participatory process. We need to break down silos and build autonomy, encouraging personal buy-in through participatory quality management.
May Day as a Reminder of Our Quality Mission
As International Workers’ Day approaches, I’m reminded that our quality mission is inseparable from our commitment to workers’ rights. This May Day, I encourage all quality professionals to:
Evaluate how your quality systems either support or undermine workers’ rights
Identify and eliminate sources of fear in your quality processes
Create mechanisms for meaningful worker participation in quality decisions
Reject hierarchical quality models in favor of democratic, empowering approaches
Recognize that centering workers’ rights isn’t just ethical-it’s essential for quality
Quality management without respect for workers’ rights is not just morally questionable-it’s ineffective. The future of quality lies in approaches that are predictive, connected, flexible, and embedded. These can only be achieved when workers are treated as valued partners with protected rights and real authority.
This May Day, let’s renew our commitment to driving out fear, empowering workers, and building quality systems that respect the dignity and rights of every person who contributes to them. In doing so, we honor not just the historical struggles of workers, but also the true spirit of quality that puts people at its center.
What steps will you take this International Workers’ Day to strengthen the connection between workers’ rights and quality in your organization?
How you respond in the first 24 hours after discovering a deviation can make the difference between a minor quality issue and a major compliance problem. This critical window-what I call “The Golden Day”-represents your best opportunity to capture accurate information, contain potential risks, and set the stage for a successful investigation. When managed effectively, this initial day creates the foundation for identifying true root causes and implementing effective corrective actions that protect product quality and patient safety.
Why the First 24 Hours Matter: The Evidence
The initial response to a deviation is crucial for both regulatory compliance and effective problem-solving. Industry practice and regulatory expectations align on the importance of quick, systematic responses to deviations.
Regulatory expectations explicitly state that deviation investigation and root cause determination should be completed in a timely manner, and industry expectations usually align on deviations being completed within 30 days of discovery.
In the landmark U.S. v. Barr Laboratories case, “the Court declared that all failure investigations must be performed promptly, within thirty business days of the problem’s occurrence”
Best practices recommend assembling a cross-functional team immediately after deviation discovery and conduct initial risk assessment within 24 hours”
Initial actions taken in the first day directly impact the quality and effectiveness of the entire investigation process
When you capitalize on this golden window, you’re working with fresh memories, intact evidence, and the highest chance of observing actual conditions that contributed to the deviation.
Clear, precise problem definition forms the foundation of any effective investigation. Vague or incomplete problem statements lead to misdirected investigations and ultimately, inadequate corrective actions.
Document using specific, factual language that describes what occurred versus what was expected
Include all relevant details such as procedure and equipment numbers, product names and lot numbers
Apply the 5W2H method (What, When, Where, Who, Why if known, How much is involved, and How it was discovered)
Avoid speculation about causes in the initial description
Remember that the description should incorporate relevant records and photographs of discovered defects.
5W2H
Typical questions
Contains
Who?
Who are the people directly concerned with the problem? Who does this? Who should be involved but wasn’t? Was someone involved who shouldn’t be?
User IDs, Roles and Departments
What?
What happened?
Action, steps, description
When?
When did the problem occur?
Times, dates, place In process
Where?
Where did the problem occur?
Location
Why is it important?
Why did we do this? What are the requirements? What is the expected condition?
Justification, reason
How?
How did we discover. Where in the process was it?
Method, process, procedure
How Many? How Much?
How many things are involved? How often did the situation happen? How much did it impact?
Number, frequency
The quality of your deviation documentation begins with this initial identification. As I’ve emphasized in previous posts, the investigation/deviation report should tell a story that can be easily understood by all parties well after the event and the investigation. This narrative begins with clear identification on day one.
Elements
Problem Statement
Is used to…
Understand and target a problem. Providing a scope. Evaluate any risks. Make objective decisions
Answers the following… (5W2H)
What? (problem that occurred);When? (timing of what occurred); Where? (location of what occurred); Who? (persons involved/observers); Why? (why it matters, not why it occurred); How Much/Many? (volume or count); How Often? (First/only occurrence or multiple)
Contains…
Object (What was affected?); Defect (What went wrong?)
GEMBA-the actual place where work happens-is a cornerstone concept in quality management. When a deviation occurs, there is no substitute for being physically present at the location.
Observe the actual conditions and environment firsthand
Notice details that might not be captured in written reports
Understand the workflow and context surrounding the deviation
Gather physical evidence before it’s lost or conditions change
Create the opportunity for meaningful conversations with operators
Human error occurs because we are human beings. The extent of our knowledge, training, and skill has little to do with the mistakes we make. We tire, our minds wander and lose concentration, and we must navigate complex processes while satisfying competing goals and priorities – compliance, schedule adherence, efficiency, etc.
Foremost to understanding human performance is knowing that people do what makes sense to them given the available cues, tools, and focus of their attention at the time. Simply put, people come to work to do a good job – if it made sense for them to do what they did, it will make sense to others given similar conditions. The following factors significantly shape human performance and should be the focus of any human error investigation:
Physical Environment Environment, tools, procedures, process design
Organizational Culture Just- or blame-culture, attitude towards error
Management and Supervision Management of personnel, training, procedures
We do not want to see or experience human error – but when we do, it’s imperative to view it as a valuable opportunity to improve the system or process. This mindset is the heart of effective human error prevention.
Conducting an Effective GEMBA Walk for Deviations
When conducting your GEMBA walk specifically for deviation investigation:
Arrive with a clear purpose and structured approach
Observe before asking questions
Document observations with photos when appropriate
Look for environmental factors that might not appear in reports
Pay attention to equipment configuration and conditions
Note how operators interact with the process or equipment
A deviation gemba is a cross-functional team meeting that is assembled where a potential deviation event occurred. Going to the gemba and “freezing the scene” as close as possible to the time the event occurred will yield valuable clues about the environment that existed at the time – and fresher memories will provide higher quality interviews. This gemba has specific objectives:
Obtain a common understanding of the event: what happened, when and where it happened, who observed it, who was involved – all the facts surrounding the event. Is it a deviation?
Clearly describe actions taken, or that need to be taken, to contain impact from the event: product quarantine, physical or mechanical interventions, management or regulatory notifications, etc.
Interview involved operators: ask open-ended questions, like how the event unfolded or was discovered, from their perspective, or how the event could have been prevented, in their opinion – insights from personnel experienced with the process can prove invaluable during an investigation.
Deviation GEMBA Tips
Typically there is time between when notification of a deviation gemba goes out and when the team is scheduled to assemble. It is important to come prepared to help facilitate an efficient gemba:
Assemble procedures and other relevant documents and records. This will make references easier during the gemba.
Keep your team on-track – the gemba should end with the team having a common understanding of the event, actions taken to contain impact, and the agreed-upon next steps of the investigation.
You will gain plenty of investigational leads from your observations and interviews at the gemba – which documents to review, which personnel to interview, which equipment history to inspect, and more. The gemba is such an invaluable experience that, for many minor events, root cause and CAPA can be determined fairly easily from information gathered solely at the gemba.
Informal Rubric for Conducting a Good Deviation GEMBA
Describe the timeliness of the team gathering at the gemba.
Were all required roles and experts present?
Was someone leading or facilitating the gemba?
Describe any interviews the team performed during the gemba.
Did the team get sidetracked or off-topic during the gemba
Was the team prepared with relevant documentation or information?
Did the team determine batch impact and any reportability requirements?
Did the team satisfy the objectives of the gemba?
What did the team do well?
What could the team improve upon?
Speaking with Operators: The Power of Cognitive Interviewing
Interviewing personnel who were present when the deviation occurred requires special techniques to elicit accurate, complete information. Traditional questioning often fails to capture critical details.
Cognitive interviewing, as I outlined in my previous post on “Interviewing,” was originally created for law enforcement and later adopted during accident investigations by the National Transportation Safety Board (NTSB). This approach is based on two key principles:
Witnesses need time and encouragement to recall information
Retrieval cues enhance memory recall
How to Apply Cognitive Interviewing in Deviation Investigations
Mental Reinstatement: Encourage the interviewee to mentally recreate the environment and people involved
In-Depth Reporting: Encourage the reporting of all the details, even if it is minor or not directly related
Multiple Perspectives: Ask the interviewee to recall the event from others’ points of view
Several Orders: Ask the interviewee to recount the timeline in different ways. Beginning to end, end to beginning
Most importantly, conduct these interviews at the actual location where the deviation occurred. A key part of this is that retrieval cues access memory. This is why doing the interview on the scene (or Gemba) is so effective.
Component
What It Consists of
Mental Reinstatement
Encourage the interviewee to mentally recreate the environment and people involved.
In-Depth Reporting
Encourage the reporting of all the details.
Multiple Perspectives
Ask the interviewee to recall the event from others’ points of view.
Several Orders
Ask the interviewee to recount the timeline in different ways.
Approach the Interviewee Positively:
Ask for the interview.
State the purpose of the interview.
Tell interviewee why he/she was selected.
Avoid statements that imply blame.
Focus on the need to capture knowledge
Answer questions about the interview.
Acknowledge and respond to concerns.
Manage negative emotions.
Apply these Four Components:
Use mental reinstatement.
Report everything.
Change the perspective.
Change the order.
Apply these Two Principles:
Witnesses need time and encouragement to recall information.
Retrieval cues enhance memory recall.
Demonstrate these Skills:
Recreate the original context and had them walk you through process.
Tell the witness to actively generate information.
Adopt the witness’s perspective.
Listen actively, do not interrupt, and pause before asking follow-up questions.
Ask open-ended questions.
Encourage the witness to use imagery.
Perform interview at the Gemba.
Follow sequence of the four major components.
Bring support materials.
Establish a connection with the witness.
Do Not tell them how they made the mistake.
Initial Impact Assessment: Understanding the Scope
Within the first 24 hours, a preliminary impact assessment is essential for determining the scope of the deviation and the appropriate response.
Apply a risk-based approach to categorize the deviation as critical, major, or minor
Evaluate all potentially affected products, materials, or batches
Consider potential effects on critical quality attributes
Assess possible regulatory implications
Determine if released products may be affected
This impact assessment is also the initial risk assessment, which will help guide the level of effort put into the deviation.
Factors to Consider in Initial Risk Assessment
Patient safety implications
Product quality impact
Compliance with registered specifications
Potential for impact on other batches or products
Regulatory reporting requirements
Level of investigation required
This initial assessment will guide subsequent decisions about quarantine, notification requirements, and the depth of investigation needed. Remember, this is a preliminary assessment that will be refined as the investigation progresses.
Immediate Actions: Containing the Issue
Once you’ve identified the deviation and assessed its potential impact, immediate actions must be taken to contain the issue and prevent further risk.
Quarantine potentially affected products or materials to prevent their release or further use
Notify key stakeholders, including quality assurance, production supervision, and relevant department heads
Implement temporary corrective or containment measures
Document the deviation in your quality management system
Secure relevant evidence and documentation
Consider whether to stop related processes
Industry best practices emphasize that you should Report the deviation in real-time. Notify QA within 24 hours and hold the GEMBA. Remember that “if you don’t document it, it didn’t happen” – thorough documentation of both the deviation and your immediate response is essential.
Affected vs Related Batches
Not every Impact is the same, so it can be helpful to have two concepts: Affected and Related.
Affected Batch: Product directly impacted by the event at the time of discovery, for instance, the batch being manufactured or tested when the deviation occurred.
Related Batch: Product manufactured or tested under the same conditions or parameters using the process in which the deviation occurred and determined as part of the deviation investigation process to have no impact on product quality.
Setting Up for a Successful Full Investigation
The final step in the golden day is establishing the foundation for the comprehensive investigation that will follow.
Assemble a cross-functional investigation team with relevant expertise
Define clear roles and responsibilities for team members
Establish a timeline for the investigation (remembering the 30-day guideline)
Identify additional data or evidence that needs to be collected
Plan for any necessary testing or analysis
Schedule follow-up interviews or observations
In my post on handling deviations, I emphasized that you must perform a time-sensitive and thorough investigation within 30 days. The groundwork laid during the golden day will make this timeline achievable while maintaining investigation quality.
Planning for Root Cause Analysis
During this setup phase, you should also begin planning which root cause analysis tools might be most appropriate for your investigation. Select tools based on the event complexity and the number of potential root causes and when “human error” appears to be involved, prepare to dig deeper as this is rarely the true root cause
Identifying Phase of your Investigation
If
Then you are at
The problem is not understood. Boundaries have not been set. There could be more than one problem
Problem Understanding
Data needs to be collected. There are questions about frequency or occurrence. You have not had interviews
Data Collection
Data has been collected but not analyszed
Data Analysis
The root cause needs to be determined from the analyzed data
A picture of the separate steps of a process in sequential order, including:
materials or services entering or leaving the process (inputs and outputs)
decisions that must be made
people who become involved
time involved at each step, and/or
process measurements.
Critical Incident Technique (CIT)
A process used for collecting direct observations of human behavior that
have critical significance, and
meet methodically defined criteria.
Comparative Analysis
A technique that focuses a problem-solving team on a problem. It compares one or more elements of a problem or process to evaluate elements that are similar or different (e.g. comparing a standard process to a failing process).
Performance Matrix
A tool that describes the participation by various roles in completing tasks or deliverables for a project or business process. Note: It is especially useful in clarifying roles and responsibilities in cross-functional/departmental positions.
5W2H Analysis
An approach that defines a problem and its underlying contributing factors by systematically asking questions related to who, what, when, where, why, how, and how much/often.
Data Collection
Surveys
A technique for gathering data from a targeted audience based on a standard set of criteria.
Check Sheets
A technique to compile data or observations to detect and show trends/patterns.
Cognitive Interview
An interview technique used by investigators to help the interviewee recall specific memories from a specific event.
KNOT Chart
A data collection and classification tool to organize data based on what is
Known
Need to know
Opinion, and
Think we know.
Data Analysis
Pareto Chart
A technique that focuses efforts on problems offering the greatest potential for improvement.
Histogram
A tool that
summarizes data collected over a period of time, and
graphically presents frequency distribution.
Scatter Chart
A tool to study possible relationships between changes in two different sets of variables.
Run Chart
A tool that captures study data for trends/patterns over time.
Affinity Diagram
A technique for brainstorming and summarizing ideas into natural groupings to understand a problem.
Root Cause Analysis
Interrelationship Digraphs
A tool to identify, analyze, and classify cause and effect relationships among issues so that drivers become part of an effective solution.
Why-Why
A technique that allows one to explore the cause-and-effect relationships of a particular problem by asking why; drilling down through the underlying contributing causes to identify root cause.
Is/Is Not
A technique that guides the search for causes of a problem by isolating the who, what, when, where, and how of an event. It narrows the investigation to factors that have an impact and eliminates factors that do not have an impact. By comparing what the problem is with what the problem is not, we can see what is distinctive about a problem which leads to possible causes.
Structured Brainstorming
A technique to identify, explore, and display the
factors within each root cause category that may be affecting the problem/issue, and/or
effect being studied through this structured idea-generating tool.
Cause and Effect Diagram (Ishikawa/Fishbone)
A tool to display potential causes of an event based on root cause categories defined by structured brainstorming using this tool as a visual aid.
Causal Factor Charting
A tool to
analyze human factors and behaviors that contribute to errors, and
identify behavior-influencing factors and gaps.
Other Tools
Prioritization Matrix
A tool to systematically compare choices through applying and weighting criteria.
Control Chart
A tool to monitor process performance over time by studying its variation and source.
Process Capability
A tool to determine whether a process is capable of meeting requirements or specifications.
Making the Most of Your Golden Day
The first 24 hours after discovering a deviation represent a unique opportunity that should not be wasted. By following the structured approach outlined in this post-identifying the problem clearly, going to the GEMBA, interviewing operators using cognitive techniques, conducting an initial impact assessment, taking immediate containment actions, and setting up for the full investigation-you maximize the value of this golden day.
Remember that excellent deviation management is directly linked to product quality, patient safety, and regulatory compliance. Each well-managed deviation is an opportunity to strengthen your quality system.
I encourage you to assess your current approach to the first 24 hours of deviation management. Are you capturing the full value of this golden day, or are you letting critical information slip away? Implement these strategies, train your team on proper deviation triage, and transform your deviation response from reactive to proactive.
Your deviation management effectiveness doesn’t begin when the investigation report is initiated-it begins the moment a deviation is discovered. Make that golden day count.
Quality needs to be managed as a program, and as such, it must walk a delicate line between setting long-term goals, short-term goals, improvement priorities, and interacting with a suite of portfolios, programs, and KPIs. As quality professionals navigate increasingly complex regulatory landscapes, technological disruptions, and evolving customer expectations, the need for structured approaches to quality planning has never been greater.
At the heart of this activity, I use an x-matrix, a powerful tool at the intersection of strategic planning and quality management. The X-Matrix provides a comprehensive framework that clarifies the chaos, visually representing how long-term quality objectives cascade into actionable initiatives with clear ownership and metrics – connecting the dots between aspiration and execution in a single, coherent framework.
Understanding the X-Matrix: Structure and Purpose
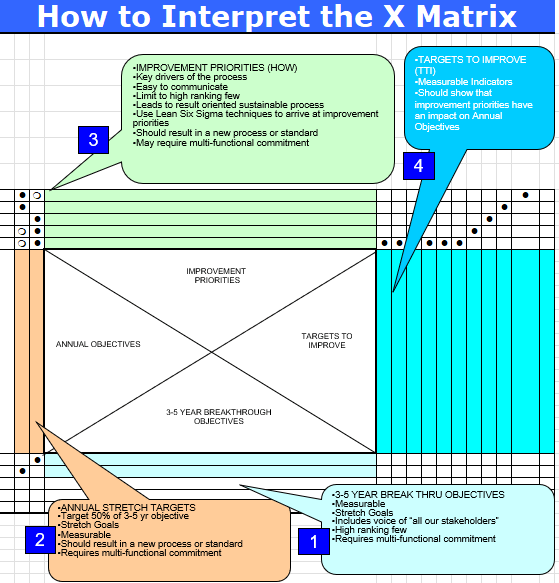
The X-Matrix is a strategic planning tool from Hoshin Kanri methodology that brings together multiple dimensions of organizational strategy onto a single page. Named for its distinctive X-shaped pattern of relationships, this tool enables us to visualize connections between long-term breakthroughs, annual objectives, improvement priorities, and measurable targets – all while clarifying ownership and resource allocation.
The X-Matrix is structured around four key quadrants that create its distinctive shape:
South Quadrant (3-5 Year Breakthrough Objectives): These are the foundational, long-term quality goals that align with organizational vision and regulatory expectations. In quality contexts, these might include achieving specific quality maturity levels, establishing new quality paradigms, or fundamentally transforming quality systems.
West Quadrant (Annual Objectives): These represent the quality priorities for the coming year that contribute directly to the longer-term breakthroughs. These objectives are specific enough to be actionable within a one-year timeframe.
North Quadrant (Improvement Priorities): These are the specific initiatives, projects, and process improvements that will be undertaken to achieve the annual objectives. Each improvement priority should have clear ownership and resource allocation.
East Quadrant (Targets/Metrics): These are the measurable indicators that will be used to track progress toward both annual objectives and breakthrough goals. In quality planning, these often include process capability indices, deviation rates, right-first-time metrics, and other key performance indicators.
The power of the X-Matrix lies in the correlation points where these quadrants intersect. These intersections show how initiatives support objectives and how objectives align with long-term goals. They create a clear line of sight from strategic quality vision to daily operations and improvement activities.
Why the X-Matrix Excels for Quality Planning
Traditional quality planning approaches often suffer from disconnection between strategic objectives and tactical activities. Quality initiatives may be undertaken in isolation, with limited understanding of how they contribute to broader organizational goals. The X-Matrix addresses this fragmentation through its integrated approach to planning.
The X-Matrix provides visibility into the interdependencies within your quality system. By mapping the relationships between long-term quality objectives, annual goals, improvement priorities, and key metrics, quality leaders can identify potential resource conflicts, capability gaps, and opportunities for synergy.
Developing an X-Matrix necessitates cross-functional input and alignment to ensure that quality objectives are not isolated but integrated with operations, regulatory, supply chain, and other critical functions. The development of an X-Matrix encourages the back-and-forth dialogue necessary to develop realistic, aligned goals.
Perhaps most importantly for quality organizations, the X-Matrix provides the structure and rigor to ensure quality planning is not left to chance. As the FDA and other regulatory bodies increasingly emphasize Quality Management Maturity (QMM) as a framework for evaluating pharmaceutical operations, the disciplined approach embodied in the X-Matrix becomes a competitive advantage. The matrix systematically considers resource constraints, capability requirements, and performance measures – all essential components of mature quality systems.
Mapping Modern Quality Challenges to the X-Matrix
The quality landscape is evolving rapidly, with several key challenges that must be addressed in any comprehensive quality planning effort. The X-Matrix provides an ideal framework for addressing these challenges systematically. Building on the post “The Challenges Ahead for Quality” we can start to build our an X-matrix.
Advanced Analytics and Digital Transformation
As data sources multiply and processing capabilities expand, quality organizations face increased expectations for data-driven insights and decision-making. An effective X-Matrix for quality planning couldinclude:
3-5 Year Breakthrough: Establish a predictive quality monitoring system that leverages advanced analytics to identify potential quality issues before they manifest.
Annual Objectives: Implement data visualization tools for key quality metrics; establish data governance framework for GxP data; develop predictive models for critical quality attributes.
Improvement Priorities: Create cross-functional data science capability; implement automated data capture for batch records; develop real-time dashboards for process parameters.
Metrics: Percentage of quality decisions made with data-driven insights; predictive model accuracy; reduction in quality investigation cycle time through analytics.
Operational Stability in Complex Supply Networks
As pharmaceutical manufacturing becomes increasingly globalized with complex supplier networks, operational stability emerges as a critical challenge. Operational stability represents the state where manufacturing and quality processes exhibit consistent, predictable performance over time with minimal unexpected variation. The X-Matrix can address this through:
3-5 Year Breakthrough: Achieve Level 4 (Proactive) operational stability across all manufacturing sites, networks and key suppliers.
Annual Objectives: Implement statistical process control for critical processes; establish supplier quality alignment program; develop operational stability metrics and monitoring system.
Improvement Priorities: Deploy SPC training and tools; conduct operational stability risk assessments; implement regular supplier quality reviews; establish cross-functional stability team.
Metrics: Process capability indices (Cp, Cpk); right-first-time batch rates; deviation frequency and severity patterns; supplier quality performance.
Using the X-Matrix to Address Validation Challenges
Validation presents unique challenges in modern pharmaceutical operations, particularly as data systems become more complex and interconnected. Handling complex data types and relationships can be time-consuming and difficult, while managing validation rules across large datasets becomes increasingly costly and challenging. The X-Matrix offers a structured approach to addressing these validation challenges:
3-5 Year Breakthrough: Establish a risk-based, continuous validation paradigm that accommodates rapidly evolving systems while maintaining compliance.
Annual Objectives: Implement risk-based validation approach for all GxP systems; establish automated testing capabilities for critical applications; develop validation strategy for AI/ML applications.
Improvement Priorities: Train validation team on risk-based approaches; implement validation tool for automated test execution; develop validation templates for different system types; establish validation center of excellence.
Metrics: Validation cycle time reduction; percentage of validation activities conducted via automated testing; validation resource efficiency; validation effectiveness (post-implementation defects).
This X-Matrix approach to validation challenges ensures that validation activities are not merely compliance exercises but strategic initiatives that support broader quality objectives. By connecting validation priorities to annual objectives and long-term breakthroughs, organizations can justify the necessary investments and resources while maintaining a clear focus on business value.
Connecting X-Matrix Planning to Quality Maturity Models
The FDA’s Quality Management Maturity (QMM) model provides a framework for assessing an organization’s progression from reactive quality management to optimized, continuous improvement. This model aligns perfectly with the X-Matrix planning approach, as both emphasize systematic progression toward excellence.
The X-Matrix can be structured to support advancement through quality maturity levels by targeting specific capabilities associated with each level:
Maturity Level
X-Matrix Breakthrough Objective
Annual Objectives
Improvement Priorities
Reactive (Level 1)
Move from reactive to controlled quality operations
Continuous process verification; innovation workshops; supplier development program
Innovative (Level 5)
Maintain and leverage innovative quality capabilities
Establish industry leading practices; develop quality thought leadership; implement next-generation quality approaches
Quality research initiatives; external benchmarking; technology innovation pilots
This alignment between the X-Matrix and quality maturity models offers several advantages. First, it provides a clear roadmap for progression through maturity levels. Second, it helps organizations prioritize initiatives based on their current maturity level and desired trajectory. Finally, it creates a framework for measuring and communicating progress toward maturity goals.
Implementation Best Practices for Quality X-Matrix Planning
Implementing an X-Matrix approach to quality planning requires careful consideration of several key factors.
1. Start With Clear Strategic Quality Imperatives
The foundation of any effective X-Matrix is a clear set of strategic quality imperatives that align with broader organizational goals. These imperatives should be derived from:
Regulatory expectations and trends
Customer quality requirements
Competitive quality positioning
Organizational quality vision
These imperatives form the basis for the 3-5 year breakthrough objectives in the X-Matrix. Without this clarity, the remaining elements of the matrix will lack focus and alignment.
2. Leverage Cross-Functional Input
Quality does not exist in isolation; it intersects with every aspect of the organization. Effective X-Matrix planning requires input from operations, regulatory affairs, supply chain, R&D, and other functions. This cross-functional perspective ensures that quality objectives are realistic, supported by appropriate capabilities, and aligned with broader organizational priorities.
The catchball process from Hoshin Kanri provides an excellent framework for this cross-functional dialogue, allowing for iterative refinement of objectives, priorities, and metrics based on input from various stakeholders.
3. Focus on Critical Few Priorities
The power of the X-Matrix lies in its ability to focus organizational attention on the most critical priorities. Resist the temptation to include too many initiatives, objectives, or metrics. Instead, identify the vital few that will drive meaningful progress toward quality maturity and operational excellence.
This focus is particularly important in regulated environments where resource constraints are common and compliance demands can easily overwhelm improvement initiatives. A well-designed X-Matrix helps quality leaders maintain strategic focus amid the daily demands of compliance activities.
4. Establish Clear Ownership and Resource Allocation
The X-Matrix should clearly identify who is responsible for each improvement priority and what resources they will have available. This clarity is essential for execution and accountability. Without explicit ownership and resource allocation, even the most well-conceived quality initiatives may fail to deliver results.
The structure of the X-Matrix facilitates this clarity by explicitly mapping resources to initiatives and objectives. This mapping helps identify potential resource conflicts early and ensures that critical initiatives have the support they need.
Balancing Structure with Adaptability in Quality Planning
A potential criticism of highly structured planning approaches like the X-Matrix is that they may constrain adaptability and innovation. However, a well-designed X-Matrix actually enhances adaptability by providing a clear framework for evaluating and integrating new priorities. The structure of the matrix makes it apparent when new initiatives align with strategic objectives and when they represent potential distractions. This clarity helps quality leaders make informed decisions about where to focus limited resources when disruptions occur.
The key lies in building what might be called “bounded flexibility”—freedom to innovate within well-understood boundaries. By thoroughly understanding which process parameters truly impact critical quality attributes, organizations can focus stability efforts where they matter most while allowing flexibility elsewhere. The X-Matrix supports this balanced approach by clearly delineating strategic imperatives (where stability is essential) from tactical initiatives (where adaptation may be necessary).
Change management systems represent another critical mechanism for balancing stability with innovation. Well-designed change management ensures that innovations are implemented in a controlled manner that preserves operational stability. The X-Matrix can incorporate change management as a specific improvement priority, ensuring that the organization’s ability to adapt is explicitly addressed in quality planning.
The X-Matrix as the Engine of Quality Excellence
The X-Matrix represents a powerful approach to quality planning that addresses the complex challenges facing modern quality organizations. By providing a structured framework for aligning long-term quality objectives with annual goals, specific initiatives, and measurable targets, the X-Matrix helps quality leaders navigate complexity while maintaining strategic focus.
As regulatory bodies evolve toward Quality Management Maturity models, the systematic approach embodied in the X-Matrix will become increasingly valuable. Organizations that establish and maintain strong operational stability through structured planning will find themselves well-positioned for both compliance and competition in an increasingly demanding pharmaceutical landscape.
The journey toward quality excellence is not merely technical but cultural and organizational. It requires systematic approaches, appropriate metrics, and balanced objectives that recognize quality not as an end in itself but as a means to deliver value to patients, practitioners, and the business. The X-Matrix provides the framework needed to navigate this journey successfully, translating quality vision into tangible results that advance both organizational performance and patient outcomes.
By adopting the X-Matrix approach to quality planning, organizations can ensure that their quality initiatives are not isolated efforts but components of a coherent strategy that addresses current challenges while building the foundation for future excellence. In a world of increasing complexity and rising expectations, this structured yet flexible approach to quality planning may well be the difference between merely complying and truly excelling.
The persistent attribution of human error as a root cause deviations reveals far more about systemic weaknesses than individual failings. The label often masks deeper organizational, procedural, and cultural flaws. Like cracks in a foundation, recurring human errors signal where quality management systems (QMS) fail to account for the complexities of human cognition, communication, and operational realities.
The Myth of Human Error as a Root Cause
Regulatory agencies increasingly reject “human error” as an acceptable conclusion in deviation investigations. This shift recognizes that human actions occur within a web of systemic influences. A technician’s missed documentation step or a formulation error rarely stem from carelessness alone but emerge from:
Procedural complexity: Overly complicated standard operating procedures (SOPs) that exceed working memory capacity
Cognitive overload: High-stress environments where operators juggle competing priorities
The aviation industry’s “Tower of Babel” problem—where siloed teams develop isolated communication loops—parallels pharmaceutical manufacturing. The Quality Unit may prioritize regulatory compliance, while production focuses on throughput, creating disjointed interpretations of “quality.” These disconnects manifest as errors when cross-functional risks go unaddressed.
Cognitive Architecture and Error Propagation
Human cognition operates under predictable constraints. Attentional biases, memory limitations, and heuristic decision-making—while evolutionarily advantageous—create vulnerabilities in GMP environments. For example:
Attentional tunneling: An operator hyper-focused on solving a equipment jam may overlook a temperature excursion alert.
Procedural drift: Subtle deviations from written protocols accumulate over time as workers optimize for perceived efficiency.
Complacency cycles: Over-familiarity with routine tasks reduces vigilance, particularly during night shifts or prolonged operations.
These cognitive patterns aren’t failures but features of human neurobiology. Effective QMS design anticipates them through:
Error-proofing: Automated checkpoints that detect deviations before critical process stages
Cognitive load management: Procedures (including batch records) tailored to cognitive load principles with decision-support prompts
Resilience engineering: Simulations that train teams to recognize and recover from near-misses
Strategies for Reframing Human Error Analysis
Conduct Cognitive Autopsies
Move beyond 5-Whys to adopt human factors analysis frameworks:
Human Error Assessment and Reduction Technique (HEART): Quantifies the likelihood of specific error types based on task characteristics
Critical Action and Decision (CAD) timelines: Maps decision points where system defenses failed
For example, a labeling mix-up might reveal:
Task factors: Nearly identical packaging for two products (29% contribution to error likelihood)
Environmental factors: Poor lighting in labeling area (18%)
Organizational factors: Inadequate change control when adding new SKUs (53%)
Redesign for Intuitive Use
The redesign of for intuitive use requires multilayered approaches based on understand how human brains actually work. At the foundation lies procedural chunking, an evidence-based method that restructures complex standard operating procedures (SOPs) into digestible cognitive units aligned with working memory limitations. This approach segments multiphase processes like aseptic filling into discrete verification checkpoints, reducing cognitive overload while maintaining procedural integrity through sequenced validation gates. By mirroring the brain’s natural pattern recognition capabilities, chunked protocols demonstrate significantly higher compliance rates compared to traditional monolithic SOP formats.
To sustain these engineered safeguards, progressive facilities implement peer-to-peer audit protocols during critical operations and transition periods.
Leverage Error Data Analytics
The integration of data analytics into organizational processes has emerged as a critical strategy for minimizing human error, enhancing accuracy, and driving informed decision-making. By leveraging advanced computational techniques, automation, and machine learning, data analytics addresses systemic vulnerabilities.
Human Error Assessment and Reduction Technique (HEART): A Systematic Framework for Error Mitigation
Benefits of the Human Error Assessment and Reduction Technique (HEART)
1. Simplicity and Speed: HEART is designed to be straightforward and does not require complex tools, software, or large datasets. This makes it accessible to organizations without extensive human factors expertise and allows for rapid assessments. The method is easy to understand and apply, even in time-constrained or resource-limited environments.
2. Flexibility and Broad Applicability: HEART can be used across a wide range of industries—including nuclear, healthcare, aviation, rail, process industries, and engineering—due to its generic task classification and adaptability to different operational contexts. It is suitable for both routine and complex tasks.
3. Systematic Identification of Error Influences: The technique systematically identifies and quantifies Error Producing Conditions (EPCs) that increase the likelihood of human error. This structured approach helps organizations recognize the specific factors—such as time pressure, distractions, or poor procedures—that most affect reliability.
4. Quantitative Error Prediction: HEART provides a numerical estimate of human error probability for specific tasks, which can be incorporated into broader risk assessments, safety cases, or design reviews. This quantification supports evidence-based decision-making and prioritization of interventions.
5. Actionable Risk Reduction: By highlighting which EPCs most contribute to error, HEART offers direct guidance on where to focus improvement efforts—whether through engineering redesign, training, procedural changes, or automation. This can lead to reduced error rates, improved safety, fewer incidents, and increased productivity.
6. Supports Accident Investigation and Design: HEART is not only a predictive tool but also valuable in investigating incidents and guiding the design of safer systems and procedures. It helps clarify how and why errors occurred, supporting root cause analysis and preventive action planning.
7. Encourages Safety and Quality Culture and Awareness: Regular use of HEART increases awareness of human error risks and the importance of control measures among staff and management, fostering a proactive culture.
When Is HEART Best Used?
Risk Assessment for Critical Tasks: When evaluating tasks where human error could have severe consequences (e.g., operating nuclear control systems, administering medication, critical maintenance), HEART helps quantify and reduce those risks.
Design and Review of Procedures: During the design or revision of operational procedures, HEART can identify steps most vulnerable to error and suggest targeted improvements.
Incident Investigation: After an failure or near-miss, HEART helps reconstruct the event, identify contributing EPCs, and recommend changes to prevent recurrence.
Training and Competence Assessment: HEART can inform training programs by highlighting the conditions and tasks where errors are most likely, allowing for focused skill development and awareness.
Resource-Limited or Fast-Paced Environments: Its simplicity and speed make HEART ideal for organizations needing quick, reliable human error assessments without extensive resources or data.
Generic Task Types (GTTs): Establishing Baselines
HEART classifies human activities into nine Generic Task Types (GTT) with predefined nominal human error probabilities (NHEPs) derived from decades of industrial incident data:
GTT Code
Task Description
Nominal HEP Range
A
Complex, novel tasks requiring problem-solving
0.55 (0.35–0.97)
B
Shifting attention between multiple systems
0.26 (0.14–0.42)
C
High-skill tasks under time constraints
0.16 (0.12–0.28)
D
Rule-based diagnostics under stress
0.09 (0.06–0.13)
E
Routine procedural tasks
0.02 (0.007–0.045)
F
Restoring system states
0.003 (0.0008–0.007)
G
Highly practiced routine operations
0.0004 (0.00008–0.009)
H
Supervised automated actions
0.00002 (0.000006–0.0009)
M
Miscellaneous/undefined tasks
0.003 (0.008–0.11)
Comprehensive Taxonomy of Error-Producing Conditions (EPCs)
HEART’s 38 Error Producing Conditionss represent contextual amplifiers of error probability, categorized under the 4M Framework (Man, Machine, Media, Management):
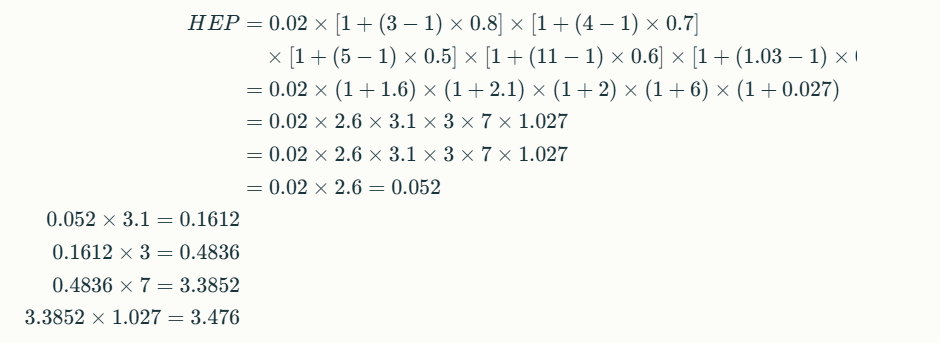
The HEART equation incorporates both multiplicative and additive effects of EPCs:
Where:
NHEP: Nominal Human Error Probability from GTT
EPC_i: Maximum effect of i-th EPC
APOE_i: Assessed Proportion of Effect (0–1)
HEART Case Study: Operator Error During Biologics Drug Substance Manufacturing
A biotech facility was producing a monoclonal antibody (mAb) drug substance using mammalian cell culture in large-scale bioreactors. The process involved upstream cell culture (expansion and production), followed by downstream purification (protein A chromatography, filtration), and final bulk drug substance filling. The manufacturing process required strict adherence to parameters such as temperature, pH, and feed rates to ensure product quality, safety, and potency.
During a late-night shift, an operator was responsible for initiating a nutrient feed into a 2,000L production bioreactor. The standard operating procedure (SOP) required the feed to be started at 48 hours post-inoculation, with a precise flow rate of 1.5 L/hr for 12 hours. The operator, under time pressure and after a recent shift change, incorrectly programmed the feed rate as 15 L/hr rather than 1.5 L/hr.
Outcome:
The rapid addition of nutrients caused a metabolic imbalance, leading to excessive cell growth, increased waste metabolite (lactate/ammonia) accumulation, and a sharp drop in product titer and purity.
The batch failed to meet quality specifications for potency and purity, resulting in the loss of an entire production lot.
Investigation revealed no system alarms for the high feed rate, and the error was only detected during routine in-process testing several hours later.
HEART Analysis
Task Definition
Task: Programming and initiating nutrient feed in a GMP biologics manufacturing bioreactor.
Criticality: Direct impact on cell culture health, product yield, and batch quality.
Generic Task Type (GTT)
GTT Code
Description
Nominal HEP
E
Routine procedural task with checking
0.02
Error-Producing Conditions (EPCs) Using the 5M Model
5M Category
EPC (HEART)
Max Effect
APOE
Example in Incident
Man
Inexperience with new feed system (EPC15)
3×
0.8
Operator recently trained on upgraded control interface
Machine
Poor feedback (no alarm for high feed rate, EPC13)
4×
0.7
System did not alert on out-of-range input
Media
Ambiguous SOP wording (EPC11)
5×
0.5
SOP listed feed rate as “1.5L/hr” in a table, not text
Management
Time pressure to meet batch deadlines (EPC2)
11×
0.6
Shift was behind schedule due to earlier equipment delay
Milieu
Distraction during shift change (EPC36)
1.03×
0.9
Handover occurred mid-setup, leading to divided attention
Human Error Probability (HEP) Calculation
HEP ≈ 3.5 (350%) This extremely high error probability highlights a systemic vulnerability, not just an individual lapse.
Root Cause and Contributing Factors
Operator: Recently trained, unfamiliar with new interface (Man)
System: No feedback or alarm for out-of-spec feed rate (Machine)
SOP: Ambiguous presentation of critical parameter (Media)
Management: High pressure to recover lost time (Management)
Automated Range Checks: Bioreactor control software now prevents entry of feed rates outside validated ranges and requires supervisor override for exceptions.
Visual SOP Enhancements: Critical parameters are now highlighted in both text and tables, and reviewed during operator training.
Human Factors & Training
Simulation-Based Training: Operators practice feed setup in a virtual environment simulating distractions and time pressure.
Shift Handover Protocol: Critical steps cannot be performed during handover periods; tasks must be paused or completed before/after shift changes.
Management & Environmental Controls
Production Scheduling: Buffer time added to schedules to reduce time pressure during critical steps.
Alarm System Upgrade: Real-time alerts for any parameter entry outside validated ranges.
Outcomes (6-Month Review)
Metric
Pre-Intervention
Post-Intervention
Feed rate programming errors
4/year
0/year
Batch failures (due to feed)
2/year
0/year
Operator confidence (survey)
62/100
91/100
Lessons Learned
Systemic Safeguards: Reliance on operator vigilance alone is insufficient in complex biologics manufacturing; layered controls are essential.
Human Factors: Addressing EPCs across the 5M model—Man, Machine, Media, Management, Milieu—dramatically reduces error probability.
Continuous Improvement: Regular review of near-misses and operator feedback is crucial for maintaining process robustness in biologics manufacturing.
This case underscores how a HEART-based approach, tailored to biologics drug substance manufacturing, can identify and mitigate multi-factorial risks before they result in costly failures.
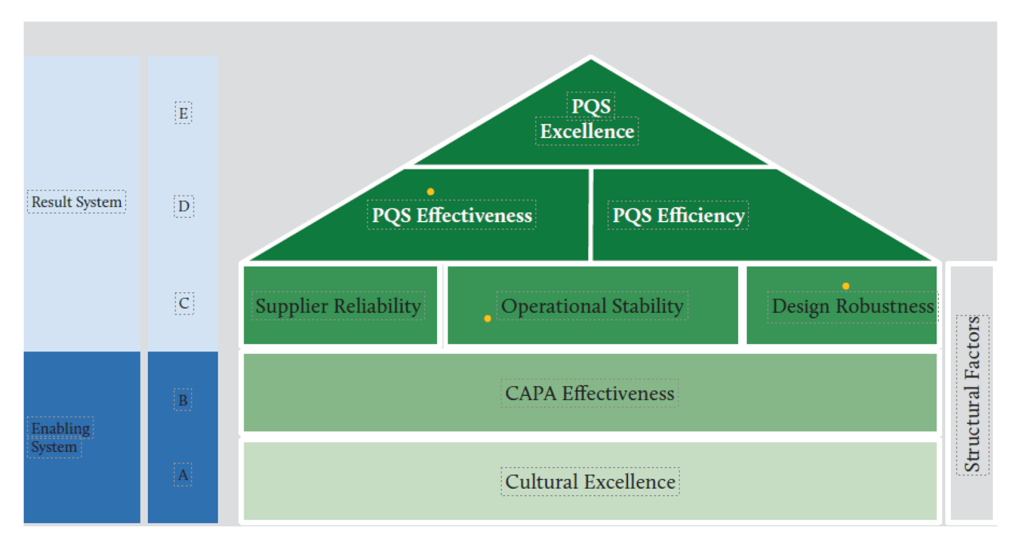
At the heart of achieving consistent pharmaceutical quality lies operational stability—a fundamental concept that forms the critical middle layer in the House of Quality model. Operational stability serves as the bridge between cultural foundations and the higher-level outcomes of effectiveness, efficiency, and excellence. This critical positioning makes it worthy of detailed examination, particularly as regulatory bodies increasingly emphasize Quality Management Maturity (QMM) as a framework for evaluating pharmaceutical operations.
Understanding Operational Stability in Pharmaceutical Manufacturing
Operational stability represents the state where manufacturing and quality processes exhibit consistent, predictable performance over time with minimal unexpected variations. It refers to the capability of production systems to maintain control within defined parameters regardless of routine challenges that may arise. In pharmaceutical manufacturing, operational stability encompasses everything from batch-to-batch consistency to equipment reliability, from procedural adherence to supply chain resilience.
The essence of operational stability lies in its emphasis on reliability and predictability. A stable operation delivers consistent outcomes not by chance but by design—through robust systems that can withstand normal operating stresses without performance degradation. Pharmaceutical operations that achieve stability demonstrate the ability to maintain critical quality attributes within specified limits while accommodating normal variability in inputs such as raw materials, human operations, and environmental conditions.
According to the House of Quality model for pharmaceutical quality frameworks, operational stability occupies a central position between cultural foundations and higher-level performance outcomes. This positioning is not accidental—it recognizes that stability is both dependent on cultural excellence below it and necessary for the efficiency and effectiveness that lead to excellence above it.
The Path to Obtaining Operational Stability
Achieving operational stability requires a systematic approach that addresses several interconnected dimensions. This pursuit begins with establishing robust processes designed with sufficient control mechanisms and clear operating parameters. Process design should incorporate quality by design principles, ensuring that processes are inherently capable of consistent performance rather than relying on inspection to catch deviations.
Standard operating procedures form the backbone of operational stability. These procedures must be not merely documented but actively maintained, followed, and continuously improved. This principle applies broadly—authoritative documentation precedes execution, ensuring alignment and clarity.
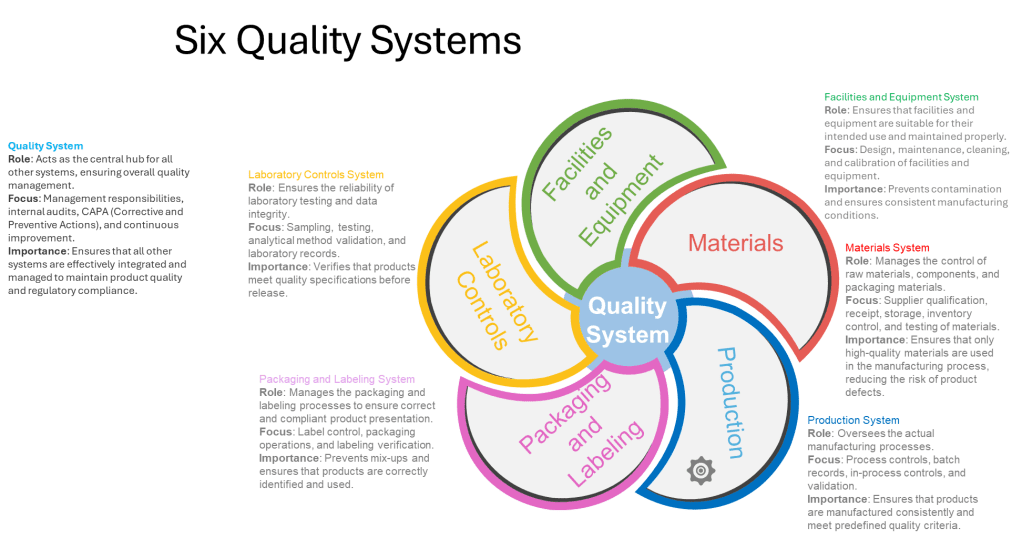
Equipment reliability programs represent another critical component in achieving operational stability. Preventive maintenance schedules, calibration programs, and equipment qualification processes all contribute to ensuring that physical assets support rather than undermine stability goals. The FDA’s guidance on pharmaceutical CGMP regulation emphasizes the importance of the Facilities and Equipment System, which ensures that facilities and equipment are suitable for their intended use and maintained properly.
Supplier qualification and management play an equally important role. As pharmaceutical manufacturing becomes increasingly globalized, with supply chains spanning multiple countries and organizations, the stability of supplied materials becomes essential for operational stability. “Supplier Reliability” appears in the House of Quality model at the same level as operational stability, underscoring their interconnected nature1. Robust supplier qualification programs, ongoing monitoring, and collaborative relationships with key vendors all contribute to supply chain stability that supports overall operational stability.
Human factors cannot be overlooked in the pursuit of operational stability. Training programs, knowledge management systems, and appropriate staffing levels all contribute to consistent human performance. The establishment of a “zero-defect culture” underscores the importance of human factors in achieving true operational stability.
Measuring Operational Stability: Key Metrics and Approaches
Measurement forms the foundation of any improvement effort. For operational stability, measurement approaches must capture both the state of stability and the factors that contribute to it. The pharmaceutical industry utilizes several key metrics to assess operational stability, ranging from process-specific measurements to broader organizational indicators.
Process capability indices (Cp, Cpk) provide quantitative measures of a process’s ability to meet specifications consistently. These statistical measures compare the natural variation in a process against specified tolerances. A process with high capability indices demonstrates the stability necessary for consistent output. These measures help distinguish between common cause variations (inherent to the process) and special cause variations (indicating potential instability).
Deviation rates and severity classification offer another window into operational stability. Tracking not just the volume but the nature and significance of deviations provides insight into systemic stability issues. The following table outlines how different deviation patterns might be interpreted:
Degrading stability, risk of normalization of deviance
Process review, operator training, standard work reinforcement
High frequency, high severity
Fundamental stability issues
Comprehensive process redesign, management system review
Equipment reliability metrics such as Mean Time Between Failures (MTBF) and Overall Equipment Effectiveness (OEE) provide visibility into the physical infrastructure supporting operations. These measures help identify whether equipment-related issues are undermining otherwise well-designed processes.
Batch cycle time consistency represents another valuable metric for operational stability. In stable operations, the time required to complete batch manufacturing should fall within a predictable range. Increasing variability in cycle times often serves as an early warning sign of degrading operational stability.
Right-First-Time (RFT) batch rates measure the percentage of batches that proceed through the entire manufacturing process without requiring rework, deviation management, or investigation. High and consistent RFT rates indicate strong operational stability.
Leveraging Operational Stability for Organizational Excellence
Once achieved, operational stability becomes a powerful platform for broader organizational excellence. Robust operational stability delivers substantial business benefits that extend throughout the organization.
Resource optimization represents one of the most immediate benefits. Stable operations require fewer resources dedicated to firefighting, deviation management, and rework. This allows for more strategic allocation of both human and financial resources. As noted in the St. Gallen reports “organizations with higher levels of cultural excellence, including employee engagement and continuous improvement mindsets supports both quality and efficiency improvements.”
Stable operations enable focused improvement efforts. Rather than dispersing improvement resources across multiple priority issues, organizations can target specific opportunities for enhancement. This focused approach yields more substantial gains and allows for the systematic building of capabilities over time.
Regulatory confidence grows naturally from demonstrated operational stability. Regulatory agencies increasingly look beyond mere compliance to assess the maturity of quality systems. The FDA’s Quality Management Maturity (QMM) program explicitly recognizes that mature quality systems are characterized by consistent, reliable processes that ensure quality objectives and promote continual improvement.
Market differentiation emerges as companies leverage their operational stability to deliver consistently high-quality products with reliable supply. In markets where drug shortages have become commonplace, the ability to maintain stable supply becomes a significant competitive advantage.
Innovation capacity expands when operational stability frees resources and attention previously consumed by basic operational problems. Organizations with stable operations can redirect energy toward innovation in products, processes, and business models.
Operational Stability within the House of Quality Model
The House of Quality model places operational stability in a pivotal middle position. This architectural metaphor is instructive—like the middle floors of a building, operational stability both depends on what lies beneath it and supports what rises above it. Understanding this positioning helps clarify operational stability’s role in the broader quality management system.
Cultural excellence lies at the foundation of the House of Quality. This foundation provides the mindset, values, and behaviors necessary for sustained operational stability. Without this cultural foundation, attempts to establish operational stability will likely prove short-lived. At a high level of quality management maturity, organizations operate optimally with clear signals of alignment, where quality and risk management stem from and support the organization’s objectives and values.
Above operational stability in the House of Quality model sit Effectiveness and Efficiency, which together lead to Excellence at the apex. This positioning illustrates that operational stability serves as the essential platform enabling both effectiveness (doing the right things) and efficiency (doing things right). Research from the St. Gallen reports found that “plants with more effective quality systems also tend to be more efficient in their operations,” although “effectiveness only explained about 4% of the variation in efficiency scores.”
The House of Quality model also places Supplier Reliability and Design Robustness at the same level as Operational Stability. This horizontal alignment stems from these three elements work in concert as the critical middle layer of the quality system. Collectively, they provide the stable platform necessary for higher-level performance.
Element
Relationship to Operational Stability
Joint Contribution to Upper Levels
Supplier Reliability
Provides consistent input materials essential for operational stability
Enables predictable performance and resource optimization
Operational Stability
Creates consistent process performance regardless of normal variations
Establishes the foundation for systematic improvement and performance optimization
Design Robustness
Ensures processes and products can withstand variation without quality impact
Reduces the resource burden of controlling variation, freeing capacity for improvement
The Critical Middle: Why Operational Stability Enables PQS Effectiveness and Efficiency
Operational stability functions as the essential bridge between cultural foundations and higher-level performance outcomes. This positioning highlights its critical role in translating quality culture into tangible quality performance.
Operational stability enables PQS effectiveness by creating the conditions necessary for systems to function as designed. The PQS effectiveness visible in the upper portions of the House of Quality depends on reliable execution of core processes. When operations are unstable, even well-designed quality systems fail to deliver their intended outcomes.
Operational stability enables efficiency by reducing wasteful activities associated with unstable processes. Without stability, efficiency initiatives often fail to deliver sustainable results as resources continue to be diverted to managing instability.
The relationship between operational stability and the higher levels of the House of Quality follows a hierarchical pattern. Attempts to achieve efficiency without first establishing stability typically result in fragile systems that deliver short-term gains at the expense of long-term performance. Similarly, effectiveness cannot be sustained without the foundation of stability. The model implies a necessary sequence: first cultural excellence, then operational stability (alongside supplier reliability and design robustness), followed by effectiveness and efficiency, ultimately leading to excellence.
Balancing Operational Stability with Innovation and Adaptability
While operational stability provides numerous benefits, it must be balanced with innovation and adaptability to avoid organizational rigidity. There is a potential negative consequences of an excessive focus on efficiency, including reduced resilience and flexibility which can lead to stifled innovation and creativity.
The challenge lies in establishing sufficient stability to enable consistent performance while maintaining the adaptability necessary for continuous improvement and innovation. This balance requires thoughtful design of stability mechanisms, ensuring they control critical quality attributes without unnecessarily constraining beneficial innovation.
Process characterization plays an important role in striking this balance. By thoroughly understanding which process parameters truly impact critical quality attributes, organizations can focus stability efforts where they matter most while allowing flexibility elsewhere. This selective approach to stability creates what might be called “bounded flexibility”—freedom to innovate within well-understood boundaries.
Change management systems represent another critical mechanism for balancing stability with innovation. Well-designed change management ensures that innovations are implemented in a controlled manner that preserves operational stability. ICH Q10 specifically identifies Change Management Systems as a key element of the Pharmaceutical Quality System, emphasizing its importance in maintaining this balance.
Measuring Quality Management Maturity through Operational Stability
Regulatory agencies increasingly recognize operational stability as a key indicator of Quality Management Maturity (QMM). The FDA’s QMM program evaluates organizations across multiple dimensions, with operational performance being a central consideration.
Organizations can assess their own QMM level by examining the nature and pattern of their operational stability. The following table presents a maturity progression framework related to operational stability:
High deviation rates, frequent batch rejections, unpredictable cycle times
Controlled (Level 2)
Basic stability achieved through rigid controls and extensive oversight
Low deviation rates but high oversight costs, limited process understanding
Predictive (Level 3)
Processes demonstrate inherent stability with normal variation understood
Statistical process control effective, leading indicators utilized
Proactive (Level 4)
Stability maintained through systemic approaches rather than individual efforts
Root causes addressed systematically, culture of ownership evident
Innovative (Level 5)
Stability serves as platform for continuous improvement and innovation
Stability metrics consistently excellent, resources focused on value-adding activities
This maturity progression aligns with the FDA’s emphasis on QMM as “the state attained when drug manufacturers have consistent, reliable, and robust business processes to achieve quality objectives and promote continual improvement”.
Practical Approaches to Building Operational Stability
Building operational stability requires a comprehensive approach addressing process design, organizational capabilities, and management systems. Several practical methods have proven particularly effective in pharmaceutical manufacturing environments.
Statistical Process Control (SPC) provides a systematic approach to monitoring processes and distinguishing between common cause and special cause variation. By establishing control limits based on natural process variation, SPC helps identify when processes are operating stably within expected variation versus when they experience unusual variation requiring investigation. This distinction prevents over-reaction to normal variation while ensuring appropriate response to significant deviations.
Process validation activities establish scientific evidence that a process can consistently deliver quality products. Modern validation approaches emphasize ongoing process verification rather than point-in-time demonstrations, aligning with the continuous nature of operational stability.
Root cause analysis capabilities ensure that when deviations occur, they are investigated thoroughly enough to identify and address underlying causes rather than symptoms. This prevents recurrence and systematically improves stability over time. The CAPA (Corrective Action and Preventive Action) system plays a central role in this aspect of building operational stability.
Knowledge management systems capture and make accessible the operational knowledge that supports stability. By preserving institutional knowledge and making it available when needed, these systems reduce dependence on individual expertise and create more resilient operations. This aligns with ICH Q10’s emphasis on “expanding the body of knowledge”.
Training and capability development ensure that personnel possess the necessary skills to maintain operational stability. Investment in operator capabilities pays dividends through reduced variability in human performance, often a significant factor in overall operational stability.
Operational Stability as the Engine of Quality Excellence
Operational stability occupies a pivotal position in the House of Quality model—neither the foundation nor the capstone, but the essential middle that translates cultural excellence into tangible performance outcomes. Its position reflects its dual nature: dependent on cultural foundations for sustainability while enabling the effectiveness and efficiency that lead to excellence.
The journey toward operational stability is not merely technical but cultural and organizational. It requires systematic approaches, appropriate metrics, and balanced objectives that recognize stability as a means rather than an end. Organizations that achieve robust operational stability position themselves for both regulatory confidence and market leadership.
As regulatory frameworks evolve toward Quality Management Maturity models, operational stability will increasingly serve as a differentiator between organizations. Those that establish and maintain strong operational stability will find themselves well-positioned for both compliance and competition in an increasingly demanding pharmaceutical landscape.
The House of Quality model provides a valuable framework for understanding operational stability’s role and relationships. By recognizing its position between cultural foundations and performance outcomes, organizations can develop more effective strategies for building and leveraging operational stability. The result is a more robust quality system capable of delivering not just compliance but true quality excellence that benefits patients, practitioners, and the business itself.