Time (maybe past-time) to evaluate your organization’s business continuity plan and anticipate the potential actions against immigrants, in particular the potential impact of Trump’s proposed immigration policies on the facility cleaning industry, particularly cleanrooms, which could be significant.
Labor Shortage
The cleaning industry, including cleanroom maintenance, heavily relies on immigrant labor. A mass deportation policy could lead to:
Significant workforce reduction: Many cleaning companies employ immigrant workers, both documented and undocumented. A large-scale deportation could severely reduce the available workforce.
Increased labor costs: With fewer workers available, companies may need to offer higher wages to attract and retain employees, potentially increasing operational costs.
Industry Disruption
The cleanroom industry, which requires specialized skills and training, could face particular challenges:
Loss of experienced workers: Cleanroom maintenance requires specific knowledge and expertise. Deporting experienced workers could lead to a skills gap in the industry.
Reduced productivity: As companies struggle to replace deported workers, there might be a temporary decrease in productivity and quality.
Increased costs for clients: Higher labor costs in the cleaning industry could be passed on to clients, potentially affecting industries that rely on cleanroom facilities, such as pharmaceuticals and electronics manufacturing.
Actions to Evaluate
Time to evaluate internal training programs to quickly upskill current and new workers, particularly for specialized cleanroom maintenance. Be prepared for the need to have your staff step in and clean, on the moment’s notice. This is a key action to have in the business continuity plan, and frankly should already be there.
Compliance and Legal Challenges
Beyond that, companies should be evaluating their other plans with broad stakeholders like HR and legal for when law enforcement comes calling as a result of heightened enforcement and audits of cleaning companies to ensure compliance with immigration laws. Remember these cleaners work side-by-side with your staff and quite frankly, are really hard to tell the difference. Are you prepared to side with law enforcement, or delay law enforcement? What is your risk tolerance for navigating the complex legal situations, particularly if long-term employees are suddenly subject to deportation?
While the full extent of the impact remains uncertain, Trump’s proposed immigration policies could significantly disrupt the facility cleaning industry, which will greatly impact every manufacturing site I know. The industry may need to adapt quickly to potential labor shortages, increased costs, and changing regulatory landscapes, while navigating the thorny ethical considerations.
Single-use systems (SUS) have become increasingly prevalent in biopharmaceutical manufacturing due to their flexibility, reduced contamination risk, and cost-effectiveness. The thing is, management of the life-cycle of single-use systems becomes critical and is an area organizations can truly screw up by cutting corners. To do it right requires careful collaboration between all stakeholders in the supply chain, from raw material suppliers to end users.
Design and Development
Apply Quality by Design (QbD) principles from the outset by focusing on process understanding and the design space to create controlled and consistent manufacturing processes that result in high-quality, efficacious products. This approach should be applied to SUS design.
ASTM E3051 “Standard guide for specification, design, verification, and application of SUS in pharmaceutical and biopharmaceutical manufacturing” provides an excellent framework for the design process.
Make sure to conduct thorough risk assessments, considering potential failure modes and effects throughout the SUS life-cycle.
Engage end-users early to understand their specific requirements and process constraints. A real mistake in organizations is not involving the end-users early enough. From the molecule steward to manufacturing these users are critical.
Raw Material and Component Selection
Carefully evaluate and qualify raw materials and components. Work closely with suppliers to understand material properties, extractables/leachables profiles, and manufacturing processes.
Develop comprehensive specifications for critical materials and components. ASTM E3244 is handy place to look for guidance on raw material qualification for SUS.
Manage the Supplier through Manufacturing and Assembly
Implementing robust supplier qualification and auditing programs and establish change control agreements with suppliers to be notified of any changes that could impact SUS performance or quality. It is important the supplier have a robust quality management system and that they apply Good Manufacturing Practices (GMP) through their facilities. Ensure they have in place appropriate controls to
Validate sterilization processes
Conduct routine bioburden and endotoxin testing
Design packaging to protect SUS during transportation and storage. Shipping methods need to protect against physical damage and temperature excursions
Establish appropriate storage conditions and shelf-life based on stability studies
Provide appropriate labeling and traceability
Have appropriate inventory controls. Ideally select suppliers who understand the importance of working with you for collaborative planning, forecasting and replenishment (CPFR)
Testing and Qualification
Develop a comprehensive testing strategy, including integrity testing and conduct extractables and leachables studies following industry guidelines. Evaluate the suppliers shipping and transportation studies to evaluate SUS robustness and determine if you need additional studies.
Implementation and Use
End users should have appropriate and comprehensive documentation and training to end users on proper handling, installation, and use of SUS. These procedures should include how to perform pre-use integrity testing at the point of use as well as how to perform thorough in-process and final inspections.
Consider implementing automated visual inspection systems and other appropriate monitoring.
Implement appropriate environmental monitoring programs in SUS manufacturing areas. While the dream of manufacturing outdoors is a good one, chances are we aren’t even close yet. Don’t short this layer of control.
Continuous Improvement
Ensure you have appropriate mechanisms in place to gather data on SUS performance and any issues encountered during use. Share relevant information across the supply chain to drive improvements.
Conduct periodic audits of suppliers and manufacturing facilities.
Stay updated on evolving regulatory guidance and industry best practices. There is still a lot changing in this space.
Maintaining process closure is crucial for ensuring product quality and safety in biotechnology manufacturing, especially when using single-use systems (SUS). This approach is an integral part of the contamination control strategy (CCS). To validate process closure in SUS-based biotech manufacturing, a comprehensive method is necessary, incorporating:
Risk assessment
Thorough testing
Ongoing monitoring
By employing risk analysis tools such as Hazard Analysis and Critical Control Points (HACCP) and Failure Mode and Effects Analysis (FMEA), manufacturers can identify potential weaknesses in their processes. Additionally, addressing all four layers of protection helps ensure process integrity and product safety. This risk-based approach to process closure validation is essential for maintaining the high standards required in biotechnology manufacturing, including meeting Annex 1.
Understanding Process Closure
Process closure refers to the isolation of the manufacturing process from the external environment to prevent contamination. In biotech, this is particularly crucial due to the sensitivity of biological products and the potential for microbial contamination.
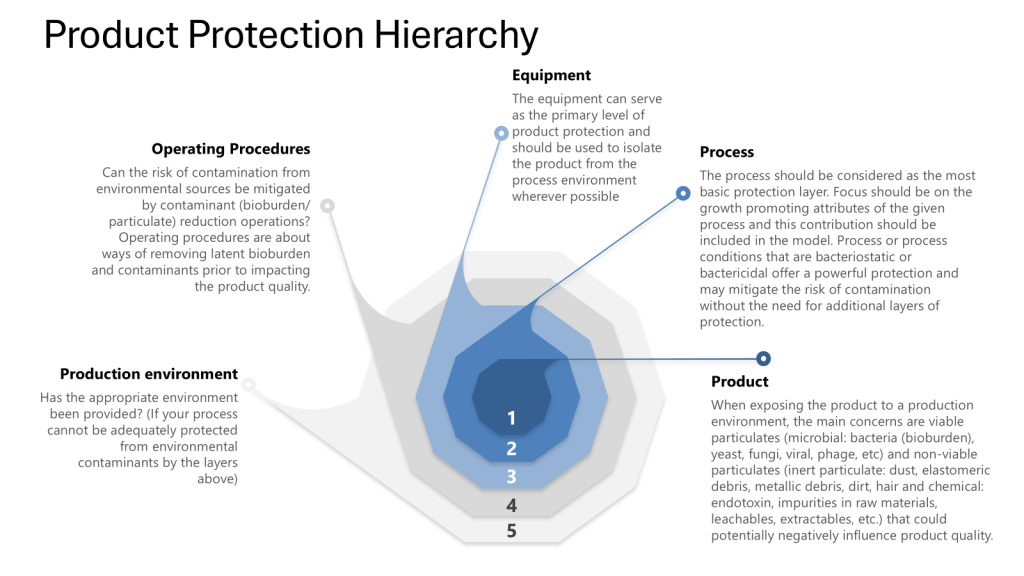
Throughout this process it is important to apply the four layers of protection that form the foundation of a robust contamination control strategy:
Process: The inherent ability of the process to prevent or control contamination
Equipment: The design and functionality of equipment to maintain closure
Operating Procedures: The practices and protocols followed by personnel
Production Environment: The controlled environment surrounding the process
I was discussing this with some colleagues this week (preparing for some risk assessments) and I was reminded that we really should put the Patient in at the center, the zero. Truer words have never been spoken as the patient truly is our zeroth law, the fundamental principle of the GxPs.
Key Steps for Validating Process Closure
Risk Assessment
Start with a comprehensive risk assessment using tools such as HACCP (Hazard Analysis and Critical Control Points) and FMEA (Failure Mode and Effects Analysis). It is important to remember this is not a one or another, but a multi-tiered approach where you first determine the hazards through the HACCP and then drill down into failures through an FMEA.
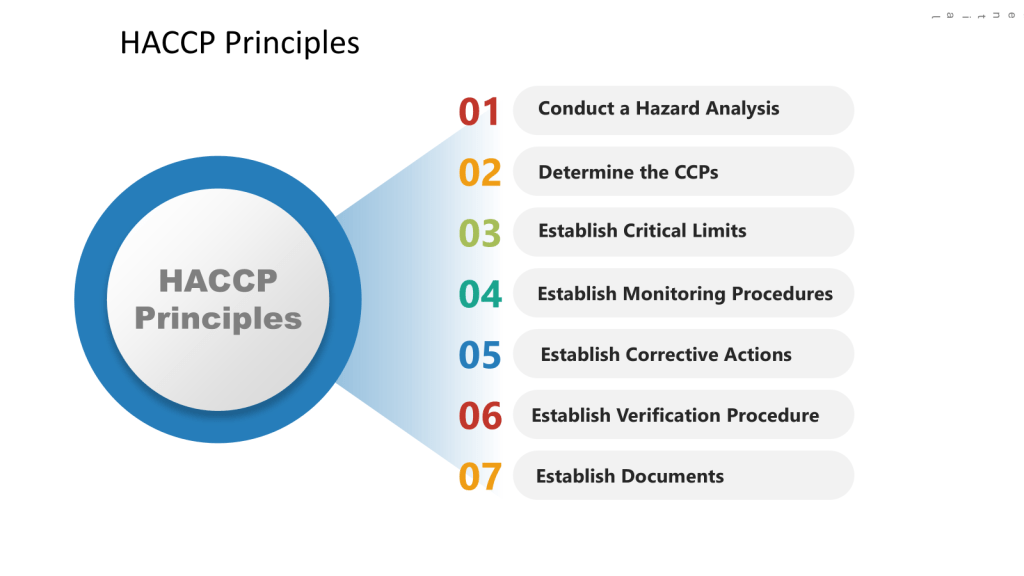
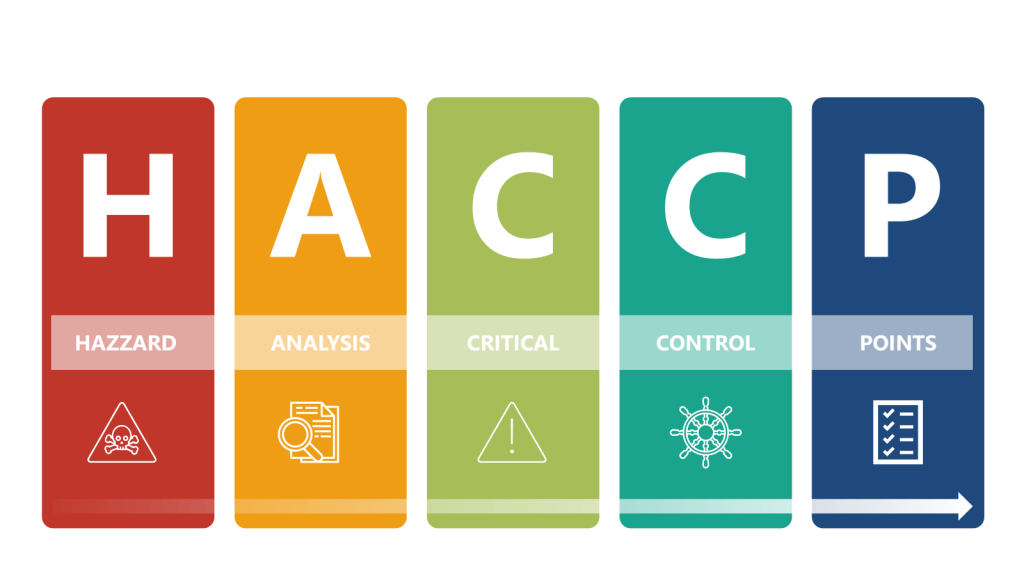
HACCP Approach
In the HACCP we will apply a systematic, preventative approach to identify hazards in the process with the aim to produce a documented plan to control these scenarios.
a) Conduct a hazard analysis b) Identify Critical Control Points (CCPs) c) Establish critical limits d) Implement monitoring procedures e) Define corrective actions f) Establish verification procedures g) Maintain documentation and records
FMEA Considerations
In the FMEA we will look for ways the process fails, focusing on the SUS components. We will evaluate failures at each level of control (process, equipment, operating procedure and environment).
Identify potential failure modes in the SUS components
Assess the severity, occurrence, and detectability of each failure mode
Calculate Risk Priority Numbers (RPN) to prioritize risks
Verification
Utilizing these risk assessments, define the user requirements specification (URS) for the SUS, focusing on critical aspects that could impact product quality and patient safety. This should include:
Process requirements (e.g. working volumes, flow rates, pressure ranges)
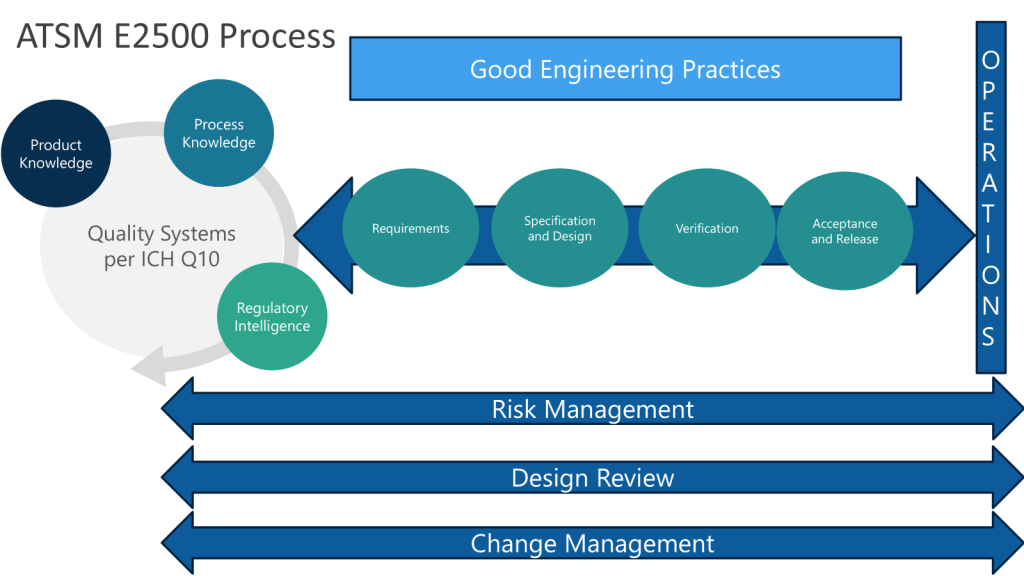
Following the ASTM E2500 approach, when we conduct the design review of the proposed SUS configuration, to evaluate how well it meets the URS, we want to ensure we cover:
Overall system design and component selection
Materials of construction
Sterilization/sanitization approach
Integrity assurance measures
Sampling and monitoring capabilities
Automation and control strategy
Circle back to the HACCP and FMEA to ensure they appropriately cover critical aspects like:
Loss of sterility/integrity
Leachables/extractables introduction
Bioburden control failures
Cross-contamination risks
Process parameter deviations
These risk assessments will define critical control parameters and acceptance criteria based on the risk assessment. These will form the basis for verification testing. We will through our verification plan have an appropriate approach to:
Verify proper installation of SUS components
Check integrity of connections and seals
Confirm correct placement of sensors and monitoring devices
Document as-built system configuration
Test system integrity under various operating conditions
Perform leak tests on connections and seals
Validate sterilization processes for SUS components
Verify functionality of critical sensors and control
Run simulated production cycles
Monitor for contamination using sensitive detection methods
Verify maintenance of sterility throughout the process
Assess product quality attributes
The verification strategy will leverage a variety of supplier documentation and internal testing.
Closure Analysis Risk Assessment (CLARA)
Acceptance and release will be to perform a detailed CLARA to:
Identify all potential points of contamination ingress
Assess the effectiveness of closure mechanisms
Evaluate the robustness of aseptic connections
Determine the impact of manual interventions on system closure
On Going Use
Coming out of our HACCP we will have a monitoring and verification plan, this will include some important aspects based on our CCPs.
Integrity Testing
Implement routine integrity testing protocols for SUS components
Utilize methods such as pressure decay tests or helium leak detection
Establish acceptance criteria for integrity tests
Environmental Monitoring
Develop a comprehensive environmental monitoring program
Include viable and non-viable particle monitoring
Establish alert and action limits for environmental contaminants
Establish a robust change control process for any modifications to the SUS or process
Regularly review and update risk assessments based on new data or changes
Implement a continuous improvement program to enhance process closure
Leveraging the Four Layers of Protection
Throughout the validation process, ensure that each layer of protection is addressed:
Process:
Optimize process parameters to minimize contamination risks
Implement in-process controls to detect deviations
Equipment:
Validate the design and functionality of SUS components
Ensure proper integration of SUS with existing equipment
Operating Procedures:
Develop and validate aseptic techniques for SUS handling
Implement procedures for system assembly and disassembly
Production Environment:
Qualify the cleanroom environment
Validate HVAC systems and air filtration
Remember that validation is an ongoing process. Regular reviews, updates to risk assessments, and incorporation of new technologies and best practices are essential for maintaining a state of control in biotech manufacturing using single-use systems.
Connected to the Contamination Control Strategy
Closed systems are a key element of the overall contamination control strategy with closed processing and closed systems now accepted as the most effective contamination control risk mitigation strategy. I might not be able to manufacture in the woods yet, but darn if I won’t keep trying.
They serve as a primary barrier to prevent contamination from the manufacturing environment by helping to mitigate the risk of contamination by isolating the product from the surrounding environment. Closed systems are the key protective measure to prevent contamination from the manufacturing environment and cross-contamination from neighboring operations.
The risk assessments leveraged during the implementation of closed systems are a crucial part of developing an effective CCS and will communicate the (ideally) robust methods used to protect products from environmental contamination and cross-contamination. This is tied into the facility design, environmental controls, risk assessments, and overall manufacturing strategies, which are the key components of a comprehensive CCS.
The key is to use a systematic, science-based approach to identify potential hazards at each layer and implement appropriate preventive controls. The controls should be validated, monitored, verified and documented as part of the overall contamination control strategy (system). Regular review and updates are needed to ensure the controls remain effective.
ASTM E2500 recognizes that Good Engineering Practices (GEP) are essential for pharmaceutical companies to ensure the consistent and reliable design, delivery, and operation of engineered systems in a manner suitable for their intended purpose.
Key Elements of Good Engineering Practices
Risk Management: Applying systematic processes to identify, assess, and control risks throughout the lifecycle of engineered systems. This includes quality risk management focused on product quality and patient safety.
Cost Management: Estimating, budgeting, monitoring and controlling costs for engineering projects and operations. This helps ensure projects deliver value and stay within budget constraints.
Organization and Control: Establishing clear organizational structures, roles and responsibilities for engineering activities. Implementing monitoring and control mechanisms to track performance.
Innovation and Continual Improvement: Fostering a culture of innovation and continuous improvement in engineering processes and systems.
Lifecycle Management: Applying consistent processes for change management, issue management, and document control throughout a system’s lifecycle from design to decommissioning.
Project Management: Following structured approaches for planning, executing and controlling engineering projects.
Design Practices: Applying systematic processes for requirements definition, design development, review and qualification.
Operational Support: Implementing asset management, calibration, maintenance and other practices to support systems during routine operations.
Key Steps for Implementation
Develop and document GEP policies, procedures and standards tailored to the company’s needs
Establish an Engineering Quality Process (EQP) to link GEP to the overall Pharmaceutical Quality System
Provide training on GEP principles and procedures to engineering staff
Implement risk-based approaches to focus efforts on critical systems and processes
Use structured project management methodologies for capital projects
Apply change control and issue management processes consistently
Maintain engineering documentation systems with appropriate controls
Conduct periodic audits and reviews of GEP implementation
Foster a culture of quality and continuous improvement in engineering
Ensure appropriate interfaces between engineering and quality/regulatory functions
The key is to develop a systematic, risk-based approach to GEP that is appropriate for the company’s size, products and operations. When properly implemented, GEP provides a foundation for regulatory compliance, operational efficiency and product quality in pharmaceutical manufacturing.
Invest in a Living, Breathing Engineering Quality Process (EQP)
The EQP establishes the formal connection between GEP and the Pharmaceutical Quality System it resides within, serving as the boundary between Quality oversight and engineering activities, particularly for implementing Quality Risk Management (QRM) based integrated Commissioning and Qualification (C&Q).
It should also provide an interface between engineering activities and other systems like business operations, health/safety/environment, or other site quality systems.
Based on the information provided in the document, here is a suggested table of contents for an Engineering Quality Process (EQP):
Table of Contents – Engineering Quality Process (EQP)
Application and Context 2.1 Relationship to Pharmaceutical Quality System (PQS) 2.2 Relationship to Good Engineering Practice (GEP) 2.3 Interface with Quality Risk Management (QRM)
EQP Elements 3.1 Policies and Procedures for the Asset Lifecycle and GEPs 3.2 Risk Assessment 3.3 Change Management 3.4 Document Control 3.5 Training 3.6 Auditing
Deliverables 4.1 GEP Documentation 4.2 Risk Assessments 4.3 Change Records 4.4 Training Records 4.5 Audit Reports
Roles and Responsibilities 5.1 Engineering 5.2 Quality 5.3 Operations 5.4 Other Stakeholders
EQP Implementation 6.1 Establishing the EQP 6.2 Maintaining the EQP 6.3 Continuous Improvement