Barriers, or controls, are one of the fundamental elements of root cause analysis. By understanding barriers—including their types and functions—we can understand both why a problem happened and how it can be prevented in the future. An evaluation of current process controls as part of root cause analysis can help determine whether all the current barriers pertaining to the problem you are investigating were present and effective.
Understanding Barrier Analysis
At its simplest, barrier analysis is a three-part brainstorm that examines the status and effectiveness of safety measures:
Barrier Analysis
Barriers that failed
Barriers that were not used
Barriers that did not exist
The key to this brainstorming session is to try to find all of the failed, unused, or nonexistent barriers. Do not be concerned if you are not certain which category they belong in initially.
Types of Barriers: Technical, Human, and Organizational
Most forms of barrier analysis examine two primary types: technical and administrative. Administrative barriers can be further broken down into “human” and “organizational” categories.
Choose
Technical
Human
Organizational
If
A technical or engineering control exists
The control relies on a human reviewer or operator
The control involves a transfer of responsibility. For example, a document reviewed by both manufacturing and quality.
Examples
Separation among manufacturing or packaging lines Emergency power supply Dedicated equipment Barcoding Keypad controlled doors Separated storage for components Software that prevents a workflow from going further if a field is not completed Redundant designs
Training and certifications Use of checklist Verification of critical task by a second person
Clear procedures and policies Adequate supervision Adequate load of work Periodic process audits
Preventive vs. Mitigative Barriers: A Critical Distinction
A fundamental aspect of barrier analysis involves understanding the difference between preventive and mitigative barriers. This distinction is crucial for comprehensive risk management and aligns with widely used frameworks such as bow-tie analysis.
Preventive Barriers
Preventive barriers are measures designed to prevent the top event from occurring. These barriers:
Focus on stopping incidents before they happen
Act as the first line of defense against threats
Aim to reduce the likelihood that a risk will materialize
Are proactive in nature, addressing potential causes before they can lead to unwanted events
Examples of preventive barriers include:
Regular equipment maintenance programs
Training and certification programs
Access controls and authentication systems
Equipment qualification protocols (IQ/OQ/PQ) validating proper installation and operation
Mitigative Barriers
Mitigative barriers are designed to reduce the impact and severity of consequences after the top event has occurred. These barriers:
Focus on damage control rather than prevention
Act to minimize harm when preventive measures have failed
Reduce the severity or substantially decrease the likelihood of consequences occurring
Are reactive in nature, coming into play after a risk has materialized
Examples of mitigative barriers include:
Alarm systems and response procedures
Containment measures for hazards
Emergency response teams and protocols
Backup power systems for critical operations
Timeline and Implementation Differences
The timing of barrier implementation and failure differs significantly between preventive and mitigative barriers:
Preventive barriers often fail over days, weeks, or years before the top event occurs, providing more opportunities for identification and intervention
Mitigative barriers often fail over minutes or hours after the top event occurs, requiring higher reliability and immediate effectiveness
This timing difference leads to higher reliance on mitigative barriers working correctly the first time
Enhanced Barrier Analysis Framework
Building on the traditional three-part analysis, organizations should incorporate the preventive vs. mitigative distinction into their barrier evaluation:
Enhanced Barrier Analysis
Preventive barriers that failed
Preventive barriers that were not used
Preventive barriers that did not exist
Mitigative barriers that failed
Mitigative barriers that were not used
Mitigative barriers that did not exist
Integration with Risk Assessment
These barriers are the same as current controls in risk assessment, which is key in a wide variety of risk assessment tools. The optimal approach involves balancing both preventive and mitigative barriers without placing reliance on just one type. Some companies may favor prevention by placing high confidence in their systems and practices, while others may emphasize mitigation through reactive policies, but neither approach alone is advisable as they each result in over-reliance on one type of barrier.
Practical Application
When conducting barrier analysis as part of root cause investigation:
Identify all relevant barriers that were supposed to protect against the incident
Classify each barrier as preventive or mitigative based on its intended function
Determine the barrier type: technical, human, or organizational
Assess barrier status: failed, not used, or did not exist
Evaluate the balance between preventive and mitigative measures
Develop corrective actions that address gaps in both preventive and mitigative barriers
This comprehensive approach to barrier analysis provides a more nuanced understanding of how incidents occur and how they can be prevented or their consequences minimized in the future. By understanding both the preventive and mitigative functions of barriers, organizations can develop more robust risk management strategies that address threats at multiple points in the incident timeline.
Energy Safety Canada recently published a white paper on causal reasoning that offers valuable insights for quality professionals across industries. As someone who has spent decades examining how we investigate deviations and perform root cause analysis, I found their framework refreshing and remarkably aligned with the challenges we face in pharmaceutical quality. The paper proposes a fundamental shift in how we approach investigations, moving from what they call “negative reasoning” to “causal reasoning” that could significantly improve our ability to prevent recurring issues and drive meaningful improvement.
The Problem with Traditional Root Cause Analysis
Many of us in quality have experienced the frustration of seeing the same types of deviations recur despite thorough investigations and seemingly robust CAPAs. The Energy Safety Canada white paper offers a compelling explanation for this phenomenon: our investigations often focus on what did not happen rather than what actually occurred.
This approach, which the authors term “negative reasoning,” leads investigators to identify counterfactuals-things that did not occur, such as “operators not following procedures” or “personnel not stopping work when they should have”. The problem is fundamental: what was not happening cannot create the outcomes we experienced. As the authors aptly state, these counterfactuals “exist only in retrospection and never actually influenced events,” yet they dominate many of our investigation conclusions.
This insight resonates strongly with what I’ve observed in pharmaceutical quality. Six years ago the MHRA’s 2019 citation of 210 companies for inadequate root cause analysis and CAPA development – including 6 critical findings – takes on renewed significance in light of Sanofi’s 2025 FDA warning letter. While most cited organizations likely believed their investigation processes were robust (as Sanofi presumably did before their contamination failures surfaced), these parallel cases across regulatory bodies and years expose a persistent industry-wide disconnect between perceived and actual investigation effectiveness. These continued failures exemplify how superficial root cause analysis creates dangerous illusions of control – precisely the systemic flaw the MHRA data highlighted six years prior.
Negative Reasoning vs. Causal Reasoning: A Critical Distinction
The white paper makes a distinction that I find particularly valuable: negative reasoning seeks to explain outcomes based on what was missing from the system, while causal reasoning looks for what was actually present or what happened. This difference may seem subtle, but it fundamentally changes the nature and outcomes of our investigations.
When we use negative reasoning, we create what the white paper calls “an illusion of cause without being causal”. We identify things like “failure to follow procedures” or “inadequate risk assessment,” which may feel satisfying but don’t explain why those conditions existed in the first place. These conclusions often lead to generic corrective actions that fail to address underlying issues.
In contrast, causal reasoning requires statements that have time, place, and magnitude. It focuses on what was necessary and sufficient to create the effect, building a logically tight cause-and-effect diagram. This approach helps reveal how work is actually done rather than comparing reality to an imagined ideal.
This distinction parallels the gap between “work-as-imagined” (the black line) and “work-as-done” (the blue line). Too often, our investigations focus only on deviations from work-as-imagined without trying to understand why work-as-done developed differently.
A Tale of Two Analyses: The Power of Causal Reasoning
The white paper presents a compelling case study involving a propane release and operator injury that illustrates the difference between these two approaches. When initially analyzed through negative reasoning, investigators concluded the operator:
Used an improper tool
Deviated from good practice
Failed to recognize hazards
Failed to learn from past experiences
These conclusions placed blame squarely on the individual and led leadership to consider terminating the operator.
However, when the same incident was examined through causal reasoning, a different picture emerged:
The operator used the pipe wrench because it was available at the pump specifically for this purpose
The pipe wrench had been deliberately left at that location because operators knew the valve was hard to close
The operator acted quickly because he perceived a risk to the plant and colleagues
Leadership had actually endorsed this workaround four years earlier during a turnaround
This causally reasoned analysis revealed that what appeared to be an individual failure was actually a system-level issue that had been normalized over time. Rather than punishing the operator, leadership recognized their own role in creating the conditions for the incident and implemented systemic improvements.
This example reminded me of our discussions on barrier analysis, where we examine barriers that failed, weren’t used, or didn’t exist. But causal reasoning takes this further by exploring why those conditions existed in the first place, creating a much richer understanding of how work actually happens.
First 24 Hours: Where Causal Reasoning Meets The Golden Day
In my recent post on “The Golden Start to a Deviation Investigation,” I emphasized how critical the first 24 hours are after discovering a deviation. This initial window represents our best opportunity to capture accurate information and set the stage for a successful investigation. The Energy Safety Canada white paper complements this concept perfectly by providing guidance on how to use those critical hours effectively.
When we apply causal reasoning during these early stages, we focus on collecting specific, factual information about what actually occurred rather than immediately jumping to what should have happened. This means documenting events with specificity (time, place, magnitude) and avoiding premature judgments about deviations from procedures or expectations.
As I’ve previously noted, clear and precise problem definition forms the foundation of any effective investigation. Causal reasoning enhances this process by ensuring we document using specific, factual language that describes what occurred rather than what didn’t happen. This creates a much stronger foundation for the entire investigation.
Beyond Human Error: System Thinking and Leadership’s Role
One of the most persistent challenges in our field is the tendency to attribute events to “human error.” As I’ve discussed before, when human error is suspected or identified as the cause, this should be justified only after ensuring that process, procedural, or system-based errors have not been overlooked. The white paper reinforces this point, noting that human actions and decisions are influenced by the system in which people work.
In fact, the paper presents a hierarchy of causes that resonates strongly with systems thinking principles I’ve advocated for previously. Outcomes arise from physical mechanisms influenced by human actions and decisions, which are in turn governed by systemic factors. If we only address physical mechanisms or human behaviors without changing the system, performance will eventually migrate back to where it has always been.
This connects directly to what I’ve written about quality culture being fundamental to providing quality. The white paper emphasizes that leadership involvement is directly correlated with performance improvement. When leaders engage to set conditions and provide resources, they create an environment where investigations can reveal systemic issues rather than just identify procedural deviations or human errors.
Implementing Causal Reasoning in Pharmaceutical Quality
For pharmaceutical quality professionals looking to implement causal reasoning in their investigation processes, I recommend starting with these practical steps:
1. Develop Investigator Competencies
As I’ve discussed in my analysis of Sanofi’s FDA warning letter, having competent investigators is crucial. Organizations should:
Define required competencies for investigators
Provide comprehensive training on causal reasoning techniques
Implement mentoring programs for new investigators
Regularly assess and refresh investigator skills
2. Shift from Counterfactuals to Causal Statements
Review your recent investigations and look for counterfactual statements like “operators did not follow the procedure.” Replace these with causal statements that describe what actually happened and why it made sense to the people involved at the time.
3. Implement a Sponsor-Driven Approach
The white paper emphasizes the importance of investigation sponsors (otherwise known as Area Managers) who set clear conditions and expectations. This aligns perfectly with my belief that quality culture requires alignment between top management behavior and quality system philosophy. Sponsors should:
Clearly define the purpose and intent of investigations
Specify that a causal reasoning orientation should be used
Provide resources and access needed to find data and translate it into causes
Remain engaged throughout the investigation process
4. Use Structured Causal Analysis Tools
While the M-based frameworks I’ve discussed previously (4M, 5M, 6M) remain valuable for organizing contributing factors, they should be complemented with tools that support causal reasoning. The Cause-Consequence Analysis (CCA) I described in a recent post offers one such approach, combining elements of fault tree analysis and event tree analysis to provide a holistic view of risk scenarios.
From Understanding to Improvement
The Energy Safety Canada white paper’s emphasis on causal reasoning represents a valuable contribution to how we think about investigations across industries. For pharmaceutical quality professionals, this approach offers a way to move beyond compliance-focused investigations to truly understand how our systems operate and how to improve them.
As the authors note, “The capacity for an investigation to improve performance is dependent on the type of reasoning used by investigators”. By adopting causal reasoning, we can build investigations that reveal how work actually happens rather than simply identifying deviations from how we imagine it should happen.
This approach aligns perfectly with my long-standing belief that without a strong quality culture, people will not be ready to commit and involve themselves fully in building and supporting a robust quality management system. Causal reasoning creates the transparency and learning that form the foundation of such a culture.
I encourage quality professionals to download and read the full white paper, reflect on their current investigation practices, and consider how causal reasoning might enhance their approach to understanding and preventing deviations. The most important questions to consider are:
Do your investigation conclusions focus on what didn’t happen rather than what did?
How often do you identify “human error” without exploring the system conditions that made that error likely?
Are your leaders engaged as sponsors who set conditions for successful investigations?
What barriers exist in your organization that prevent learning from events?
As we continue to evolve our understanding of quality and safety, approaches like causal reasoning offer valuable tools for creating the transparency needed to navigate complexity and drive meaningful improvement.
The persistent attribution of human error as a root cause deviations reveals far more about systemic weaknesses than individual failings. The label often masks deeper organizational, procedural, and cultural flaws. Like cracks in a foundation, recurring human errors signal where quality management systems (QMS) fail to account for the complexities of human cognition, communication, and operational realities.
The Myth of Human Error as a Root Cause
Regulatory agencies increasingly reject “human error” as an acceptable conclusion in deviation investigations. This shift recognizes that human actions occur within a web of systemic influences. A technician’s missed documentation step or a formulation error rarely stem from carelessness alone but emerge from:
Procedural complexity: Overly complicated standard operating procedures (SOPs) that exceed working memory capacity
Cognitive overload: High-stress environments where operators juggle competing priorities
The aviation industry’s “Tower of Babel” problem—where siloed teams develop isolated communication loops—parallels pharmaceutical manufacturing. The Quality Unit may prioritize regulatory compliance, while production focuses on throughput, creating disjointed interpretations of “quality.” These disconnects manifest as errors when cross-functional risks go unaddressed.
Cognitive Architecture and Error Propagation
Human cognition operates under predictable constraints. Attentional biases, memory limitations, and heuristic decision-making—while evolutionarily advantageous—create vulnerabilities in GMP environments. For example:
Attentional tunneling: An operator hyper-focused on solving a equipment jam may overlook a temperature excursion alert.
Procedural drift: Subtle deviations from written protocols accumulate over time as workers optimize for perceived efficiency.
Complacency cycles: Over-familiarity with routine tasks reduces vigilance, particularly during night shifts or prolonged operations.
These cognitive patterns aren’t failures but features of human neurobiology. Effective QMS design anticipates them through:
Error-proofing: Automated checkpoints that detect deviations before critical process stages
Cognitive load management: Procedures (including batch records) tailored to cognitive load principles with decision-support prompts
Resilience engineering: Simulations that train teams to recognize and recover from near-misses
Strategies for Reframing Human Error Analysis
Conduct Cognitive Autopsies
Move beyond 5-Whys to adopt human factors analysis frameworks:
Human Error Assessment and Reduction Technique (HEART): Quantifies the likelihood of specific error types based on task characteristics
Critical Action and Decision (CAD) timelines: Maps decision points where system defenses failed
For example, a labeling mix-up might reveal:
Task factors: Nearly identical packaging for two products (29% contribution to error likelihood)
Environmental factors: Poor lighting in labeling area (18%)
Organizational factors: Inadequate change control when adding new SKUs (53%)
Redesign for Intuitive Use
The redesign of for intuitive use requires multilayered approaches based on understand how human brains actually work. At the foundation lies procedural chunking, an evidence-based method that restructures complex standard operating procedures (SOPs) into digestible cognitive units aligned with working memory limitations. This approach segments multiphase processes like aseptic filling into discrete verification checkpoints, reducing cognitive overload while maintaining procedural integrity through sequenced validation gates. By mirroring the brain’s natural pattern recognition capabilities, chunked protocols demonstrate significantly higher compliance rates compared to traditional monolithic SOP formats.
To sustain these engineered safeguards, progressive facilities implement peer-to-peer audit protocols during critical operations and transition periods.
Leverage Error Data Analytics
The integration of data analytics into organizational processes has emerged as a critical strategy for minimizing human error, enhancing accuracy, and driving informed decision-making. By leveraging advanced computational techniques, automation, and machine learning, data analytics addresses systemic vulnerabilities.
Human Error Assessment and Reduction Technique (HEART): A Systematic Framework for Error Mitigation
Benefits of the Human Error Assessment and Reduction Technique (HEART)
1. Simplicity and Speed: HEART is designed to be straightforward and does not require complex tools, software, or large datasets. This makes it accessible to organizations without extensive human factors expertise and allows for rapid assessments. The method is easy to understand and apply, even in time-constrained or resource-limited environments.
2. Flexibility and Broad Applicability: HEART can be used across a wide range of industries—including nuclear, healthcare, aviation, rail, process industries, and engineering—due to its generic task classification and adaptability to different operational contexts. It is suitable for both routine and complex tasks.
3. Systematic Identification of Error Influences: The technique systematically identifies and quantifies Error Producing Conditions (EPCs) that increase the likelihood of human error. This structured approach helps organizations recognize the specific factors—such as time pressure, distractions, or poor procedures—that most affect reliability.
4. Quantitative Error Prediction: HEART provides a numerical estimate of human error probability for specific tasks, which can be incorporated into broader risk assessments, safety cases, or design reviews. This quantification supports evidence-based decision-making and prioritization of interventions.
5. Actionable Risk Reduction: By highlighting which EPCs most contribute to error, HEART offers direct guidance on where to focus improvement efforts—whether through engineering redesign, training, procedural changes, or automation. This can lead to reduced error rates, improved safety, fewer incidents, and increased productivity.
6. Supports Accident Investigation and Design: HEART is not only a predictive tool but also valuable in investigating incidents and guiding the design of safer systems and procedures. It helps clarify how and why errors occurred, supporting root cause analysis and preventive action planning.
7. Encourages Safety and Quality Culture and Awareness: Regular use of HEART increases awareness of human error risks and the importance of control measures among staff and management, fostering a proactive culture.
When Is HEART Best Used?
Risk Assessment for Critical Tasks: When evaluating tasks where human error could have severe consequences (e.g., operating nuclear control systems, administering medication, critical maintenance), HEART helps quantify and reduce those risks.
Design and Review of Procedures: During the design or revision of operational procedures, HEART can identify steps most vulnerable to error and suggest targeted improvements.
Incident Investigation: After an failure or near-miss, HEART helps reconstruct the event, identify contributing EPCs, and recommend changes to prevent recurrence.
Training and Competence Assessment: HEART can inform training programs by highlighting the conditions and tasks where errors are most likely, allowing for focused skill development and awareness.
Resource-Limited or Fast-Paced Environments: Its simplicity and speed make HEART ideal for organizations needing quick, reliable human error assessments without extensive resources or data.
Generic Task Types (GTTs): Establishing Baselines
HEART classifies human activities into nine Generic Task Types (GTT) with predefined nominal human error probabilities (NHEPs) derived from decades of industrial incident data:
GTT Code
Task Description
Nominal HEP Range
A
Complex, novel tasks requiring problem-solving
0.55 (0.35–0.97)
B
Shifting attention between multiple systems
0.26 (0.14–0.42)
C
High-skill tasks under time constraints
0.16 (0.12–0.28)
D
Rule-based diagnostics under stress
0.09 (0.06–0.13)
E
Routine procedural tasks
0.02 (0.007–0.045)
F
Restoring system states
0.003 (0.0008–0.007)
G
Highly practiced routine operations
0.0004 (0.00008–0.009)
H
Supervised automated actions
0.00002 (0.000006–0.0009)
M
Miscellaneous/undefined tasks
0.003 (0.008–0.11)
Comprehensive Taxonomy of Error-Producing Conditions (EPCs)
HEART’s 38 Error Producing Conditionss represent contextual amplifiers of error probability, categorized under the 4M Framework (Man, Machine, Media, Management):
The HEART equation incorporates both multiplicative and additive effects of EPCs:
Where:
NHEP: Nominal Human Error Probability from GTT
EPC_i: Maximum effect of i-th EPC
APOE_i: Assessed Proportion of Effect (0–1)
HEART Case Study: Operator Error During Biologics Drug Substance Manufacturing
A biotech facility was producing a monoclonal antibody (mAb) drug substance using mammalian cell culture in large-scale bioreactors. The process involved upstream cell culture (expansion and production), followed by downstream purification (protein A chromatography, filtration), and final bulk drug substance filling. The manufacturing process required strict adherence to parameters such as temperature, pH, and feed rates to ensure product quality, safety, and potency.
During a late-night shift, an operator was responsible for initiating a nutrient feed into a 2,000L production bioreactor. The standard operating procedure (SOP) required the feed to be started at 48 hours post-inoculation, with a precise flow rate of 1.5 L/hr for 12 hours. The operator, under time pressure and after a recent shift change, incorrectly programmed the feed rate as 15 L/hr rather than 1.5 L/hr.
Outcome:
The rapid addition of nutrients caused a metabolic imbalance, leading to excessive cell growth, increased waste metabolite (lactate/ammonia) accumulation, and a sharp drop in product titer and purity.
The batch failed to meet quality specifications for potency and purity, resulting in the loss of an entire production lot.
Investigation revealed no system alarms for the high feed rate, and the error was only detected during routine in-process testing several hours later.
HEART Analysis
Task Definition
Task: Programming and initiating nutrient feed in a GMP biologics manufacturing bioreactor.
Criticality: Direct impact on cell culture health, product yield, and batch quality.
Generic Task Type (GTT)
GTT Code
Description
Nominal HEP
E
Routine procedural task with checking
0.02
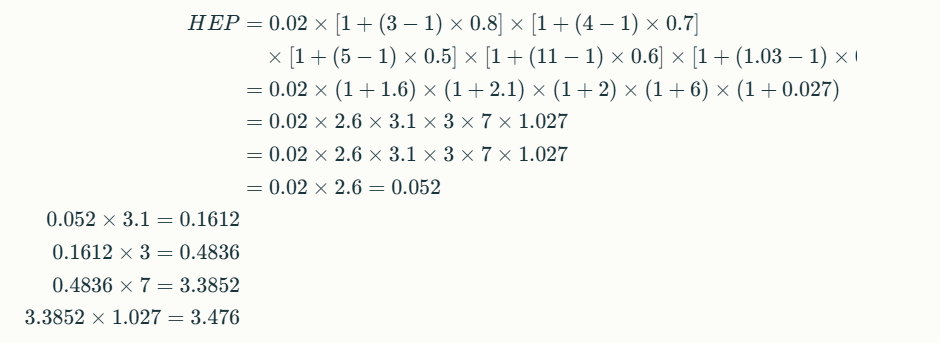
Error-Producing Conditions (EPCs) Using the 5M Model
5M Category
EPC (HEART)
Max Effect
APOE
Example in Incident
Man
Inexperience with new feed system (EPC15)
3×
0.8
Operator recently trained on upgraded control interface
Machine
Poor feedback (no alarm for high feed rate, EPC13)
4×
0.7
System did not alert on out-of-range input
Media
Ambiguous SOP wording (EPC11)
5×
0.5
SOP listed feed rate as “1.5L/hr” in a table, not text
Management
Time pressure to meet batch deadlines (EPC2)
11×
0.6
Shift was behind schedule due to earlier equipment delay
Milieu
Distraction during shift change (EPC36)
1.03×
0.9
Handover occurred mid-setup, leading to divided attention
Human Error Probability (HEP) Calculation
HEP ≈ 3.5 (350%) This extremely high error probability highlights a systemic vulnerability, not just an individual lapse.
Root Cause and Contributing Factors
Operator: Recently trained, unfamiliar with new interface (Man)
System: No feedback or alarm for out-of-spec feed rate (Machine)
SOP: Ambiguous presentation of critical parameter (Media)
Management: High pressure to recover lost time (Management)
Automated Range Checks: Bioreactor control software now prevents entry of feed rates outside validated ranges and requires supervisor override for exceptions.
Visual SOP Enhancements: Critical parameters are now highlighted in both text and tables, and reviewed during operator training.
Human Factors & Training
Simulation-Based Training: Operators practice feed setup in a virtual environment simulating distractions and time pressure.
Shift Handover Protocol: Critical steps cannot be performed during handover periods; tasks must be paused or completed before/after shift changes.
Management & Environmental Controls
Production Scheduling: Buffer time added to schedules to reduce time pressure during critical steps.
Alarm System Upgrade: Real-time alerts for any parameter entry outside validated ranges.
Outcomes (6-Month Review)
Metric
Pre-Intervention
Post-Intervention
Feed rate programming errors
4/year
0/year
Batch failures (due to feed)
2/year
0/year
Operator confidence (survey)
62/100
91/100
Lessons Learned
Systemic Safeguards: Reliance on operator vigilance alone is insufficient in complex biologics manufacturing; layered controls are essential.
Human Factors: Addressing EPCs across the 5M model—Man, Machine, Media, Management, Milieu—dramatically reduces error probability.
Continuous Improvement: Regular review of near-misses and operator feedback is crucial for maintaining process robustness in biologics manufacturing.
This case underscores how a HEART-based approach, tailored to biologics drug substance manufacturing, can identify and mitigate multi-factorial risks before they result in costly failures.
Among the most enduring tools of root cause analysis are the M-based frameworks, which categorize contributing factors to problems using mnemonic classifications. These frameworks have evolved significantly over decades, expanding from the foundational 4M Analysis to more comprehensive models like 5M, 6M, and even 8M. This progression reflects the growing complexity of industrial processes, the need for granular problem-solving, and the integration of human and systemic factors into quality control.
Origins of the 4M Framework
The 4M Analysis emerged in the mid-20th century as part of Japan’s post-war industrial resurgence. Developed by Kaoru Ishikawa, a pioneer in quality management, the framework was initially embedded within the Fishbone Diagram (Ishikawa Diagram), a visual tool for identifying causes of defects. The original four categories—Manpower, Machine, Material, and Method—provided a structured approach to dissecting production issues.
Key Components of 4M
Manpower: Human factors such as training, skill gaps, and communication.
Machine: Equipment reliability, maintenance, and technological limitations.
Material: Quality and suitability of raw materials or components.
Method: Procedural inefficiencies, outdated workflows, or unclear standards.
This framework became integral to Total Productive Maintenance (TPM) and lean manufacturing, where it was used to systematically reduce variation and defects.
However, the 4M model had limitations. It often overlooked external environmental factors and measurement systems, which became critical as industries adopted stricter quality benchmarks.
Expansion to 5M and 5M+E
To address these gaps, the 5M Model introduced Measurement as a fifth category, recognizing that inaccurate data collection or calibration errors could skew process outcomes. For instance, in pharmaceutical production, deviations in process weight might stem from faulty scales (Measurement) rather than the raw materials themselves.
Concurrently, the 5M+E variant added Environment (or Milieu) to account for external conditions such as temperature, humidity, or regulatory changes. This was particularly relevant in industries like food processing, where storage conditions directly impact product safety. The 5M+E framework thus became a staple in sectors requiring rigorous environmental controls.
The Rise of 6M and Specialized Variations
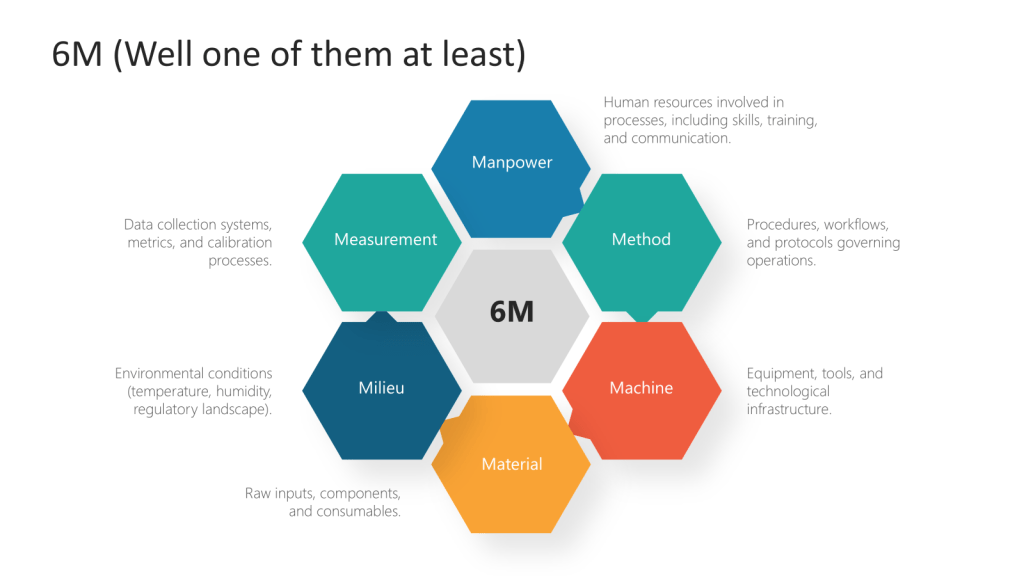
The 6M model addresses gaps in earlier iterations like the 4M framework by formalizing measurement and environmental factors as core variables. For instance, while the original 4M (Man, Machine, Material, Method) focused on internal production factors, the expanded 6M accounts for external influences like regulatory changes (Milieu) and data integrity (Measurement). This aligns with modern quality standards such as ISO 9001:2015, which emphasizes context-aware management systems.
Other versions of 6M Model further expanded the framework by incorporating Mother Nature (environmental factors) or Maintenance, depending on the industry. In agriculture, for instance, crop yield variations could be linked to drought (Mother Nature), while in manufacturing, machine downtime might trace to poor maintenance schedules.
6M model
M Factor
Description
Key Insights
Manpower
Human resources involved in processes, including skills, training, and communication
– Skill gaps or inadequate training directly impact error rates – Poor communication hierarchies exacerbate operational inefficiencies – Workforce diversity and engagement improve problem-solving agility
Method
Procedures, workflows, and protocols governing operations
– Outdated methods create bottlenecks – Overly rigid procedures stifle innovation – Standardized workflows reduce process variation by 30-50%
Machine
Equipment, tools, and technological infrastructure
– Uncalibrated machinery accounts for 23% of manufacturing defects – Predictive maintenance reduces downtime by 40% – Aging equipment increases energy costs by 15-20%
Material
Raw inputs, components, and consumables
– Supplier quality variances cause 18% of production rework – Material traceability systems reduce recall risks by 65%
– Temperature fluctuations alter material properties in 37% of pharma cases – OSHA compliance reduces workplace accidents by 52% – Climate-controlled storage extends food product shelf life by 30%
Measurement
Data collection systems, metrics, and calibration processes
– Uncalibrated sensors create 12% margin of error in aerospace measurements – Real-time data analytics improve defect detection rates by 44% – KPIs aligned with strategic goals increase operational transparency
Industry-Specific Adaptations
Healthcare: Adapted 6Ms include Medication, Metrics, and Milieu to address patient safety.
Software Development: Categories like Markets and Money are added to analyze project failures.
Finance: 5M+P (People, Process, Platform, Partners, Profit) shifts focus to operational and market risks.
These adaptations highlight the framework’s flexibility.
Beyond 6M: 8M and Hybrid Models
In complex systems, some organizations adopt 8M Models, adding Management and Mission to address leadership and strategic alignment. The original 5M framework already included these elements, but their revival underscores the importance of organizational culture in problem-solving. For example, the 4M4(5)E model used in maritime safety analyzes accidents through Man, Machine, Media, Management, Education, Engineering, Enforcement, Example, and Environment.
Integration with RCA Tools
The M frameworks should never be used in isolation. They complement tools like:
Why-Whys: Drills down into each M category to uncover root causes.
Fishbone Diagrams: Visualizes interactions between Ms31015.
FMEA (Failure Mode Effects Analysis): Prioritizes risks within each M.
Contemporary Applications and Challenges
Modern iterations of M frameworks emphasize inclusivity and adaptability. The 5M+P model replaces “Man” with “People” to reflect diverse workforces, while AI-driven factories integrate Machine Learning as a new M. However, challenges persist:
Overcomplication: Adding too many categories can dilute focus.
Subjectivity: Teams may prioritize familiar Ms over less obvious factors.
The evolution from 4M to 6M and beyond illustrates the iterative nature of quality management. Each expansion reflects deeper insights into how people, processes, and environments interact to create—or resolve—operational challenges. These frameworks will continue to adapt, offering structured yet flexible approaches to root cause analysis. Organizations that master their application will not only solve problems more effectively but also foster cultures of continuous improvement and innovation.
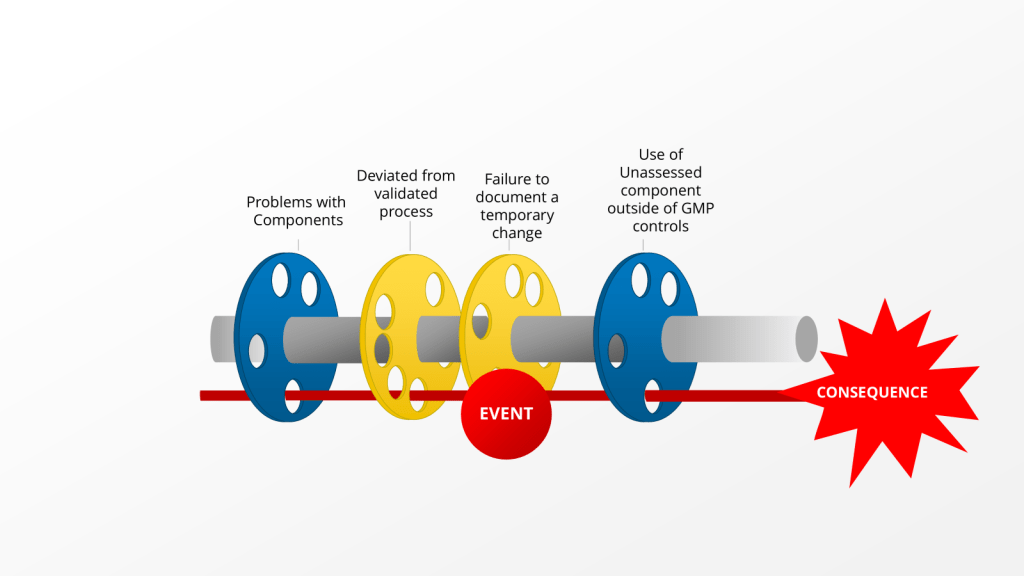
“there is no retrospective review of batch records for batches within expiry, to identify any other process deviations performed without the appropriate corresponding documentation including risk assessment(s).” – 2025 Warning Letter from the US FDA to Sanofi
This comment is about an instance where Sanofi deviated from the validated process by using an unvalidated single use component. Instead of self-identifying, creating a deviation and doing the right change control activities, the company just kept on deviating by using a non-controlled document.
This is a big problem for lots of reasons, from uncontrolled documents, to not using the change control system, to breaking the validated state. What the language quoted above really brings to bear is the question, when should we evaluate our records for other similar instances of this happening, so we can address it.
When a deviation investigation reveals recurring bad decision-making, it is crucial to expand the investigation and conduct a retrospective review of batch records. A good cutoff of this can be only for batches within expiry. This expanded investigation helps identify any other process deviations that may have occurred but were not discovered or documented at the time. Here’s when and how to approach this situation:
Triggers for Expanding the Investigation
Recurring Deviations: If the same or similar deviations are found to be recurring, it indicates a systemic issue that requires a broader investigation.
Pattern of Human Errors: When a pattern of human errors or poor decision-making is identified, it suggests potential underlying issues in training, procedures, or processes.
Critical Deviations: For deviations classified as critical, a more thorough investigation is typically warranted, including a retrospective review.
Potential Impact on Product Quality: If there’s a strong possibility that undiscovered deviations could affect product quality or patient safety, an expanded investigation becomes necessary.
Conducting the Retrospective Review
Timeframe: Review batch records for all batches within expiry, typically covering at least two years of production. Similarily for issues in the FUSE program you might look since the last requalification, or from a decide to go backwards in concentric circles based on what you find.
Scope: Examine not only the specific process where the deviation was found but also related processes or areas that could be affected. Reviewing related processes is critical.
Data Analysis: Utilize statistical tools and trending analysis techniques to identify patterns or anomalies in the historical data.
Cross-Functional Approach: Involve a team of subject matter experts from relevant departments to ensure a comprehensive review.
Documentation Review: Examine batch production records, laboratory control records, equipment logs, and any other relevant documentation.
Root Cause Analysis: Apply root cause analysis techniques to understand the underlying reasons for the recurring issues.
Key Considerations
Risk Assessment: Prioritize the review based on the potential risk to product quality and patient safety.
Data Integrity: Ensure that any retrospective data used is reliable and has maintained its integrity.
Corrective Actions: Develop and implement corrective and preventive actions (CAPAs) based on the findings of the expanded investigation.
Regulatory Reporting: Assess the need for notifying regulatory authorities based on the severity and impact of the findings.
By conducting a thorough retrospective review when recurring bad decision-making is identified, companies can uncover hidden issues, improve their quality systems, and prevent future deviations. This proactive approach not only enhances compliance but also contributes to continuous improvement in pharmaceutical manufacturing processes.
In the case of an issue that rises to a regulatory observation this becomes a firm must. The agency has raised a significant concern and they will want proof that this is a limited issue or that you are holistically dealing with it across the organization.
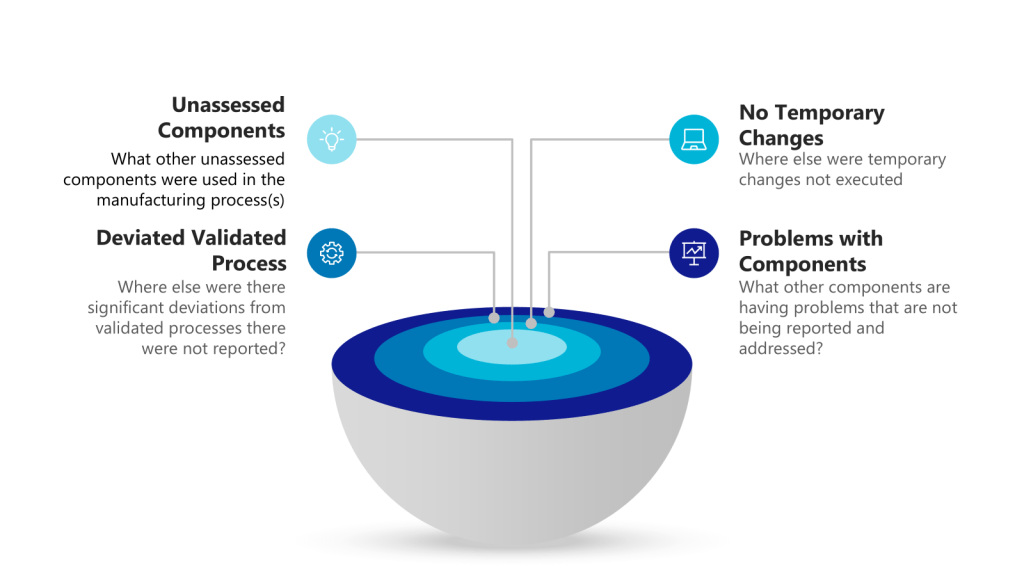
Concentric Circles of Investigation
Each layer of the investigation may require holistic looks. Utilizing the example above we have:
Layer of Problem
Further Investigationto Answer
Use of unassessed component outside of GMP controls
What other unassessed components were used in the manufacturing process(s)