The relationship between sponsors and contract organizations has evolved far beyond simple transactional exchanges. Digital infrastructure has become the cornerstone of trust, transparency, and operational excellence.
The trust equation is fundamentally changing due to the way our supply chains are being challenged.. Traditional quality agreements often functioned as static documents—comprehensive but disconnected from day-to-day operations. Today’s most successful partnerships are built on dynamic, digitally-enabled frameworks that provide real-time visibility into performance, compliance, and risk management.
Regulatory agencies are increasingly scrutinizing the effectiveness of sponsor oversight programs. The FDA’s emphasis on data integrity, combined with EMA’s evolving computerized systems requirements, means that sponsors can no longer rely on periodic audits and static documentation to demonstrate control over their outsourced activities.
Quality Agreements as Digital Trust Frameworks
The modern quality agreement must evolve from a compliance document to a digital trust framework. This transformation requires reimagining three fundamental components:
Dynamic Risk Assessment Integration
Traditional quality agreements categorize suppliers into static risk tiers (for example Category 1, 2, 2.5, or 3 based on material/service risk). Digital frameworks enable continuous risk profiling that adapts based on real-time performance data.
Integrate supplier performance metrics directly into your quality management system. When a Category 2 supplier’s on-time delivery drops below threshold or quality metrics deteriorate, the system should automatically trigger enhanced monitoring protocols without waiting for the next periodic review.
Automated Change Control Workflows
One of the most contentious areas in sponsor-CxO relationships involves change notifications and approvals. Digital infrastructure can transform this friction point into a competitive advantage.
The SMART approach to change control:
Standardized digital templates for change notifications
Machine-readable impact assessments
Automated routing based on change significance
Real-time status tracking for all stakeholders
Traceable decision logs with electronic signatures
Quality agreement language to include: “All change notifications shall be submitted through the designated digital platform within [X] business days of identification, with automated acknowledgment and preliminary impact assessment provided within [Y] hours.”
Transparent Performance Dashboards
The most innovative CxOs are moving beyond quarterly business reviews to continuous performance visibility. Quality agreements should build upon real-time access to key performance indicators (KPIs) that matter most to patient safety and product quality.
Examples of Essential KPIs for digital dashboards:
Batch disposition times and approval rates
Deviation investigation cycle times
CAPA effectiveness metrics
Environmental monitoring excursions and response times
Supplier change notification compliance rates
Communication Architecture for Transparency
Effective communication in pharmaceutical partnerships requires architectural thinking, not just protocol definition. The most successful CxO-sponsor relationships are built on what I call the “Three-Layer Communication Stack” which builds a rhythm of communication:
Layer 1: Operational Communication (Real-Time)
Purpose: Day-to-day coordination and issue resolution
Tools: Integrated messaging within quality management systems, automated alerts, mobile notifications
Quality agreement requirement: “Operational communications shall be conducted through validated, audit-trailed platforms with 24/7 availability and guaranteed delivery confirmation.”
Every quality agreement should include a subsidiary Communication Plan that addresses:
Stakeholder Matrix: Who needs what information, when, and in what format
Escalation Protocols: Clear triggers for moving issues up the communication stack
Performance Metrics: How communication effectiveness will be measured and improved
Technology Requirements: Specified platforms, security requirements, and access controls
Contingency Procedures: Alternative communication methods for system failures or emergencies
Include communication effectiveness as a measurable element in your supplier scorecards. Track metrics like response time to quality notifications, accuracy of status reporting, and proactive problem identification.
Data Governance as a Competitive Differentiator
Data integrity is more than just ensuring ALCOA+—it’s about creating a competitive moat through superior data governance. The organizations that master data sharing, analysis, and decision-making will dominate the next decade of pharmaceutical manufacturing and development.
The Modern Data Governance Framework
Data Architecture Definition
Your quality agreement must specify not just what data will be shared, but how it will be structured, validated, and integrated:
Master data management: Consistent product codes, batch numbering, and material identifiers across all systems
Data quality standards: Validation rules, completeness requirements, and accuracy thresholds
Integration protocols: APIs, data formats, and synchronization frequencies
With increasing regulatory focus on cybersecurity, your data governance plan must address:
Role-based access controls: Granular permissions based on job function and business need
Data classification: Confidentiality levels and handling requirements
Audit logging: Comprehensive tracking of data access, modification, and sharing
Analytics and Intelligence
The real competitive advantage comes from turning shared data into actionable insights:
Predictive analytics: Early warning systems for quality trends and supply chain disruptions
Benchmark reporting: Anonymous industry comparisons to identify improvement opportunities
Root cause analysis: Automated correlation of events across multiple systems and suppliers
The Data Governance Subsidiary Agreement
Consider creating a separate Data Governance Agreement that complements your quality agreement with specific sections covering data sharing objectives, technical architecture, governance oversight, and compliance requirements.
Veeva Summit
Next week I’ll be discussing this topic at the Veeva Summit, where I will bring some organizational learnings on to embrace digital infrastructure as a trust-building mechanism will forge stronger partnerships, achieve superior quality outcomes, and ultimately deliver better patient experiences.
Quality needs to be managed as a program, and as such, it must walk a delicate line between setting long-term goals, short-term goals, improvement priorities, and interacting with a suite of portfolios, programs, and KPIs. As quality professionals navigate increasingly complex regulatory landscapes, technological disruptions, and evolving customer expectations, the need for structured approaches to quality planning has never been greater.
At the heart of this activity, I use an x-matrix, a powerful tool at the intersection of strategic planning and quality management. The X-Matrix provides a comprehensive framework that clarifies the chaos, visually representing how long-term quality objectives cascade into actionable initiatives with clear ownership and metrics – connecting the dots between aspiration and execution in a single, coherent framework.
Understanding the X-Matrix: Structure and Purpose
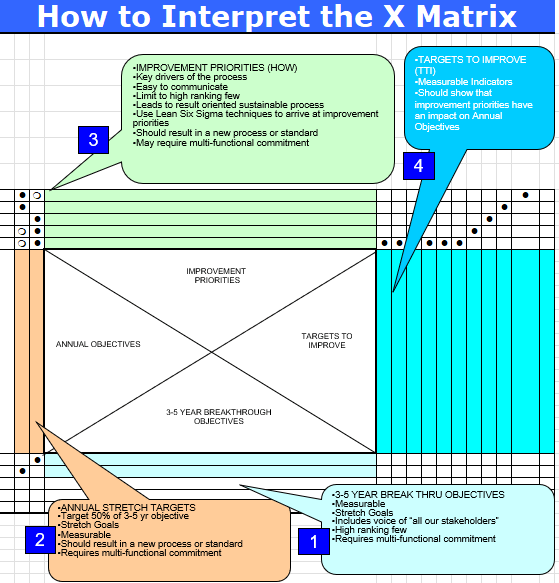
The X-Matrix is a strategic planning tool from Hoshin Kanri methodology that brings together multiple dimensions of organizational strategy onto a single page. Named for its distinctive X-shaped pattern of relationships, this tool enables us to visualize connections between long-term breakthroughs, annual objectives, improvement priorities, and measurable targets – all while clarifying ownership and resource allocation.
The X-Matrix is structured around four key quadrants that create its distinctive shape:
South Quadrant (3-5 Year Breakthrough Objectives): These are the foundational, long-term quality goals that align with organizational vision and regulatory expectations. In quality contexts, these might include achieving specific quality maturity levels, establishing new quality paradigms, or fundamentally transforming quality systems.
West Quadrant (Annual Objectives): These represent the quality priorities for the coming year that contribute directly to the longer-term breakthroughs. These objectives are specific enough to be actionable within a one-year timeframe.
North Quadrant (Improvement Priorities): These are the specific initiatives, projects, and process improvements that will be undertaken to achieve the annual objectives. Each improvement priority should have clear ownership and resource allocation.
East Quadrant (Targets/Metrics): These are the measurable indicators that will be used to track progress toward both annual objectives and breakthrough goals. In quality planning, these often include process capability indices, deviation rates, right-first-time metrics, and other key performance indicators.
The power of the X-Matrix lies in the correlation points where these quadrants intersect. These intersections show how initiatives support objectives and how objectives align with long-term goals. They create a clear line of sight from strategic quality vision to daily operations and improvement activities.
Why the X-Matrix Excels for Quality Planning
Traditional quality planning approaches often suffer from disconnection between strategic objectives and tactical activities. Quality initiatives may be undertaken in isolation, with limited understanding of how they contribute to broader organizational goals. The X-Matrix addresses this fragmentation through its integrated approach to planning.
The X-Matrix provides visibility into the interdependencies within your quality system. By mapping the relationships between long-term quality objectives, annual goals, improvement priorities, and key metrics, quality leaders can identify potential resource conflicts, capability gaps, and opportunities for synergy.
Developing an X-Matrix necessitates cross-functional input and alignment to ensure that quality objectives are not isolated but integrated with operations, regulatory, supply chain, and other critical functions. The development of an X-Matrix encourages the back-and-forth dialogue necessary to develop realistic, aligned goals.
Perhaps most importantly for quality organizations, the X-Matrix provides the structure and rigor to ensure quality planning is not left to chance. As the FDA and other regulatory bodies increasingly emphasize Quality Management Maturity (QMM) as a framework for evaluating pharmaceutical operations, the disciplined approach embodied in the X-Matrix becomes a competitive advantage. The matrix systematically considers resource constraints, capability requirements, and performance measures – all essential components of mature quality systems.
Mapping Modern Quality Challenges to the X-Matrix
The quality landscape is evolving rapidly, with several key challenges that must be addressed in any comprehensive quality planning effort. The X-Matrix provides an ideal framework for addressing these challenges systematically. Building on the post “The Challenges Ahead for Quality” we can start to build our an X-matrix.
Advanced Analytics and Digital Transformation
As data sources multiply and processing capabilities expand, quality organizations face increased expectations for data-driven insights and decision-making. An effective X-Matrix for quality planning couldinclude:
3-5 Year Breakthrough: Establish a predictive quality monitoring system that leverages advanced analytics to identify potential quality issues before they manifest.
Annual Objectives: Implement data visualization tools for key quality metrics; establish data governance framework for GxP data; develop predictive models for critical quality attributes.
Improvement Priorities: Create cross-functional data science capability; implement automated data capture for batch records; develop real-time dashboards for process parameters.
Metrics: Percentage of quality decisions made with data-driven insights; predictive model accuracy; reduction in quality investigation cycle time through analytics.
Operational Stability in Complex Supply Networks
As pharmaceutical manufacturing becomes increasingly globalized with complex supplier networks, operational stability emerges as a critical challenge. Operational stability represents the state where manufacturing and quality processes exhibit consistent, predictable performance over time with minimal unexpected variation. The X-Matrix can address this through:
3-5 Year Breakthrough: Achieve Level 4 (Proactive) operational stability across all manufacturing sites, networks and key suppliers.
Annual Objectives: Implement statistical process control for critical processes; establish supplier quality alignment program; develop operational stability metrics and monitoring system.
Improvement Priorities: Deploy SPC training and tools; conduct operational stability risk assessments; implement regular supplier quality reviews; establish cross-functional stability team.
Metrics: Process capability indices (Cp, Cpk); right-first-time batch rates; deviation frequency and severity patterns; supplier quality performance.
Using the X-Matrix to Address Validation Challenges
Validation presents unique challenges in modern pharmaceutical operations, particularly as data systems become more complex and interconnected. Handling complex data types and relationships can be time-consuming and difficult, while managing validation rules across large datasets becomes increasingly costly and challenging. The X-Matrix offers a structured approach to addressing these validation challenges:
3-5 Year Breakthrough: Establish a risk-based, continuous validation paradigm that accommodates rapidly evolving systems while maintaining compliance.
Annual Objectives: Implement risk-based validation approach for all GxP systems; establish automated testing capabilities for critical applications; develop validation strategy for AI/ML applications.
Improvement Priorities: Train validation team on risk-based approaches; implement validation tool for automated test execution; develop validation templates for different system types; establish validation center of excellence.
Metrics: Validation cycle time reduction; percentage of validation activities conducted via automated testing; validation resource efficiency; validation effectiveness (post-implementation defects).
This X-Matrix approach to validation challenges ensures that validation activities are not merely compliance exercises but strategic initiatives that support broader quality objectives. By connecting validation priorities to annual objectives and long-term breakthroughs, organizations can justify the necessary investments and resources while maintaining a clear focus on business value.
Connecting X-Matrix Planning to Quality Maturity Models
The FDA’s Quality Management Maturity (QMM) model provides a framework for assessing an organization’s progression from reactive quality management to optimized, continuous improvement. This model aligns perfectly with the X-Matrix planning approach, as both emphasize systematic progression toward excellence.
The X-Matrix can be structured to support advancement through quality maturity levels by targeting specific capabilities associated with each level:
Maturity Level
X-Matrix Breakthrough Objective
Annual Objectives
Improvement Priorities
Reactive (Level 1)
Move from reactive to controlled quality operations
Continuous process verification; innovation workshops; supplier development program
Innovative (Level 5)
Maintain and leverage innovative quality capabilities
Establish industry leading practices; develop quality thought leadership; implement next-generation quality approaches
Quality research initiatives; external benchmarking; technology innovation pilots
This alignment between the X-Matrix and quality maturity models offers several advantages. First, it provides a clear roadmap for progression through maturity levels. Second, it helps organizations prioritize initiatives based on their current maturity level and desired trajectory. Finally, it creates a framework for measuring and communicating progress toward maturity goals.
Implementation Best Practices for Quality X-Matrix Planning
Implementing an X-Matrix approach to quality planning requires careful consideration of several key factors.
1. Start With Clear Strategic Quality Imperatives
The foundation of any effective X-Matrix is a clear set of strategic quality imperatives that align with broader organizational goals. These imperatives should be derived from:
Regulatory expectations and trends
Customer quality requirements
Competitive quality positioning
Organizational quality vision
These imperatives form the basis for the 3-5 year breakthrough objectives in the X-Matrix. Without this clarity, the remaining elements of the matrix will lack focus and alignment.
2. Leverage Cross-Functional Input
Quality does not exist in isolation; it intersects with every aspect of the organization. Effective X-Matrix planning requires input from operations, regulatory affairs, supply chain, R&D, and other functions. This cross-functional perspective ensures that quality objectives are realistic, supported by appropriate capabilities, and aligned with broader organizational priorities.
The catchball process from Hoshin Kanri provides an excellent framework for this cross-functional dialogue, allowing for iterative refinement of objectives, priorities, and metrics based on input from various stakeholders.
3. Focus on Critical Few Priorities
The power of the X-Matrix lies in its ability to focus organizational attention on the most critical priorities. Resist the temptation to include too many initiatives, objectives, or metrics. Instead, identify the vital few that will drive meaningful progress toward quality maturity and operational excellence.
This focus is particularly important in regulated environments where resource constraints are common and compliance demands can easily overwhelm improvement initiatives. A well-designed X-Matrix helps quality leaders maintain strategic focus amid the daily demands of compliance activities.
4. Establish Clear Ownership and Resource Allocation
The X-Matrix should clearly identify who is responsible for each improvement priority and what resources they will have available. This clarity is essential for execution and accountability. Without explicit ownership and resource allocation, even the most well-conceived quality initiatives may fail to deliver results.
The structure of the X-Matrix facilitates this clarity by explicitly mapping resources to initiatives and objectives. This mapping helps identify potential resource conflicts early and ensures that critical initiatives have the support they need.
Balancing Structure with Adaptability in Quality Planning
A potential criticism of highly structured planning approaches like the X-Matrix is that they may constrain adaptability and innovation. However, a well-designed X-Matrix actually enhances adaptability by providing a clear framework for evaluating and integrating new priorities. The structure of the matrix makes it apparent when new initiatives align with strategic objectives and when they represent potential distractions. This clarity helps quality leaders make informed decisions about where to focus limited resources when disruptions occur.
The key lies in building what might be called “bounded flexibility”—freedom to innovate within well-understood boundaries. By thoroughly understanding which process parameters truly impact critical quality attributes, organizations can focus stability efforts where they matter most while allowing flexibility elsewhere. The X-Matrix supports this balanced approach by clearly delineating strategic imperatives (where stability is essential) from tactical initiatives (where adaptation may be necessary).
Change management systems represent another critical mechanism for balancing stability with innovation. Well-designed change management ensures that innovations are implemented in a controlled manner that preserves operational stability. The X-Matrix can incorporate change management as a specific improvement priority, ensuring that the organization’s ability to adapt is explicitly addressed in quality planning.
The X-Matrix as the Engine of Quality Excellence
The X-Matrix represents a powerful approach to quality planning that addresses the complex challenges facing modern quality organizations. By providing a structured framework for aligning long-term quality objectives with annual goals, specific initiatives, and measurable targets, the X-Matrix helps quality leaders navigate complexity while maintaining strategic focus.
As regulatory bodies evolve toward Quality Management Maturity models, the systematic approach embodied in the X-Matrix will become increasingly valuable. Organizations that establish and maintain strong operational stability through structured planning will find themselves well-positioned for both compliance and competition in an increasingly demanding pharmaceutical landscape.
The journey toward quality excellence is not merely technical but cultural and organizational. It requires systematic approaches, appropriate metrics, and balanced objectives that recognize quality not as an end in itself but as a means to deliver value to patients, practitioners, and the business. The X-Matrix provides the framework needed to navigate this journey successfully, translating quality vision into tangible results that advance both organizational performance and patient outcomes.
By adopting the X-Matrix approach to quality planning, organizations can ensure that their quality initiatives are not isolated efforts but components of a coherent strategy that addresses current challenges while building the foundation for future excellence. In a world of increasing complexity and rising expectations, this structured yet flexible approach to quality planning may well be the difference between merely complying and truly excelling.
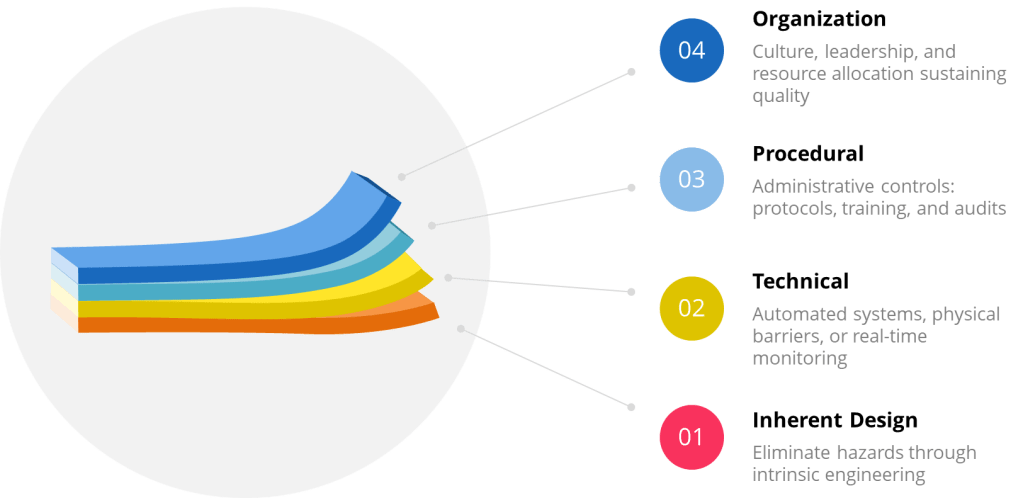
The Swiss Cheese Model, conceptualized by James Reason, fundamentally defined modern risk management by illustrating how layered defenses interact with active and latent failures to prevent or enable adverse events. This framework underpins the Four Layers of Protection, a systematic approach to mitigating risks across industries. By integrating Reason’s Theory of Active and Latent Failures with modern adaptations like resilience engineering, organizations can create robust, adaptive systems.
The Swiss Cheese Model and Reason’s Theory: A Foundation for Layered Defenses
Reason’s Theory distinguishes between active failures (immediate errors by frontline personnel) and latent failures (systemic weaknesses in design, management, or culture). The Swiss Cheese Model visualizes these failures as holes in successive layers of defense. When holes align, hazards penetrate the system. For example:
In healthcare, a mislabeled specimen (active failure) might bypass defenses if staff are overworked (latent failure) and barcode scanners malfunction (technical failure).
In aviation, a pilot’s fatigue-induced error (active) could combine with inadequate simulator training (latent) and faulty sensors (technical) to cause a near-miss.
This model emphasizes that no single layer is foolproof; redundancy and diversity across layers are critical.
2. Information Security: Aligning with ISO/IEC 27001
Inherent: Encryption embedded in software design (ISO 27001 Annex A.10).
Procedural: Regular penetration testing and access reviews (Annex A.12).
Technical: Intrusion detection systems (Annex A.13).
Organizational: Enterprise-wide risk assessments and governance (Annex A.5).
3. Biotech Manufacturing: Contamination Control
Inherent: Closed-system bioreactors with sterile welders.
Procedural: FDA-mandated Contamination Control Strategies (CCS).
Technical: Real-time viable particle monitoring with auto-alerts.
Organizational: Cross-functional teams analyzing trend data to preempt breaches.
Contamination Control and Layers of Controls Analysis (LOCA)
In contamination-critical industries, a Layers of Controls Analysis (LOCA) evaluates how failures in one layer impact others. For example:
Procedural Failure: Skipping gowning steps in a cleanroom.
Technical Compromise: HEPA filter leaks due to poor maintenance.
Organizational Gap: Inadequate staff training on updated protocols.
LOCA reveals that latent organizational failures (e.g., insufficient training budgets) often undermine technical and procedural layers. LOCA ties contamination risks to systemic resource allocation, not just frontline errors.
ISO/IEC 27001, the international standard for information security, exemplifies layered risk management:
ISO 27001 Control (Annex A)
Corresponding Layer
Example
A.8.3 (Information labeling)
Procedural
Classifying data by sensitivity
A.9.4 (Network security)
Technical
Firewalls and VPNs
A.11.1 (Physical security)
Inherent/Technical
Biometric access to server rooms
A.5.1 (Policies for IS)
Organizational
Board-level oversight of cyber risks
This alignment ensures that technical safeguards (e.g., encryption) are reinforced by procedural (e.g., audits) and organizational (e.g., governance) layers, mirroring the Swiss Cheese Model’s redundancy principle.
Resilience Engineering: Evolving the Layers
Resilience engineering moves beyond static defenses, focusing on a system’s capacity to anticipate, adapt, and recover from disruptions. It complements the Four Layers by adding dynamism:
Traditional Layer
Resilience Engineering Approach
Example
Inherent Design
Build adaptive capacity (e.g., modular systems)
Pharmaceutical plants with flexible cleanroom layouts
Procedural
Dynamic procedures adjusted via real-time data
AI-driven prescribing systems updating dosage limits during shortages
While the Swiss Cheese Model remains influential, critics argue it oversimplifies complex systems where layers interact unpredictably. For example, a malfunctioning algorithm (technical) could override procedural safeguards, necessitating organizational oversight of machine learning outputs.
Future applications will likely integrate:
Predictive Analytics: Leverages advanced algorithms, machine learning, and vast datasets to forecast future risks and opportunities, transforming risk management from a reactive to a proactive discipline. By analyzing historical and real-time data, predictive analytics identifies patterns and anomalies that signal potential threats—such as equipment failures or contamination events —enabling organizations to anticipate and mitigate risks before they escalate. The technology’s adaptability allows it to integrate internal and external data sources, providing dynamic, data-driven insights that support better decision-making, resource allocation, and compliance monitoring. As a result, predictive analytics not only enhances operational resilience and efficiency but also reduces costs associated with failures, recalls, or regulatory breaches, making it an indispensable tool for modern risk and quality management.
Human-Machine Teaming: Integrates human cognitive flexibility with machine precision to create collaborative systems that outperform isolated human or machine efforts. By framing machines as adaptive teammates rather than passive tools, HMT enables dynamic task allocation. Key benefits include accelerated decision-making through AI-driven data synthesis, reduced operational errors via automated safeguards, and enhanced resilience in complex environments. However, effective HMT requires addressing challenges such as establishing bidirectional trust through explainable AI, aligning ethical frameworks for accountability, and balancing autonomy levels through risk-categorized architectures. As HMT evolves, success hinges on designing systems that leverage human intuition and machine scalability while maintaining rigorous quality protocols.
Epistemic Governance: The processes through which actors collectively shape perceptions, validate knowledge, and steer decision-making in complex systems, particularly during crises. Rooted in the dynamic interplay between recognized reality (actors’ constructed understanding of a situation) and epistemic work (efforts to verify, apply, or challenge knowledge), this approach emphasizes adaptability over rigid frameworks. By appealing to norms like transparency and scientific rigor, epistemic governance bridges structural frameworks (e.g., ISO standards) and grassroots actions, enabling systems to address latent organizational weaknesses while fostering trust. It also confronts power dynamics in knowledge production, ensuring marginalized voices inform policies—a critical factor in sustainability and crisis management where equitable participation shapes outcomes. Ultimately, it transforms governance into a reflexive practice, balancing institutional mandates with the agility to navigate evolving threats.
Conclusion
The Four Layers of Protection, rooted in Reason’s Swiss Cheese Model, provide a versatile framework for managing risks—from data breaches to pharmaceutical contamination. By integrating standards and embracing resilience engineering, organizations can transform static defenses into adaptive systems capable of navigating modern complexities. As industries face evolving threats, the synergy between layered defenses and dynamic resilience will define the next era of risk management.
Statistical Process Control (SPC) is both a standalone methodology and a critical component of broader quality management systems. Rooted in statistical principles, SPC enables organizations to monitor, control, and improve processes by distinguishing between inherent (common-cause) and assignable (special-cause) variation. This blog post explores SPC’s role in modern quality strategies, control charts as its primary tools, and practical steps for implementation, while emphasizing its integration into holistic frameworks like Six Sigma and Quality by Design (QbD).
SPC as a Methodology and Its Strategic Integration
SPC serves as a core methodologyfor achieving process stability through statistical tools, but its true value emerges when embedded within larger quality systems. For instance:
Quality by Design (QbD): In pharmaceutical manufacturing, SPC aligns with QbD’s proactive approach, where critical process parameters (CPPs) and material attributes are predefined using risk assessment. Control charts monitor these parameters to ensure they remain within Normal Operating Ranges (NORs) and Proven Acceptable Ranges (PARs), safeguarding product quality.
Six Sigma: SPC tools like control charts are integral to the “Measure” and “Control” phases of the DMAIC (Define-Measure-Analyze-Improve-Control) framework. By reducing variability, SPC helps achieve Six Sigma’s goal of near-perfect processes.
Regulatory Compliance: In regulated industries, SPC supports Ongoing Process Verification (OPV) and lifecycle management. For example, the FDA’s Process Validation Guidance emphasizes SPC for maintaining validated states, requiring trend analysis of quality metrics like deviations and out-of-specification (OOS) results.
This integration ensures SPC is not just a technical tool but a strategic asset for continuous improvement and compliance.
When to Use Statistical Process Control
SPC is most effective in environments where process stability and variability reduction are critical. Below are key scenarios for its application:
High-Volume Manufacturing
In industries like automotive or electronics, where thousands of units are produced daily, SPC identifies shifts in process mean or variability early. For example, control charts for variables data (e.g., X-bar/R charts) monitor dimensions of machined parts, ensuring consistency across high-volume production runs. The ASTM E2587 standard highlights that SPC is particularly valuable when subgroup data (e.g., 20–25 subgroups) are available to establish reliable control limits.
Batch Processes with Critical Quality Attributes
In pharmaceuticals or food production, batch processes require strict adherence to specifications. Attribute control charts (e.g., p-charts for defect rates) track deviations or OOS results, while individual/moving range (I-MR) charts monitor parameters.
Regulatory and Compliance Requirements
Regulated industries (e.g., pharmaceutical, medical devices, aerospace) use SPC to meet standards like ISO 9001 or ICH Q10. For instance, SPC’s role in Continious Process Verification (CPV) ensures processes remain in a state of control post-validation. The FDA’s emphasis on data-driven decision-making aligns with SPC’s ability to provide evidence of process capability and stability.
Continuous Improvement Initiatives
SPC is indispensable in projects aimed at reducing waste and variation. By identifying special causes (e.g., equipment malfunctions, raw material inconsistencies), teams can implement corrective actions. Western Electric Rules applied to control charts detect subtle shifts, enabling root-cause analysis and preventive measures.
Early-Stage Process Development
During process design, SPC helps characterize variability and set realistic tolerances. Exponentially Weighted Moving Average (EWMA) charts detect small shifts in pilot-scale batches, informing scale-up decisions. ASTM E2587 notes that SPC is equally applicable to both early-stage development and mature processes, provided rational subgrouping is used.
Supply Chain and Supplier Quality
SPC extends beyond internal processes to supplier quality management. c-charts or u-charts monitor defect rates from suppliers, ensuring incoming materials meet specifications.
In all cases, SPC requires sufficient data (typically ≥20 subgroups) and a commitment to data-driven culture. It is less effective in one-off production or where measurement systems lack precision.
Control Charts: The Engine of SPC
Control charts are graphical tools that plot process data over time against statistically derived control limits. They serve two purposes:
Monitor Stability: Detect shifts or trends indicating special causes.
Drive Improvement: Provide data for root-cause analysis and corrective actions.
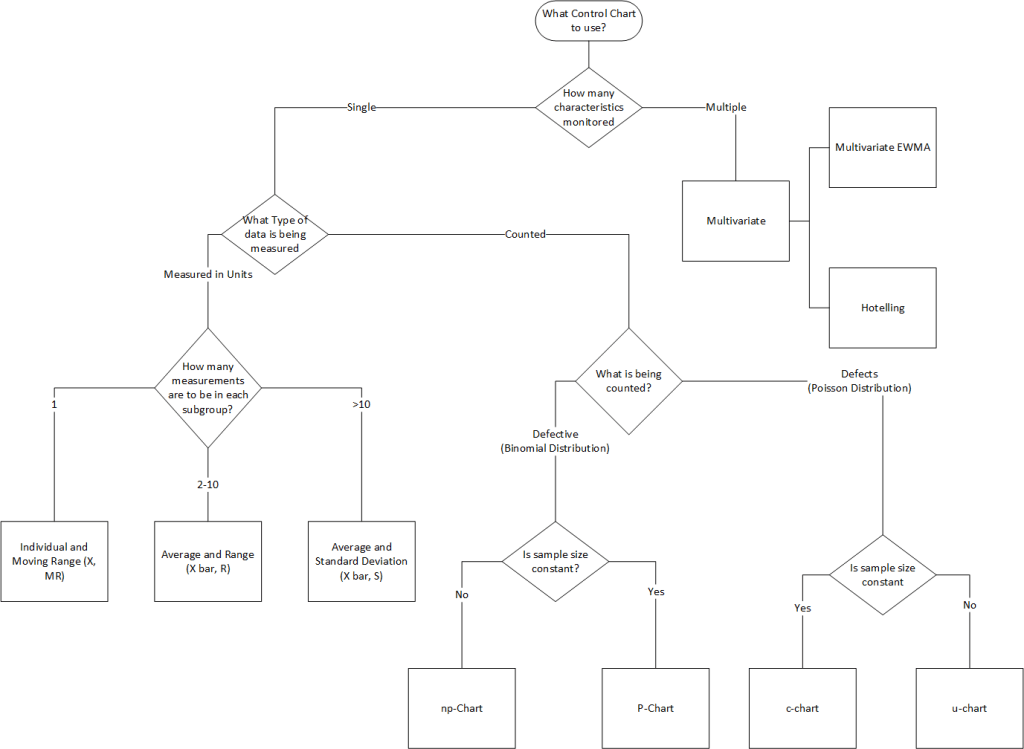
Types of Control Charts
Control charts are categorized by data type:
Data Type
Chart Type
Use Case
Variables (Continuous)
X-bar & R
Monitor process mean and variability (subgroups of 2–10).
X-bar & S
Similar to X-bar & R but uses standard deviation.
Individual & Moving Range (I-MR)
For single measurements (e.g., batch processes).
Attributes (Discrete)
p-chart
Proportion of defective units (variable subgroup size).
np-chart
Number of defective units (fixed subgroup size).
c-chart
Count of defects per unit (fixed inspection interval).
u-chart
Defects per unit (variable inspection interval).
Decision Rules: Western Electric and Nelson Rules
Control charts become actionable when paired with decision rules to identify non-random variation:
Western Electric Rules
A process is out of control if:
1 point exceeds 3σ limits.
2/3 consecutive points exceed 2σ on the same side.
4/5 consecutive points exceed 1σ on the same side.
Define Normal Operating Ranges (NORs) and Proven Acceptable Ranges (PARs) for CPPs.
Set alert limits (e.g., 2σ) and action limits (3σ) for KPIs like deviations or OOS results.
Trending Practices:
Quarterly Reviews: Assess control charts for special causes.
Annual NOR Reviews: Re-evaluate limits after process changes.
CAPA Integration: Investigate trends and implement corrective actions.
Conclusion
SPC is a powerhouse methodology that thrives when embedded within broader quality systems. By aligning SPC with control strategies—through NORs, PARs, and structured trending—organizations achieve not just compliance, but excellence. Whether in pharmaceuticals, manufacturing, or beyond, SPC remains a timeless tool for mastering variability.
The Pareto Principle, commonly known as the 80/20 rule, has been a cornerstone of efficiency strategies for over a century. While its applications span industries—from business optimization to personal productivity—its limitations often go unaddressed. Below, we explore its historical roots, inherent flaws, and strategies to mitigate its pitfalls while identifying scenarios where alternative tools may yield better results.
From Wealth Distribution to Quality Control
Vilfredo Pareto, an Italian economist and sociologist (1848–1923), observed that 80% of Italy’s wealth was concentrated among 20% of its population. This “vital few vs. trivial many” concept later caught the attention of Joseph M. Juran, a pioneer in statistical quality control. Juran rebranded the principle as the Pareto Principle to describe how a minority of causes drive most effects in quality management, though he later acknowledged the misattribution to Pareto. Despite this, the 80/20 rule became synonymous with prioritization, emphasizing that focusing on the “vital few” could resolve the majority of problems.
Since then the 80/20 rule, or Pareto Principle, has become a dominant framework in business thinking due to its ability to streamline decision-making and resource allocation. It emphasizes that 80% of outcomes—such as revenue, profits, or productivity—are often driven by just 20% of inputs, whether customers, products, or processes. This principle encourages businesses to prioritize their “vital few” contributors, such as top-performing products or high-value clients, while minimizing attention on the “trivial many”. By focusing on high-impact areas, businesses can enhance efficiency, reduce waste, and achieve disproportionate results with limited effort. However, this approach also requires ongoing analysis to ensure priorities remain aligned with evolving market dynamics and organizational goals.
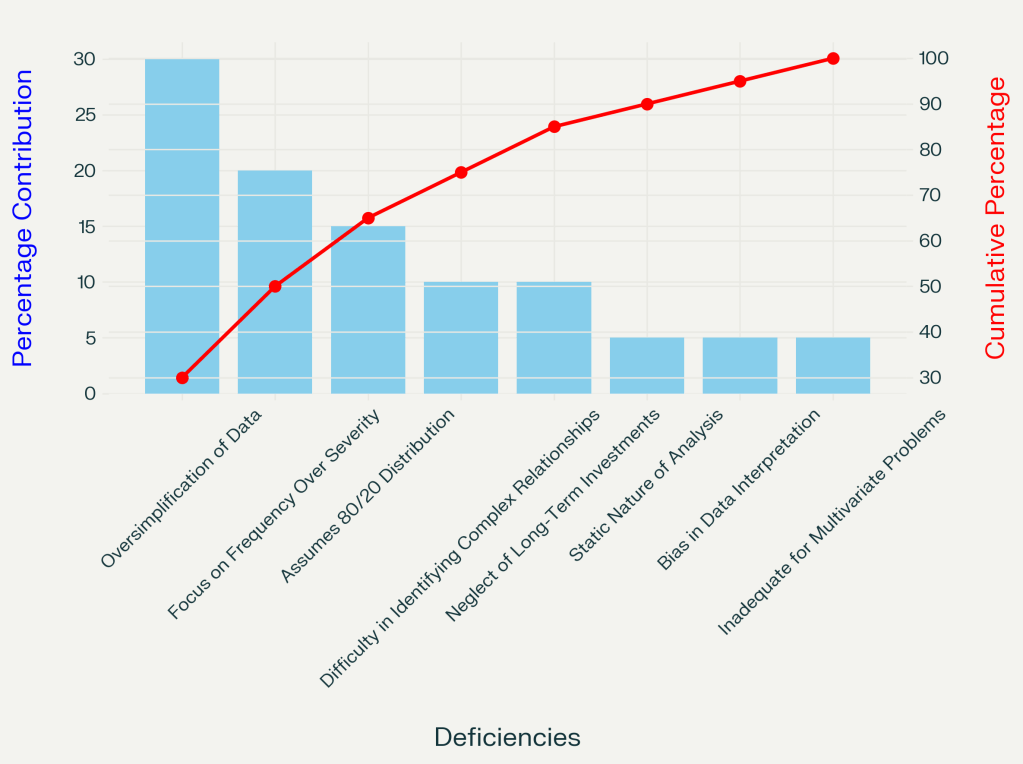
Key Deficiencies of the Pareto Principle
1. Oversimplification and Loss of Nuance
Pareto analysis condenses complex data into a ranked hierarchy, often stripping away critical context. For example:
Frequency ≠ Severity: Prioritizing frequent but low-impact issues (e.g., minor customer complaints) over rare, catastrophic ones (e.g., supply chain breakdowns) can misdirect resources.
Static and Historical Bias: Reliance on past data ignores evolving variables, such as supplier price spikes or regulatory changes, leading to outdated conclusions.
2. Misguided Assumption of 80/20 Universality
The 80/20 ratio is an approximation, not a law. In practice, distributions vary:
A single raw material shortage might account for 90% of production delays in pharmaceutical manufacturing, rendering the 80/20 framework irrelevant.
Complex systems with interdependent variables (e.g., manufacturing defects) often defy simple categorization.
3. Neglect of Qualitative and Long-Term Factors
Pareto’s quantitative focus overlooks:
Relationship-building, innovation, or employee morale, which can be hard to quantify into immediate metrics but drive long-term success.
Ethical equity: Pareto improvements (e.g., favoring one demographic without harming another) ignore fairness, risking inequitable outcomes.
4. Inability to Analyze Multivariate Problems
Pareto charts struggle with interconnected issues, such as:
Cascade failures within a system, such as a bioreactor
Root Cause Analysis (RCA): Use the Why-Why to drill into Pareto-identified issues. For instance, if machine malfunctions dominate defect logs, ask: Why do seals wear out? → Lack of preventive maintenance.
Scatter Plots: Test correlations between variables (e.g., material costs vs. production delays) to validate Pareto assumptions.
Validate Assumptions and Update Data
Regularly reassess whether the 80/20 distribution holds.
Integrate qualitative feedback (e.g., employee insights) to balance quantitative metrics.
Focus on Impact, Not Just Frequency
Weight issues by severity and strategic alignment. A rare but high-cost defect in manufacturing may warrant more attention than frequent, low-cost ones.
Resource Allocation: Streamline efforts in quality control or IT, provided distributions align with 80/20
When to Use Alternatives
Scenario
Better Tools
Example Use Case
Complex interdependencies
FMEA
Diagnosing multifactorial supply chain failures
Dynamic environments
PDCA Cycles, Scenario Planning
Adapting to post-tariff supply chain world
Ethical/equity concerns
Cost-Benefit Analysis, Stakeholder Mapping
Culture of Quality Issues
A Tool, Not a Framework
The Pareto Principle remains invaluable for prioritization but falters as a standalone solution. By pairing it with root cause analysis, ethical scrutiny, and adaptive frameworks, organizations can avoid its pitfalls. In complex, evolving, or equity-sensitive contexts, tools like Fishbone Diagrams or Scenario Planning offer deeper insights. As Juran himself implied, the “vital few” must be identified—and continually reassessed—through a lens of nuance and rigor.