Evaluating Controls as Part of Risk Management

When I teach an introductory risk management class, I usually use an icebreaker of “What is the riskiest activity you can think of doing. Inevitably you will get some version of skydiving, swimming with sharks, jumping off bridges. This activity is great because it starts all conversations around likelihood and severity. At heart, the question brings out the concept of risk important activities and the nature of controls.

The things people think of, such as skydiving, are great examples of activities that are surrounded by activities that control risk. The very activity is based on accepting reducing risk as low as possible and then proceeding in the safest possible pathway. These risk important activities are the mechanism just before a critical step that:

  1. Ensure the appropriate transfer of information and skill
  2. Ensure the appropriate number of actions to reduce risk
  3. Influence the presence or effectiveness of barriers
  4. Influence the ability to maintain positive control of the moderation of hazards

Risk important activities is a concept important to safety-thought and are at the center of a lot of human error reduction tools and practices. Risk important activities are all about thinking through the right set of controls, building them into the procedure, and successfully executing them before reaching the critical step of no return. Checklists are a great example of this mindset at work, but there are a ton of ways of doing them.

In the hospital they use a great thought process, “Five rights of Safe Medication Practices” that are: 1) right patient, 2) right drug, 3) right dose, 4) right route, and 5) right time. Next time you are getting medication in the doctor’s office or hospital evaluate just what your caregiver is doing and how it fits into that process. Those are examples of risk important activities.

Assessing controls during risk assessment

Risk is affected by the overall effectiveness of any controls that are in place.

The key aspects of controls are:

  • the mechanism by which the controls are intended to modify risk
  • whether the controls are in place, are capable of operating as intended, and are achieving the expected results
  • whether there are shortcomings in the design of controls or the way they are applied
  • whether there are gaps in controls
  • whether controls function independently, or if they need to function collectively to be effective
  • whether there are factors, conditions, vulnerabilities or circumstances that can reduce or eliminate control effectiveness including common cause failures
  • whether controls themselves introduce additional risks.

A risk can have more than one control and controls can affect more than one risk.

We always want to distinguish between controls that change likelihood, consequences or both, and controls that change how the burden of risk is shared between stakeholders

Any assumptions made during risk analysis about the actual effect and reliability of controls should be validated where possible, with a particular emphasis on individual or combinations of controls that are assumed to have a substantial modifying effect. This should take into account information gained through routine monitoring and review of controls.

Risk Important Activities, Critical Steps and Process

Critical steps are the way we meet our critical-to-quality requirements. The activities that ensure our product/service meets the needs of the organization.

These critical steps are the points of no-return, the point where the work-product is transformed into something else. Risk important activities are what we do to remove the danger of executing that critical step.

Beyond that critical step, you have rejection or rework. When I am cooking there is a lot of prep work which can be a mixture of critical steps, from which there is no return. I break the egg wrong and get eggshells in my batter, there is a degree of rework necessary. This is true for all our processes.

The risk-based approach to the process is to understand the critical steps and mitigate controls.

We are thinking through the following:

  • Critical Step: The action that triggers irreversibility. Think in terms of critical-to-quality attributes.
  • Input: What came before in the process
  • Output: The desired result (positive) or the possible difficulty (negative)
  • Preconditions: Technical conditions that must exist before the critical step
  • Resources: What is needed for the critical step to be completed
  • Local factors: Things that could influence the critical step. When human beings are involved, this is usually what can influence the performer’s thinking and actions before and during the critical step
  • Defenses: Controls, barriers and safeguards

Risk Management Mindset

Good risk management requires a mindset that includes the following attributes:

  • Expect to be surprised: Our processes are usually underspecified and there is a lot of hidden knowledge. Risk management serves to interrogate the unknowns
  • Possess a chronic sense of unease: There is no such thing as perfect processes, procedures, training, design, planning. Past performance is not a guarantee of future success.
  • Bend, not break: Everything is dynamic, especially risk. Quality comes from adaptability.
  • Learn: Learn from what goes well, from mistakes, have a learning culture
  • Embrace humility: No one knows everything, bring those in who know what you do not.
  • Acknowledge differences between work-as-imagined and work-as-done: Work to reduce the differences.
  • Value collaboration: Diversity of input
  • Drive out subjectivity: Understand how opinions are formed and decisions are made.
  • Systems Thinking: Performance emerges from complex, interconnected and interdependent systems and their components

The Role of Monitoring

One cannot control risk, or even successfully identify it unless a system is able flexibly to monitor both its own performance (what happens inside the system’s boundary) and what happens in the environment (outside the system’s boundary). Monitoring improves the ability to cope with possible risks

When performing the risk assessment, challenge existing monitoring and ensure that the right indicators are in place. But remember, monitoring itself is a low-effectivity control.

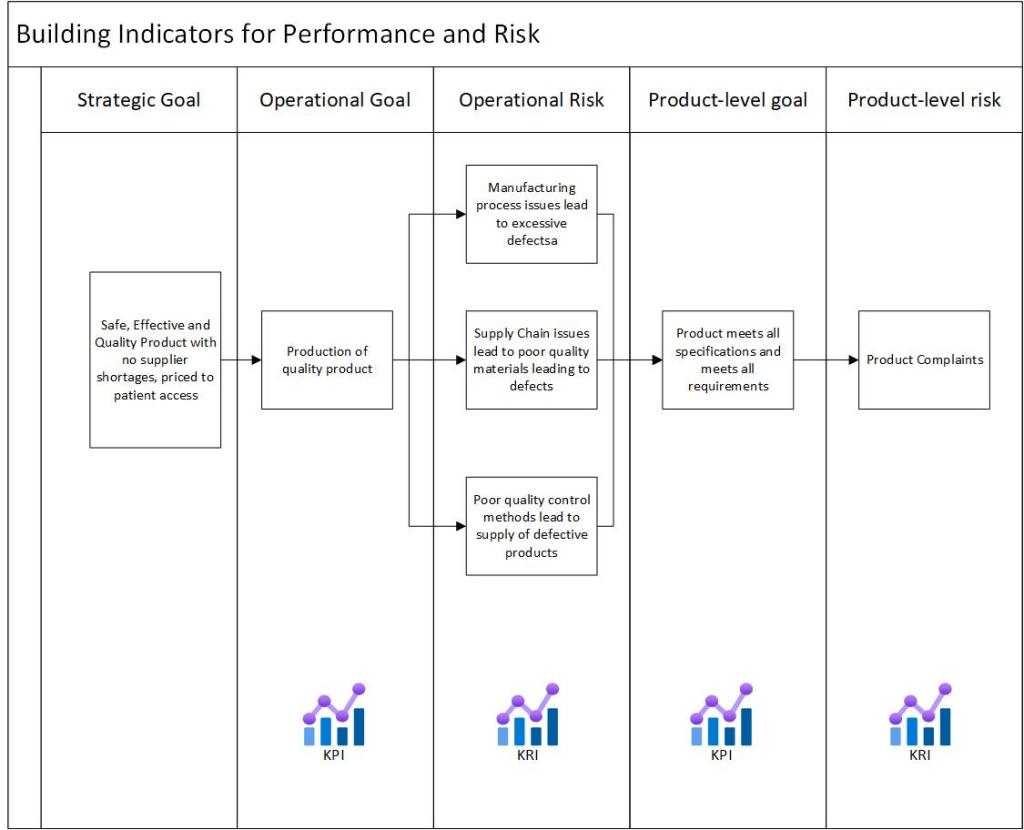
Ensure that there are leading indicators, which can be used as valid precursors for changes and events that are about to happen.

For each monitoring control, as yourself the following:

IndicatorHow have the indicators been defined? (By analysis, by tradition, by industry consensus, by the regulator, by international standards, etc.)
RelevanceWhen was the list created? How often is it revised? On which basis is it revised? Who is responsible for maintaining the list?
TypeHow many of the indicators are of the ‘leading,’ type and how many are of the lagging? Do indicators refer to single or aggregated measurements?
ValidityHow is the validity of an indicator established (regardless of whether it is leading or lagging)? Do indicators refer to an articulated process model, or just to ‘common sense’?
DelayFor lagging indicators, how long is the typical lag? Is it acceptable?
Measurement typeWhat is the nature of the measurements? Qualitative or quantitative? (If quantitative, what kind of scaling is used?)
Measurement frequencyHow often are the measurements made? (Continuously, regularly, every now and then?)
AnalysisWhat is the delay between measurement and analysis/interpretation? How many of the measurements are directly meaningful and how many require analysis of some kind? How are the results communicated and used?
StabilityAre the measured effects transient or permanent?
Organization SupportIs there a regular inspection scheme or -schedule? Is it properly resourced? Where does this measurement fit into the management review?

Key risk indicators come into play here.

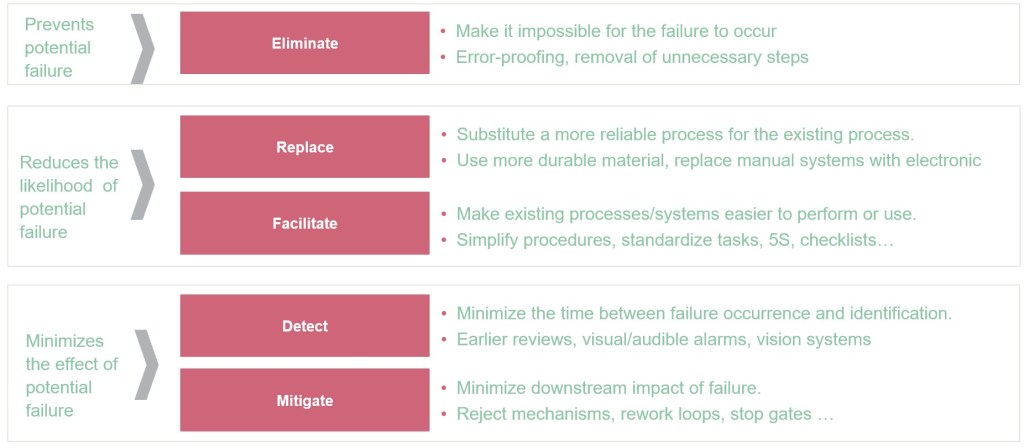
Hierarchy of Controls

Not every control is the same. This principle applies to both current control and planning future controls.

Documents and the Heart of the Quality System

A month back on LinkedIn I complained about a professional society pushing the idea of a document-free quality management system. This has got to be one of my favorite pet peeves that come from Industry 4.0 proponents, and it demonstrates a fundamental failure to understand core concepts. And frankly one of the reasons why many Industry/Quality/Pharma 4.0 initiatives truly fail to deliver. Unfortunately, I didn’t follow through with my idea of proposing a session to that conference, so instead here are my thoughts.

Fundamentally, documents are the lifeblood of an organization. But paper is not. This is where folks get confused. But fundamentally, this confusion is also limiting us.

Let’s go back to basics, which I covered in my 2018 post on document management.

When talking about documents, we really should talk about function and not just by name or type. This allows us to think more broadly about our documents and how they function as the lifeblood.

There are three types of documents:

  • Functional Documents provide instructions so people can perform tasks and make decisions safely effectively, compliantly, and consistently. This usually includes things like procedures, process instructions, protocols, methods, and specifications. Many of these need some sort of training decision. Functional documents should involve a process to ensure they are up-to-date, especially in relation to current practices and relevant standards (periodic review)
  • Records provide evidence that actions were taken, and decisions were made in keeping with procedures. This includes batch manufacturing records, logbooks and laboratory data sheets and notebooks. Records are a popular target for electronic alternatives.
  • Reports provide specific information on a particular topic on a formal, standardized way. Reports may include data summaries, findings, and actions to be taken.

The beating heart of our quality system brings us from functional to record to reports in a cycle of continuous improvement.

Functional documents are how we realize requirements, that is the needs and expectations of our organization. There are multiple ways to serve up the functional documents, the big three being paper, paper-on-glass, and some sort of execution system. That last, an execution system, united function with record, which is a big chunk of the promise of an execution system.

The maturation mind is to go from mostly paper execution, to paper-on-glass, to end-to-end integration and execution to drive up reliability and drive out error. But at the heart, we still have functional documents, records, and reports. Paper goes, but the document is there.

So how is this failing us?

Any process is a way to realize a set of requirements. Those requirements come from external (regulations, standards, etc) and internal (efficiency, business needs) sources. We then meet those requirements through People, Procedure, Principles, and Technology. They are interlinked and strive to deliver efficiency, effectiveness, and excellence.

So this failure to understand documents means we think we can solve this through a single technology application. an eQMS will solve problems in quality events, a LIMS for the lab, an MES for manufacturing. Each of these is a lever for change but alone cannot drive the results we want.

Because of the limitations of this thought process we get systems designed for yesterday’s problems, instead of thinking through towards tomorrow.

We get documentation systems that think of functional documents pretty much the same way we thought of them 30 years ago, as discrete things. These discrete things then interact through a gap with our electronic systems. There is little traceability, which complicates change control and makes it difficult to train experts. The funny thing, is we have the pieces, but because of the limitations of our technology we aren’t leveraging them.

The v-model approach should be leveraged in a risk-based manner to the design of our full system, and not just our technical aspects.

System feasibility matches policy and governance, user requirements allow us to trace to what elements are people, procedure, principles, and/or technology. Everything then stems from there.

Build Key Risk Indicators

We perform risk assessments; execute risk mitigations; and we end up with four types of inherent risks (parenthesis is opportunities) in our risk register:

  1. Mitigated (or enhanced)
  2. Avoided (or exploited)
  3. Transferred (or shared)
  4. Accepted

We’ve built a set of risk response plans to ensure we are continuing to treat these risks. And now we need to monitor the effectiveness of our risk plan and to ensure that the risks are behaving in the manner anticipated during risk treatment.

The living risk assessment is designed to conduct reassessment of risks after treatment and continuously throughout the life cycle. However, not all systems and risks need to be reassessed continually, and the organization should prioritize which systems should be reassessed based on a schedule.

Identify indicators that inform the organization about the status of the risk without having to conduct a full risk assessment every time. The trending status of these indicators can act as a flag for investigations, which may result in complete risk assessments.

This risk indicator is then a metric that indicates the state of the level of risk. It is important to note that not all indicators show the exact level of risk exposure, instead providing a trend of drivers, causes or intermediary effects of risk.

The most important risks can be categorized as key risks and the indicators for these key risks are known as key risk indicators (KRIs) which can be defined as: A metric that provides a leading or lagging indicator of the current state of risk exposure on key objectives. KRIs can be used to continually assess current and predict potential risk exposures.

These KRIs need to have a strong relationship with the key performance indicators of the organization.

KRIs are monitored through Quality Management Review.

A good rule of thumb is as you identify the key performance indicators to assess the performance of a specific process, product, system or function you then identify the risks and the KRIs for that objective.

Strive to have leading indicators that measure the elements that influences the risk performance. Lagging indicators will measure they actual performance of the risk controls.

These KRIs qualitatively or quantitatively present the risk exposure by having a strong relationship qirh the risk, its intermediate output or its drivers.

Let’s think in terms of a pharmaceutical supply chain. We’ve done our risk assessments and end up with a top level view like this:

For the risk column we should have some good probabilities and impacts and mitigations in place. We can then chose some KRIs to monitor, such as

  1. Nonconformance rate
  2. Supplier score card
  3. Lab error rate
  4. Product Complaints

As we develop, our KRIs can get more specific and focused. A good KRI is:

  • Quantifiable
  • Measurable (accurately and precisely) 
  • Can be validated (have a high level of confidence) 
  • Relevant (measuring the right thing associated with decisions) 

In developing a KRI to serve as a leading indicator for potential future occurrences of a risk, it can be helpful to think through the chain of events that led to the event so that management can uncover the ultimate driver (i.e., root cause(s)) of the risk event. When KRIs for root cause events and intermediate events are monitored, we are in an enviable position to identify early mitigation strategies that can begin to reduce or eliminate the impact associated with an emerging risk event.

These KRIs will help us monitor and quantify our risk exposure. They help our organizations compare business objectives and strategy to actual performance to isolate changes, measure the effectiveness of processes or projects, and demonstrate changes in the frequency or impact of a specific risk event.

Effective KRIs can provide value to the organization in a variety of ways. Potential value may be derived from each of the following contributions:

  • Risk Appetite – KRIs require the determination of appropriate thresholds for action at different levels within the organization. By mapping KRI measures to identified risk appetite and tolerance levels, KRIs can be a useful tool for better articulating the risk appetite that best represents the organizational mindset.
  • Risk and Opportunity Identification – KRIs can be designed to alert management to trends that may adversely affect the achievement of organizational objectives or may indicate the presence of new opportunities.
  • Risk Treatment – KRIs can initiate action to mitigate developing risks by serving as triggering mechanisms. KRIs can serve as controls by defining limits to certain actions.

The Risk Register

Every organization should ask themselves seven questions about the health of their risk management program.

  1. Do you have a risk management plan?
  2. Have you identified and captured your risks in a risk register?
  3. How have you evaluated and prioritized your risks?
  4. Have you engaged the appropriate stakeholders in the risk identification and evaluation processes?
  5. What about risk owners? Does each risk have a risk owner?
  6. Have the risk owners developed risk response plans for the highest risks?
  7. Are you facilitating a review of your risks periodically, resulting in updates to the risk register and effective risk responses?

At the heart of this program sits the Risk Register, which brings together information about risks to inform those exposed to risks and those who have responsibility for their management. A risk register is used to record and track information about individual risks and how they are being controlled. It can be used to communicate information about risks to stakeholders and highlight particularly important risks. While it can be used at any level of the organization where there are a large number of risks, controls and treatments that need to be tracked, a risk register really shines as a central component of a quality management review. The risk register includes:

  • List of risks, failure modes or hazards and expected outcomes
  • A statement about the probability of consequences occurring
  • Sources or causes of the risk
  • Priority or risk levels
  • What is currently being done to control the risk
  • Risk owner
  • Actual outcome, if and when available

Risks are generally listed individually as separate events but interdependencies should be flagged.

In recording information about risks, the distinction between risks (the potential effects of what might happen) and risk sources (how or why it might happen) and controls that might fail should be explicit. It can also be useful to indicate the early warning signs that an event might be about to occur.

Many risk registers also include some rating of the significance of a risk, an indication of whether a risk is considered to be acceptable or tolerable, or whether further treatment is needed and the reasons for this decision. Where a significance rating is applied to a risk based on consequences and their likelihood, this should take account of the possibility that controls will fail. A level of risk should not be allocated for the failure of a control as if it were an independent risk.

A risk register is used as the basis for tracking implementation of proposed treatments, so it should contain information about treatments and how they will be implemented, or make reference to other documents or data bases with this information. (Such information can include risk owners, actions, action owners, action business case summaries, budgets and timelines, etc.). This living document can usually roll (or even serve as) the Quality Plan.

Strengths of risk registers include the following.

  • Information about risks is brought together in a form where actions required can be identified and tracked.
  • Information about different risks is presented in a comparable format, which can be used to indicate priorities and is relatively easy to interrogate.
  • The construction of a risk register usually involves many people and raises general awareness of the need to manage risk.

By doing this, the risk register serves as a central underpining for the organization as it builds a risk culture, driving transparency and accountability.

Building Risk Based Thinking in the Organization requires a strong governance structure


Pay attention the the following limitations:

  • Risks captured in risk registers are typically based on events, which can make it difficult to accurately characterize some forms of risk
  • The apparent ease of use can give misplaced confidence in the information because it can be difficult to describe risks consistently and sources of risk, risks, and weaknesses in controls for risk are often confused.
  • There are many different ways to describe a risk and any priority allocated will depend on the way the risk is described and the level of disaggregation of the issue.
  • Considerable effort is required to keep a risk register up to date (for example, all proposed treatments should be listed as current controls once they are implemented, new risks should be continually added and those that no longer exist removed).
  • Risks are typically captured in risk registers individually. This can make it difficult to consolidate information to develop an overall treatment program.

Artifacts, like the risk register, both demonstrate and channel culture. Invest the time in your organization’s register, and you will reap dividends towards developing a risk friendly culture.

Measuring Training Effectiveness for Organizational Performance

When designing training we want to make sure four things happen:

  • Training is used correctly as a solution to a performance problem
  • Training has the the right content, objectives or methods
  • Trainees are sent to training for which they do have the basic skills, prerequisite skills, or confidence needed to learn
  • Training delivers the expected learning

Training is a useful lever in organization change and improvement. We want to make sure the training drives organization metrics. And like everything, you need to be able to measure it to improve.

The Kirkpatrick model is a simple and fairly accurate way to measure the effectiveness of adult learning events (i.e., training), and while other methods are introduced periodically, the Kirkpatrick model endures because of its simplicity. The model consists of four levels, each designed to measure a specific element of the training. Created by Donald Kirkpatrick, this model has been in use for over 50 years, evolving over multiple decades through application by learning and development professionals around the world. It is the most recognized method of evaluating the effectiveness of training programs. The model has stood the test of time and became popular due to its ability to break down complex subject into manageable levels. It takes into account any style of training, both informal and formal.

Level 1: Reaction

Kirkpatrick’s first level measures the learners’ reaction to the training. A level 1 evaluation is leveraging the strong correlation between learning retention and how much the learners enjoyed the time spent and found it valuable. Level 1 evaluations, euphemistically called a “smile sheet” should delve deeper than merely whether people liked the course. A good course evaluation will concentrate on three elements: course content, the physical environment and the instructor’s presentation/skills.

Level 2: Learning

Level 2 of Kirkpatrick’s model, learning, measures how much of the content attendees learned as a result of the training session. The best way to make this evaluation is through the use of a pre- and posttest. Pre- and posttests are key to ascertaining whether the participants learned anything in the learning event. Identical pre- and posttests are essential because the difference between the pre- and posttest scores indicates the amount of learning that took place. Without a pretest, one does not know if the trainees knew the material before the session, and unless the questions are the same, one cannot be certain that trainees learned the material in the session.

Level 3: Behavior

Level 3 measures whether the learning is transferred into practice in the workplace.

Level 4: Results

Measures the effect on the business environment. Do we meet objectives?

Evaluation LevelCharacteristicsExamples
Level 1: ReactionReaction evaluation is how the delegates felt, and their personal reactions to the training or learning experience, for example: ▪ Did trainee consider the training relevant?
▪ Did they like the venue, equipment, timing, domestics, etc?
▪ Did the trainees like and enjoy the training?
▪ Was it a good use of their time?
▪ Level of participation
▪ Ease and comfort of experience
▪ feedback forms based on subjective personal reaction to the training experience
▪ Verbal reaction which can be analyzed
▪ Post-training surveys or questionnaires
▪ Online evaluation or grading by delegates
▪ Subsequent verbal or written reports given by delegates to managers back at their jobs
▪ typically ‘happy sheets’
Level 2: LearningLearning evaluation is the measurement of the increase in knowledge or intellectual capability from before to after the learning experience:
▪ Did the trainees learn what intended to be taught?
▪ Did the trainee experience what was intended for them to experience?
▪ What is the extent of advancement or change in the trainees after the training, in the direction or area that was intended?
▪ Interview or observation can be used before and after although it is time-consuming and can be inconsistent
▪ Typically assessments or tests before and after the training
▪ Methods of assessment need to be closely related to the aims of the learning
▪ Reliable, clear scoring and measurements need to be established
▪ hard-copy, electronic, online or interview style assessments are all possible
Level 3: BehaviorBehavior evaluation is the extent to which the trainees applied the learning and changed their behavior, and this can be immediately and several months after the training, depending on the situation:
▪ Did the trainees put their learning into effect when back on the job?
▪ Were the relevant skills and knowledge used?
▪ Was there noticeable and measurable change in the activity and performance of the trainees when back in their roles?
▪ Would the trainee be able to transfer their learning to another person? is the trainee aware of their change in behavior, knowledge, skill level?
▪ Was the change in behavior and new level of knowledge sustained?
▪ Observation and interview over time are required to assess change, relevance of change, and sustainability of change
▪ Assessments need to be designed to reduce subjective judgment of the observer
▪ 360-degree feedback is useful method and need not be used before training, because respondents can make a judgment as to change after training, and this can be analyzed for groups of respondents and trainees
▪ Online and electronic assessments are more difficult to incorporate – assessments tend to be more successful when integrated within existing management and coaching protocols
Level 4: ResultsResults evaluation is the effect on the business or environment resulting from the improved performance of the trainee – it is the acid test

Measures would typically be business or organizational key performance indicators, such as: volumes, values, percentages, timescales, return on investment, and other quantifiable aspects of organizational performance, for instance; numbers of complaints, staff turnover, attrition, failures, wastage, non-compliance, quality ratings, achievement of standards and accreditations, growth, retention, etc.
The challenge is to identify which and how relate to the trainee’s input and influence. Therefore it is important to identify and agree accountability and relevance with the trainee at the start of the training, so they understand what is to be measured
▪ This process overlays normal good management practice – it simply needs linking to the training input
▪ For senior people particularly, annual appraisals and ongoing agreement of key business objectives are integral to measuring business results derived from training
4 Levels of Training Effectiveness

Example in Practice – CAPA

When building a training program, start with the intended behaviors that will drive results. Evaluating our CAPA program, we have two key aims, which we can apply measures against.

BehaviorMeasure
Investigate to find root cause% recurring issues
Implement actions to eliminate root causePreventive to corrective action ratio

To support each of these top-level measures we define a set of behavior indicators, such as cycle time, right the first time, etc. To support these, a review rubric is implemented.

Our four levels to measure training effectiveness will now look like this:

LevelMeasure
Level 1: Reaction Personal action plan and a happy sheet
Level 2: Learning Completion of Rubric on a sample event
Level 3: Behavior Continued performance and improvement against the Rubric and the key review behavior indicators
Level 4: Results Improvements in % of recurring issues and an increase in preventive to corrective actions

This is all about measuring the effectiveness of the transfer of behaviors.

Strong Signals of Transfer Expectations in the OrganizationSignals that Weaken Transfer Expectations in the Organization
Training participants are required to attend follow-up sesions and other transfer interventions.

What is indicates:
Individuals and teams are committed to the change and obtaining the intended benefits.
Attending the training is compulsory, but participating in follow-up sessions or oter transfer interventions is voluntary or even resisted by the organization.

What is indicates:
They key factor of a trainee is attendance, not behavior change.
The training description specifies transfer goals (e.g. “Trainee increases CAPA success by driving down recurrence of root cause”)

What is indicates:
The organization has a clear vision and expectation on what the training should accomplish.
The training description roughly outlines training goals (e.g. “Trainee improves their root cause analysis skills”)

What is indicates:
The organization only has a vague idea of what the training should accomplish.
Supervisors take time to support transfer (e.g. through pre- and post-training meetings). Transfer support is part of regular agendas.

What is indicates:
Transfer is considered important in the organization and supported by supervisors and managers, all the way to the top.
Supervisors do not invest in transfer support. Transfer support is not part of the supervisor role.

What is indicates:
Transfer is not considered very important in the organziaiton. Managers have more important things to do.
Each training ends with careful planning of individual transfer intentions.

What is indicates:
Defining transfer intentions is a central component of the training.
Transfer planning at the end of the training does not take place or only sporadically.

What is indicates:
Defining training intentions is not (or not an essential) part of the training.

Good training, and thus good and consistent transfer, builds that into the process. It is why I such a fan of utilizing a Rubric to drive consistent performance.