X-Matrix for Strategic Execution

Quality needs to be managed as a program, and as such, it must walk a delicate line between setting long-term goals, short-term goals, improvement priorities, and interacting with a suite of portfolios, programs, and KPIs. As quality professionals navigate increasingly complex regulatory landscapes, technological disruptions, and evolving customer expectations, the need for structured approaches to quality planning has never been greater.

At the heart of this activity, I use an x-matrix, a powerful tool at the intersection of strategic planning and quality management. The X-Matrix provides a comprehensive framework that clarifies the chaos, visually representing how long-term quality objectives cascade into actionable initiatives with clear ownership and metrics – connecting the dots between aspiration and execution in a single, coherent framework.

Understanding the X-Matrix: Structure and Purpose

The X-Matrix is a strategic planning tool from Hoshin Kanri methodology that brings together multiple dimensions of organizational strategy onto a single page. Named for its distinctive X-shaped pattern of relationships, this tool enables us to visualize connections between long-term breakthroughs, annual objectives, improvement priorities, and measurable targets – all while clarifying ownership and resource allocation.

The X-Matrix is structured around four key quadrants that create its distinctive shape:

  1. South Quadrant (3-5 Year Breakthrough Objectives): These are the foundational, long-term quality goals that align with organizational vision and regulatory expectations. In quality contexts, these might include achieving specific quality maturity levels, establishing new quality paradigms, or fundamentally transforming quality systems.
  2. West Quadrant (Annual Objectives): These represent the quality priorities for the coming year that contribute directly to the longer-term breakthroughs. These objectives are specific enough to be actionable within a one-year timeframe.
  3. North Quadrant (Improvement Priorities): These are the specific initiatives, projects, and process improvements that will be undertaken to achieve the annual objectives. Each improvement priority should have clear ownership and resource allocation.
  4. East Quadrant (Targets/Metrics): These are the measurable indicators that will be used to track progress toward both annual objectives and breakthrough goals. In quality planning, these often include process capability indices, deviation rates, right-first-time metrics, and other key performance indicators.

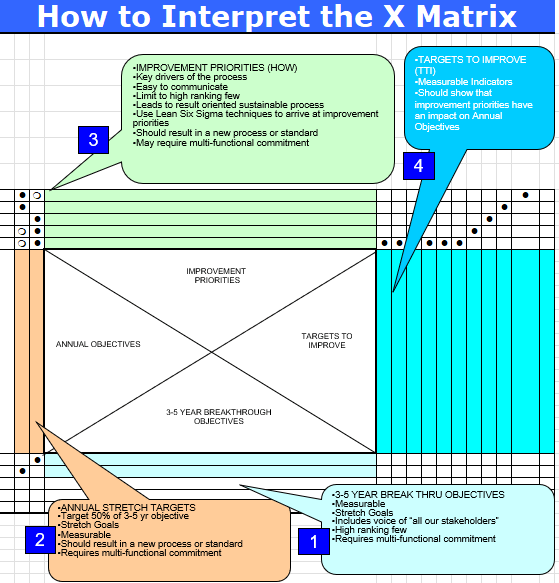
The power of the X-Matrix lies in the correlation points where these quadrants intersect. These intersections show how initiatives support objectives and how objectives align with long-term goals. They create a clear line of sight from strategic quality vision to daily operations and improvement activities.

Why the X-Matrix Excels for Quality Planning

Traditional quality planning approaches often suffer from disconnection between strategic objectives and tactical activities. Quality initiatives may be undertaken in isolation, with limited understanding of how they contribute to broader organizational goals. The X-Matrix addresses this fragmentation through its integrated approach to planning.

The X-Matrix provides visibility into the interdependencies within your quality system. By mapping the relationships between long-term quality objectives, annual goals, improvement priorities, and key metrics, quality leaders can identify potential resource conflicts, capability gaps, and opportunities for synergy.

Developing an X-Matrix necessitates cross-functional input and alignment to ensure that quality objectives are not isolated but integrated with operations, regulatory, supply chain, and other critical functions. The development of an X-Matrix encourages the back-and-forth dialogue necessary to develop realistic, aligned goals.

Perhaps most importantly for quality organizations, the X-Matrix provides the structure and rigor to ensure quality planning is not left to chance. As the FDA and other regulatory bodies increasingly emphasize Quality Management Maturity (QMM) as a framework for evaluating pharmaceutical operations, the disciplined approach embodied in the X-Matrix becomes a competitive advantage. The matrix systematically considers resource constraints, capability requirements, and performance measures – all essential components of mature quality systems.

Mapping Modern Quality Challenges to the X-Matrix

The quality landscape is evolving rapidly, with several key challenges that must be addressed in any comprehensive quality planning effort. The X-Matrix provides an ideal framework for addressing these challenges systematically. Building on the post “The Challenges Ahead for Quality” we can start to build our an X-matrix.

Advanced Analytics and Digital Transformation

As data sources multiply and processing capabilities expand, quality organizations face increased expectations for data-driven insights and decision-making. An effective X-Matrix for quality planning couldinclude:

3-5 Year Breakthrough: Establish a predictive quality monitoring system that leverages advanced analytics to identify potential quality issues before they manifest.

Annual Objectives: Implement data visualization tools for key quality metrics; establish data governance framework for GxP data; develop predictive models for critical quality attributes.

Improvement Priorities: Create cross-functional data science capability; implement automated data capture for batch records; develop real-time dashboards for process parameters.

Metrics: Percentage of quality decisions made with data-driven insights; predictive model accuracy; reduction in quality investigation cycle time through analytics.

Operational Stability in Complex Supply Networks

As pharmaceutical manufacturing becomes increasingly globalized with complex supplier networks, operational stability emerges as a critical challenge. Operational stability represents the state where manufacturing and quality processes exhibit consistent, predictable performance over time with minimal unexpected variation. The X-Matrix can address this through:

3-5 Year Breakthrough: Achieve Level 4 (Proactive) operational stability across all manufacturing sites, networks and key suppliers.

Annual Objectives: Implement statistical process control for critical processes; establish supplier quality alignment program; develop operational stability metrics and monitoring system.

Improvement Priorities: Deploy SPC training and tools; conduct operational stability risk assessments; implement regular supplier quality reviews; establish cross-functional stability team.

Metrics: Process capability indices (Cp, Cpk); right-first-time batch rates; deviation frequency and severity patterns; supplier quality performance.

Using the X-Matrix to Address Validation Challenges

Validation presents unique challenges in modern pharmaceutical operations, particularly as data systems become more complex and interconnected. Handling complex data types and relationships can be time-consuming and difficult, while managing validation rules across large datasets becomes increasingly costly and challenging. The X-Matrix offers a structured approach to addressing these validation challenges:

3-5 Year Breakthrough: Establish a risk-based, continuous validation paradigm that accommodates rapidly evolving systems while maintaining compliance.

Annual Objectives: Implement risk-based validation approach for all GxP systems; establish automated testing capabilities for critical applications; develop validation strategy for AI/ML applications.

Improvement Priorities: Train validation team on risk-based approaches; implement validation tool for automated test execution; develop validation templates for different system types; establish validation center of excellence.

Metrics: Validation cycle time reduction; percentage of validation activities conducted via automated testing; validation resource efficiency; validation effectiveness (post-implementation defects).

This X-Matrix approach to validation challenges ensures that validation activities are not merely compliance exercises but strategic initiatives that support broader quality objectives. By connecting validation priorities to annual objectives and long-term breakthroughs, organizations can justify the necessary investments and resources while maintaining a clear focus on business value.

Connecting X-Matrix Planning to Quality Maturity Models

The FDA’s Quality Management Maturity (QMM) model provides a framework for assessing an organization’s progression from reactive quality management to optimized, continuous improvement. This model aligns perfectly with the X-Matrix planning approach, as both emphasize systematic progression toward excellence.

The X-Matrix can be structured to support advancement through quality maturity levels by targeting specific capabilities associated with each level:

Maturity LevelX-Matrix Breakthrough ObjectiveAnnual ObjectivesImprovement Priorities
Reactive (Level 1)Move from reactive to controlled quality operationsEstablish baseline quality metrics; implement basic SOPs; define critical quality attributesProcess mapping; basic training program; deviation management system
Controlled (Level 2)Transition from controlled to predictive quality systemsImplement statistical monitoring; establish proactive quality planning; develop quality risk managementSPC implementation; risk assessment training; preventive maintenance program
Predictive (Level 3)Advance from predictive to proactive quality operationsEstablish leading indicators; implement knowledge management; develop cross-functional quality ownershipPredictive analytics capability; knowledge database; quality circles
Proactive (Level 4)Progress from proactive to innovative quality systemsImplement continuous verification; establish quality innovation program; develop supplier quality maturityContinuous process verification; innovation workshops; supplier development program
Innovative (Level 5)Maintain and leverage innovative quality capabilitiesEstablish industry leading practices; develop quality thought leadership; implement next-generation quality approachesQuality research initiatives; external benchmarking; technology innovation pilots

This alignment between the X-Matrix and quality maturity models offers several advantages. First, it provides a clear roadmap for progression through maturity levels. Second, it helps organizations prioritize initiatives based on their current maturity level and desired trajectory. Finally, it creates a framework for measuring and communicating progress toward maturity goals.

Implementation Best Practices for Quality X-Matrix Planning

Implementing an X-Matrix approach to quality planning requires careful consideration of several key factors.

1. Start With Clear Strategic Quality Imperatives

The foundation of any effective X-Matrix is a clear set of strategic quality imperatives that align with broader organizational goals. These imperatives should be derived from:

  • Regulatory expectations and trends
  • Customer quality requirements
  • Competitive quality positioning
  • Organizational quality vision

These imperatives form the basis for the 3-5 year breakthrough objectives in the X-Matrix. Without this clarity, the remaining elements of the matrix will lack focus and alignment.

2. Leverage Cross-Functional Input

Quality does not exist in isolation; it intersects with every aspect of the organization. Effective X-Matrix planning requires input from operations, regulatory affairs, supply chain, R&D, and other functions. This cross-functional perspective ensures that quality objectives are realistic, supported by appropriate capabilities, and aligned with broader organizational priorities.

The catchball process from Hoshin Kanri provides an excellent framework for this cross-functional dialogue, allowing for iterative refinement of objectives, priorities, and metrics based on input from various stakeholders.

3. Focus on Critical Few Priorities

The power of the X-Matrix lies in its ability to focus organizational attention on the most critical priorities. Resist the temptation to include too many initiatives, objectives, or metrics. Instead, identify the vital few that will drive meaningful progress toward quality maturity and operational excellence.

This focus is particularly important in regulated environments where resource constraints are common and compliance demands can easily overwhelm improvement initiatives. A well-designed X-Matrix helps quality leaders maintain strategic focus amid the daily demands of compliance activities.

4. Establish Clear Ownership and Resource Allocation

The X-Matrix should clearly identify who is responsible for each improvement priority and what resources they will have available. This clarity is essential for execution and accountability. Without explicit ownership and resource allocation, even the most well-conceived quality initiatives may fail to deliver results.

The structure of the X-Matrix facilitates this clarity by explicitly mapping resources to initiatives and objectives. This mapping helps identify potential resource conflicts early and ensures that critical initiatives have the support they need.

Balancing Structure with Adaptability in Quality Planning

A potential criticism of highly structured planning approaches like the X-Matrix is that they may constrain adaptability and innovation. However, a well-designed X-Matrix actually enhances adaptability by providing a clear framework for evaluating and integrating new priorities. The structure of the matrix makes it apparent when new initiatives align with strategic objectives and when they represent potential distractions. This clarity helps quality leaders make informed decisions about where to focus limited resources when disruptions occur.

The key lies in building what might be called “bounded flexibility”—freedom to innovate within well-understood boundaries. By thoroughly understanding which process parameters truly impact critical quality attributes, organizations can focus stability efforts where they matter most while allowing flexibility elsewhere. The X-Matrix supports this balanced approach by clearly delineating strategic imperatives (where stability is essential) from tactical initiatives (where adaptation may be necessary).

Change management systems represent another critical mechanism for balancing stability with innovation. Well-designed change management ensures that innovations are implemented in a controlled manner that preserves operational stability. The X-Matrix can incorporate change management as a specific improvement priority, ensuring that the organization’s ability to adapt is explicitly addressed in quality planning.

The X-Matrix as the Engine of Quality Excellence

The X-Matrix represents a powerful approach to quality planning that addresses the complex challenges facing modern quality organizations. By providing a structured framework for aligning long-term quality objectives with annual goals, specific initiatives, and measurable targets, the X-Matrix helps quality leaders navigate complexity while maintaining strategic focus.

As regulatory bodies evolve toward Quality Management Maturity models, the systematic approach embodied in the X-Matrix will become increasingly valuable. Organizations that establish and maintain strong operational stability through structured planning will find themselves well-positioned for both compliance and competition in an increasingly demanding pharmaceutical landscape.

The journey toward quality excellence is not merely technical but cultural and organizational. It requires systematic approaches, appropriate metrics, and balanced objectives that recognize quality not as an end in itself but as a means to deliver value to patients, practitioners, and the business. The X-Matrix provides the framework needed to navigate this journey successfully, translating quality vision into tangible results that advance both organizational performance and patient outcomes.

By adopting the X-Matrix approach to quality planning, organizations can ensure that their quality initiatives are not isolated efforts but components of a coherent strategy that addresses current challenges while building the foundation for future excellence. In a world of increasing complexity and rising expectations, this structured yet flexible approach to quality planning may well be the difference between merely complying and truly excelling.

Pareto – A Tool Often Abused

The Pareto Principle, commonly known as the 80/20 rule, has been a cornerstone of efficiency strategies for over a century. While its applications span industries—from business optimization to personal productivity—its limitations often go unaddressed. Below, we explore its historical roots, inherent flaws, and strategies to mitigate its pitfalls while identifying scenarios where alternative tools may yield better results.

From Wealth Distribution to Quality Control

Vilfredo Pareto, an Italian economist and sociologist (1848–1923), observed that 80% of Italy’s wealth was concentrated among 20% of its population. This “vital few vs. trivial many” concept later caught the attention of Joseph M. Juran, a pioneer in statistical quality control. Juran rebranded the principle as the Pareto Principle to describe how a minority of causes drive most effects in quality management, though he later acknowledged the misattribution to Pareto. Despite this, the 80/20 rule became synonymous with prioritization, emphasizing that focusing on the “vital few” could resolve the majority of problems.

Since then the 80/20 rule, or Pareto Principle, has become a dominant framework in business thinking due to its ability to streamline decision-making and resource allocation. It emphasizes that 80% of outcomes—such as revenue, profits, or productivity—are often driven by just 20% of inputs, whether customers, products, or processes. This principle encourages businesses to prioritize their “vital few” contributors, such as top-performing products or high-value clients, while minimizing attention on the “trivial many”. By focusing on high-impact areas, businesses can enhance efficiency, reduce waste, and achieve disproportionate results with limited effort. However, this approach also requires ongoing analysis to ensure priorities remain aligned with evolving market dynamics and organizational goals.

Key Deficiencies of the Pareto Principle

1. Oversimplification and Loss of Nuance

Pareto analysis condenses complex data into a ranked hierarchy, often stripping away critical context. For example:

  • Frequency ≠ Severity: Prioritizing frequent but low-impact issues (e.g., minor customer complaints) over rare, catastrophic ones (e.g., supply chain breakdowns) can misdirect resources.
  • Static and Historical Bias: Reliance on past data ignores evolving variables, such as supplier price spikes or regulatory changes, leading to outdated conclusions.

2. Misguided Assumption of 80/20 Universality

The 80/20 ratio is an approximation, not a law. In practice, distributions vary:

  • A single raw material shortage might account for 90% of production delays in pharmaceutical manufacturing, rendering the 80/20 framework irrelevant.
  • Complex systems with interdependent variables (e.g., manufacturing defects) often defy simple categorization.

3. Neglect of Qualitative and Long-Term Factors

Pareto’s quantitative focus overlooks:

  • Relationship-building, innovation, or employee morale, which can be hard to quantify into immediate metrics but drive long-term success.
  • Ethical equity: Pareto improvements (e.g., favoring one demographic without harming another) ignore fairness, risking inequitable outcomes.

4. Inability to Analyze Multivariate Problems

Pareto charts struggle with interconnected issues, such as:

  • Cascade failures within a system, such as a bioreactor
  • Cybersecurity threats requiring dynamic, layered solutions beyond frequency-based prioritization.
I made this up to prove a point

Mitigating Pareto’s Pitfalls

Combine with Complementary Tools

  • Root Cause Analysis (RCA): Use the Why-Why to drill into Pareto-identified issues. For instance, if machine malfunctions dominate defect logs, ask: Why do seals wear out?Lack of preventive maintenance.
  • Fishbone Diagrams: Map multifaceted causes (e.g., “man,” “machine,” “methods”) to contextualize Pareto’s “vital few”.
  • Scatter Plots: Test correlations between variables (e.g., material costs vs. production delays) to validate Pareto assumptions.

Validate Assumptions and Update Data

  • Regularly reassess whether the 80/20 distribution holds.
  • Integrate qualitative feedback (e.g., employee insights) to balance quantitative metrics.

Focus on Impact, Not Just Frequency

Weight issues by severity and strategic alignment. A rare but high-cost defect in manufacturing may warrant more attention than frequent, low-cost ones.

When to Redeem—or Replace—the Pareto Principle

Redeemable Scenarios

  • Initial Prioritization: Identify high-impact tasks
  • Resource Allocation: Streamline efforts in quality control or IT, provided distributions align with 80/20

When to Use Alternatives

ScenarioBetter ToolsExample Use Case
Complex interdependenciesFMEADiagnosing multifactorial supply chain failures
Dynamic environmentsPDCA Cycles, Scenario PlanningAdapting to post-tariff supply chain world
Ethical/equity concernsCost-Benefit Analysis, Stakeholder MappingCulture of Quality Issues

A Tool, Not a Framework

The Pareto Principle remains invaluable for prioritization but falters as a standalone solution. By pairing it with root cause analysis, ethical scrutiny, and adaptive frameworks, organizations can avoid its pitfalls. In complex, evolving, or equity-sensitive contexts, tools like Fishbone Diagrams or Scenario Planning offer deeper insights. As Juran himself implied, the “vital few” must be identified—and continually reassessed—through a lens of nuance and rigor.

How Many M’s Again

Among the most enduring tools of root cause analysis are the M-based frameworks, which categorize contributing factors to problems using mnemonic classifications. These frameworks have evolved significantly over decades, expanding from the foundational 4M Analysis to more comprehensive models like 5M, 6M, and even 8M. This progression reflects the growing complexity of industrial processes, the need for granular problem-solving, and the integration of human and systemic factors into quality control.

Origins of the 4M Framework

The 4M Analysis emerged in the mid-20th century as part of Japan’s post-war industrial resurgence. Developed by Kaoru Ishikawa, a pioneer in quality management, the framework was initially embedded within the Fishbone Diagram (Ishikawa Diagram), a visual tool for identifying causes of defects. The original four categories—Manpower, Machine, Material, and Method—provided a structured approach to dissecting production issues.

Key Components of 4M

  1. Manpower: Human factors such as training, skill gaps, and communication.
  2. Machine: Equipment reliability, maintenance, and technological limitations.
  3. Material: Quality and suitability of raw materials or components.
  4. Method: Procedural inefficiencies, outdated workflows, or unclear standards.

This framework became integral to Total Productive Maintenance (TPM) and lean manufacturing, where it was used to systematically reduce variation and defects.

However, the 4M model had limitations. It often overlooked external environmental factors and measurement systems, which became critical as industries adopted stricter quality benchmarks.

Expansion to 5M and 5M+E

To address these gaps, the 5M Model introduced Measurement as a fifth category, recognizing that inaccurate data collection or calibration errors could skew process outcomes. For instance, in pharmaceutical production, deviations in process weight might stem from faulty scales (Measurement) rather than the raw materials themselves.

Concurrently, the 5M+E variant added Environment (or Milieu) to account for external conditions such as temperature, humidity, or regulatory changes. This was particularly relevant in industries like food processing, where storage conditions directly impact product safety. The 5M+E framework thus became a staple in sectors requiring rigorous environmental controls.

The Rise of 6M and Specialized Variations

The 6M model addresses gaps in earlier iterations like the 4M framework by formalizing measurement and environmental factors as core variables. For instance, while the original 4M (Man, Machine, Material, Method) focused on internal production factors, the expanded 6M accounts for external influences like regulatory changes (Milieu) and data integrity (Measurement). This aligns with modern quality standards such as ISO 9001:2015, which emphasizes context-aware management systems.

Other versions of 6M Model further expanded the framework by incorporating Mother Nature (environmental factors) or Maintenance, depending on the industry. In agriculture, for instance, crop yield variations could be linked to drought (Mother Nature), while in manufacturing, machine downtime might trace to poor maintenance schedules.

6M model
M FactorDescriptionKey Insights
ManpowerHuman resources involved in processes, including skills, training, and communication– Skill gaps or inadequate training directly impact error rates
– Poor communication hierarchies exacerbate operational inefficiencies
– Workforce diversity and engagement improve problem-solving agility
MethodProcedures, workflows, and protocols governing operations– Outdated methods create bottlenecks
– Overly rigid procedures stifle innovation
– Standardized workflows reduce process variation by 30-50%
MachineEquipment, tools, and technological infrastructure– Uncalibrated machinery accounts for 23% of manufacturing defects
– Predictive maintenance reduces downtime by 40%
– Aging equipment increases energy costs by 15-20%
MaterialRaw inputs, components, and consumables– Supplier quality variances cause 18% of production rework
– Material traceability systems reduce recall risks by 65%
MilieuEnvironmental conditions (temperature, humidity, regulatory landscape)– Temperature fluctuations alter material properties in 37% of pharma cases
– OSHA compliance reduces workplace accidents by 52%
– Climate-controlled storage extends food product shelf life by 30%
MeasurementData collection systems, metrics, and calibration processes– Uncalibrated sensors create 12% margin of error in aerospace measurements
– Real-time data analytics improve defect detection rates by 44%
– KPIs aligned with strategic goals increase operational transparency

Industry-Specific Adaptations

  • Healthcare: Adapted 6Ms include Medication, Metrics, and Milieu to address patient safety.
  • Software Development: Categories like Markets and Money are added to analyze project failures.
  • Finance: 5M+P (People, Process, Platform, Partners, Profit) shifts focus to operational and market risks.

These adaptations highlight the framework’s flexibility.

Beyond 6M: 8M and Hybrid Models

In complex systems, some organizations adopt 8M Models, adding Management and Mission to address leadership and strategic alignment. The original 5M framework already included these elements, but their revival underscores the importance of organizational culture in problem-solving. For example, the 4M4(5)E model used in maritime safety analyzes accidents through Man, Machine, Media, Management, Education, Engineering, Enforcement, Example, and Environment.

Integration with RCA Tools

The M frameworks should never be used in isolation. They complement tools like:

  • Why-Whys: Drills down into each M category to uncover root causes.
  • Fishbone Diagrams: Visualizes interactions between Ms31015.
  • FMEA (Failure Mode Effects Analysis): Prioritizes risks within each M.

Contemporary Applications and Challenges

Modern iterations of M frameworks emphasize inclusivity and adaptability. The 5M+P model replaces “Man” with “People” to reflect diverse workforces, while AI-driven factories integrate Machine Learning as a new M. However, challenges persist:

  • Overcomplication: Adding too many categories can dilute focus.
  • Subjectivity: Teams may prioritize familiar Ms over less obvious factors.
  • Dynamic Environments: Rapid technological change necessitates continual framework updates.

Conclusion

The evolution from 4M to 6M and beyond illustrates the iterative nature of quality management. Each expansion reflects deeper insights into how people, processes, and environments interact to create—or resolve—operational challenges. These frameworks will continue to adapt, offering structured yet flexible approaches to root cause analysis. Organizations that master their application will not only solve problems more effectively but also foster cultures of continuous improvement and innovation.

Process Mapping as a Scaling Solution (part 2)

Continuing our look a process mapping tools.

Process Flow Diagram

A process flow diagram is a visual representation of the steps in a process, showing the sequence of activities from start to finish. Using simple shapes and arrows, it maps out how work flows through your system, highlighting decision points, inputs, outputs, and the relationships between different steps. When most people think process map they really mean process flow.

When to Use Process Flow Diagrams

Process flow diagrams shine in various scenarios:

  1. Analyzing existing processes: They help identify inefficiencies, bottlenecks, and redundancies in current workflows.
  2. Designing new processes: When creating new procedures, flow diagrams provide a clear blueprint for implementation.
  3. Training and onboarding: They serve as excellent visual aids for explaining processes to new team members.
  4. Continuous improvement initiatives: Flow diagrams facilitate discussions about potential enhancements and streamlining opportunities.
  5. Compliance and auditing: They offer a standardized way to document processes for regulatory purposes.

Creating Effective Process Flow Diagrams

To make the most of your diagrams:

  1. Start with the big picture: Begin by outlining the major steps before diving into details.
  2. Use standard symbols: Stick to commonly recognized shapes (e.g., rectangles for activities, diamonds for decisions) to ensure clarity.
  3. Keep it simple: Avoid cluttering your diagram with too much information. Focus on the key steps and decision points.
  4. Involve the right people: Collaborate with those who actually perform the process to ensure accuracy.
  5. Review and refine: Regularly update your diagrams as processes evolve.

Benefits of Using Process Flow Diagrams

Process flow diagrams are truly one of the core quality tools. With them we can:

  • Improve communication: They provide a common visual language for discussing processes across teams.
  • Enhance efficiency: By clearly mapping out steps, you can more easily identify areas for optimization.
  • Better decision-making: Flow diagrams help managers understand the implications of process changes.
  • Increase standardization: They promote consistency in how tasks are performed across the organization.

Process flow diagrams are more than just pretty pictures – they’re powerful tools for understanding, improving, and communicating about your business processes. By incorporating them into your workflow analysis and design efforts, you’ll be taking a significant step towards operational excellence.

This is the level of process mapping that usually sits at the heart of the SOP.

Swim-Lane Flowchart

A swim lane flowchart, also known as a swim lane diagram or cross-functional flowchart, is a visual representation of a process that separates activities into distinct lanes. Each lane typically represents a different department, team, or individual responsible for a set of actions within the process.

Key Benefits of Swim Lane Flowcharts

  1. Clear Responsibility Assignment: By dividing the process into lanes, it’s immediately clear which team or individual is responsible for each step.
  2. Improved Communication: These diagrams provide a common visual language for discussing processes across departments.
  3. Identify Handoffs and Bottlenecks: Easily spot where work passes between teams and where delays might occur.
  4. Process Optimization: Visualizing the entire process helps identify redundancies and opportunities for streamlining.
  5. Onboarding and Training: New team members can quickly grasp complex processes and their role within them.

Creating an Effective Swim Lane Flowchart

To make the most of this tool:

  1. Define the Process Scope: Clearly identify the start and end points of the process you’re mapping.
  2. Identify Participants: Determine which departments or roles will have their own lanes.
  3. Map the Process: Use standard flowchart symbols to represent steps, decisions, and document flows.
  4. Show Handoffs: Clearly indicate where work passes from one lane to another.
  5. Review and Refine: Collaborate with stakeholders to ensure accuracy and identify improvement opportunities.

Data Maps are an example of a swim lane flow chart.

Process Flow with RACI Matrix

Here’s a blog post on process flow with RACI matrix:

Mastering Process Management: Combining Process Flow with RACI Matrix

This tool merges two powerful tools stand out for their ability to clarify complex workflows: the process flow diagram and the RACI matrix. When combined, these tools create a comprehensive view of not just how a process unfolds, but also who’s involved at each step. Let’s dive into this dynamic duo and explore how they can revolutionize your process management.

  • Process Flow Diagram: This visual representation maps out the sequence of steps in a process, showing how work progresses from start to finish.
  • RACI Matrix: This responsibility assignment chart clarifies the roles people play in each process step:
    • Responsible: Who does the work?
    • Accountable: Who makes the final decisions?
    • Consulted: Who provides input?
    • Informed: Who needs to be kept in the loop?

When you combine a process flow with a RACI matrix, you create a comprehensive view of your process that answers two critical questions:

  1. What happens in the process?
  2. Who’s involved at each step?

This integration strives to provide clarity of roles. It becomes immediately clear who’s responsible for each step, reducing confusion and improving accountability. Team members can easily see where they fit into the larger process and who they need to interact with. This should hopefully help balance resources and streamline decision-making. It is a great tool for training.

Creating Your Integrated Diagram

To build your process flow with RACI matrix:

  1. Start with Your Process Flow: Map out the steps of your process using standard flowchart symbols.
  2. Add RACI Information: For each step, indicate the R, A, C, and I roles. This can be done through color-coding, symbols, or additional columns next to each step.
  3. Review and Refine: Collaborate with stakeholders to ensure the diagram accurately reflects both the process and the roles involved.
  4. Use It: Implement the diagram in your operations, referring to it for training, process improvement, and day-to-day management.

Example

Imagine a verification process:

  1. Requirements Gathering (R: Business Analyst, A: Molecule Steward, C: Quality, Engineers, Operations)
  2. Design (R: Engineer, A: Molecule Steward, I: Validation)
  3. Verification (R: Validation A: Quality, C: Engineers, I: Molecule Steward)
  4. Deployment (R: Operations, A: Molecule Steward C: Quality, I: All Stakeholders)

Integrating process flows with RACI matrices creates a powerful tool for process management. It not only shows how work gets done but also clarifies who’s involved every step of the way. This comprehensive view can lead to more efficient operations, clearer communication, and ultimately, better business outcomes.

Value Stream Map

Value Stream Mapping (CSM) is a process mapping technique used to analyze, design, and manage the flow of materials and information required to bring a product or service to a customer. It is a visual representation of every step in your process, from the initial order to the final delivery of the product or service.

Coming out of Lean and organization excellence the value stream map is all about identifying waste: VSM helps you spot non-value-adding activities in your processes, allowing you to eliminate them and improve efficiency.

How to Create a Value Stream Map

  1. Create a Current State Map: Document your process as it currently exists, including material and information flows.
  2. Analyze the Current State: Identify areas of waste and inefficiency in your current process.
  3. Design a Future State Map: Envision an improved process that eliminates the identified waste.
  4. Implement Changes: Develop and execute a plan to move from the current state to the future state.
  5. Review and Iterate: Continuously monitor your new process and make further improvements as needed.

Best Practices for Value Stream Mapping

  1. Involve Cross-Functional Teams: Ensure representatives from all relevant departments participate in the mapping process.
  2. Focus on the Customer: Always keep the end customer’s needs in mind when analyzing and improving your processes.
  3. Use Standard Symbols: Adopt a consistent set of symbols to represent different elements of your value stream.
  4. Walk the Process: Physically follow the flow of materials and information to gain a firsthand understanding of your processes.
  5. Measure Key Metrics: Collect data on important metrics like cycle time, lead time, and inventory levels to quantify improvements.

Process Mapping as a Scaling Solution (part 1)

I love a good process map in all it’s permutations. It is important to remember that the various process mapping tools are on a scale on order of detail and complexity.

Tool NameDescription
Process Landscape DiagramA Process Landscape Diagram is a visual representation that outlines the structure and interdependencies of processes within an organization, providing insight into how these processes work together to achieve strategic goals. This tool helps in understanding process flows and managing business operations more effectively by illustrating connections and hierarchies among various processes.
SIPOCSIPOC is a visual representation tool for documenting a business process from beginning to end. It provides a high-level overview by summarizing the key components of Suppliers, Inputs, Processes, Outputs, and Customers.
Scope Diagram (IGOE Diagram)
The Scope Diagram, also known as the IGOE Diagram, is used to define and agree on the boundaries of a process, enhancing communication among stakeholders. This diagram illustrates the scope of a project at a high abstraction level and helps identify candidate processes for change. It focuses on the Inputs, Guides, Outputs, and Enablers of a business process, facilitating better understanding and management of the scope by clarifying process boundaries without detailing internal system features.
Process MapA Process Map is a visual tool used to represent the flow of work and the steps involved in a business process. This tool helps teams understand, analyze, and improve workflows by detailing the processes involved, making it easier to identify inefficiencies and areas for improvement. Process maps are often utilized in project management and continuous improvement efforts to enhance productivity and streamline operations.
Process Flow DiagramA Process Flow Diagram (PFD) is a diagram commonly used to indicate the general flow of plant processes and equipment. It visualizes the sequential steps and relationships between components in a process, aiming to improve project planning and identify inefficiencies.
Swim-lane Flow ChartA Swim-lane Flow Chart, also known as a cross-functional diagram, is a type of flowchart that shows the workflow and responsibilities in a process. It visually segments tasks into lanes that clarify who is responsible for each step, making it easier to understand complex processes and identify inefficiencies or redundancies.
Process Flow with RACI matrixThe RACI matrix is a project management tool that clarifies roles and responsibilities of team members by categorizing them into four groups: Responsible, Accountable, Consulted, and Informed. This structure aids in ensuring effective communication and workflow management across various stages of a project, helping teams stay aligned and avoiding confusion.
Process Mapping Tools

Process Landscape Diagram

A process landscape diagram is a high-level visual representation of an organization’s business processes and their relationships. Process landscape diagrams provide a comprehensive overview of an organization’s processes at a macro level and define the scope and relationships between an organization’s business processes. This serves as a simple way to handle process-related communication and serves as a starting point for detailed process discovery.

The process landscape diagram represents processes as ‘black-boxes’, focusing on interrelationships rather than internal details. Thus it shows the structure, grouping, modularity, functionality, and technology of chain processes, business processes, and working processes. Ideally this should include connections to external participants or stakeholders.

Components and Structure

A typical process landscape diagram may include:

  • Core processes (value chain or end-to-end processes)
  • Management processes
  • Support processes
  • Relationships and dependencies between processes
  • Connections to external participants or stakeholders

When to do

The process landscape diagram is design to enable organizations to maintain an overview of processes which makes this an excellent centerpiece to your Quality Manual.

ICH Q10 actually has a nice process landscape in it.

SIPOC

I’ve written about SIPOC’s in the past.

SIPOC diagrams are powerful tools in process improvement and management, offering numerous advantages that make them invaluable in various scenarios. These diagrams provide a high-level overview of a process, enabling teams to grasp the big picture quickly and efficiently. By facilitating clear communication and collaboration among team members and stakeholders, SIPOC diagrams help break down silos and foster a shared understanding of complex processes. This clarity often leads to the identification of improvement opportunities and potential problem areas that might otherwise go unnoticed.

One of the key strengths of SIPOC diagrams lies in their versatility. They serve as excellent tools for defining and scoping complex projects, helping teams to set clear boundaries and objectives from the outset. Additionally, these diagrams aid in understanding customer requirements and managing supplier relationships, two critical aspects of any business process. SIPOC diagrams also prove invaluable as training tools for new employees, offering a concise yet comprehensive overview of how a process functions within the larger organizational context.

The use of SIPOC diagrams is particularly beneficial when embarking on new process improvement projects or redesigning existing processes by providing a structured approach to understanding the current state and envisioning future improvements. They’re also extremely useful in situations where the scope of a project is unclear or poorly defined, helping to bring clarity and focus to the team’s efforts.

SIPOC diagrams excel in fostering cross-functional collaboration. By providing a common language and visual representation of a process, they facilitate discussions and decision-making among different departments or stakeholders. This makes them particularly valuable in problem-solving initiatives and when ensuring compliance with regulations and standards. SIPOC diagrams also serve as effective tools for supplier evaluation and performance assessment, helping organizations maintain strong relationships with their supply chain partners.

SIPOC diagrams are most effective when there’s a need to quickly visualize and understand a process without delving into excessive detail. They help teams focus on the essential elements of a process and provide a solid foundation for more in-depth analysis and improvement efforts. Whether used in the early stages of a project, for ongoing process management, or as part of continuous improvement initiatives, SIPOC diagrams offer a simple yet powerful way to enhance understanding, communication, and efficiency across an organization.

I love a SIPOC in a program level document.

Scope Diagram (IGOE Diagram)

IGOE stands for Inputs-Guides-Outputs-Enablers, the basic components of any business process. This model is used to define the scope of a process with an initial, high-level overview of the process in-scope and the problems associated with that process and the relationships between the process-in-scope, upstream or downstream processes, relevant documents, stakeholders etc.

Scope Diagram- IGOE
  • Input is defined as something that is transformed or consumed, input can be information, materials, people
  • Guide is defined as anything that describes the when, why, or how a process or activity occurs, guides can be policies, strategies, regulations, law
  • Outputs are the product or result of the change that occurs to the Inputs or the result of the creation of something based on the Guides, outputs can be results, deliverables, products, information, people
  • Enablers are the resources or assets required to transform an Input into an Output or to create Outputs, enablers can be systems, equipment, tools, assets, facilities, human resources

These diagrams are particularly useful at the outset of a process improvement project, serving as a powerful means to define and agree upon the boundaries of a process. By clearly illustrating the process scope and interactions, IGOE diagrams play a crucial role in setting the right expectations among project stakeholders and establishing a solid foundation for the improvement effort.

One of the key strengths of IGOE diagrams lies in their ability to measure the reach of a process. By explicitly showing how the business interacts with external entities, these diagrams provide a systematic way to assess impact. This can really help identify stakeholders in a project.

Process owners and subject matter experts often turn to IGOE diagrams for high-level root cause analysis. This application allows them to conduct a relatively accurate assessment to determine the focus and scope of an improvement project.

Scope diagrams excel in enhancing communication with various stakeholders. Their intuitive nature and lack of technical jargon make them accessible to a wide audience, facilitating better understanding and alignment among team members and stakeholders. This clarity in communication is particularly beneficial when defining vision and building consensus.

Another significant advantage of scope diagrams is their ability to illustrate process dependencies. By providing a clear picture of the factors that shape processes, these diagrams create a better understanding of potential future process iterations. This insight is invaluable during task prioritization, as the additional information about importance and impact can guide strategic decision-making in the project.

Scope diagrams are most effective in communicating a comprehensive understanding of a process’s scope, boundaries, and interactions with its environment. Whether used at the beginning of an improvement initiative, for aligning stakeholders on process scope and impact, or as a precursor to more detailed process analysis, IGOE diagrams offer a structured and insightful approach to process understanding and improvement planning.

This is a tool we don’t use enough.

Process Map

Process maps are powerful visual tools that provide a clear and comprehensive representation of workflows or processes within an organization. These diagrams illustrate the sequence of steps, activities, and decisions involved in completing a task or achieving a specific outcome. By offering a visual overview of how a process works from start to finish, process maps serve multiple purposes, including identifying inefficiencies and bottlenecks, facilitating communication among team members and stakeholders, and serving as valuable training resources for new employees.

The versatility of process maps makes them indispensable in various business scenarios. At the outset of process improvement projects, these visual aids help teams gain a thorough understanding of the current state of a process before embarking on optimization or redesign efforts. They are particularly useful when defining project scope, as they assist in setting clear boundaries and expectations for process improvement initiatives. For complex processes, maps break down intricate workflows into more manageable, understandable steps, making them easier to analyze and improve.

Process maps excel as communication tools, proving invaluable during team brainstorming sessions by providing a visual aid for discussing and analyzing processes. They also serve as effective training resources for new hires, offering a clear, step-by-step guide to understanding roles and responsibilities within the organization. When documenting standard operating procedures, process maps complement written instructions, enhancing clarity and comprehension.

In problem-solving scenarios, process maps are instrumental in identifying the root causes of issues within a workflow. They allow teams to examine each step of a process for efficiency and effectiveness during process analysis, leading to more targeted improvements. Furthermore, process maps provide a concise way to explain processes to stakeholders who may not be directly involved in day-to-day operations, fostering better understanding and alignment across the organization.

When implementing new systems or technologies, process maps help identify how these tools will impact existing workflows, facilitating smoother transitions and integration. This makes them particularly valuable in organizations focused on continuous improvement, quality management, and operational efficiency.

Process maps are versatile tools that can be employed whenever there’s a need to understand, analyze, improve, or communicate about a process. Their visual nature makes complex information more accessible, promoting better decision-making and more effective process management. Whether used in small-scale departmental improvements or large-scale organizational transformations, process maps remain a fundamental tool in the arsenal of business process management and continuous improvement methodologies.

In my next post in this series I will start with Business Process Notation as a methodology for process mapping.