Understanding how to measure success and risk is critical for organizations aiming to achieve strategic objectives. As we develop Quality Plans and Metric Plans it is important to explore the nuances of leading and lagging metrics, define Key Performance Indicators (KPIs), Key Behavioral Indicators (KBIs), and Key Risk Indicators (KRIs), and explains how these concepts intersect with Objectives and Key Results (OKRs).
Leading vs. Lagging Metrics: A Foundation
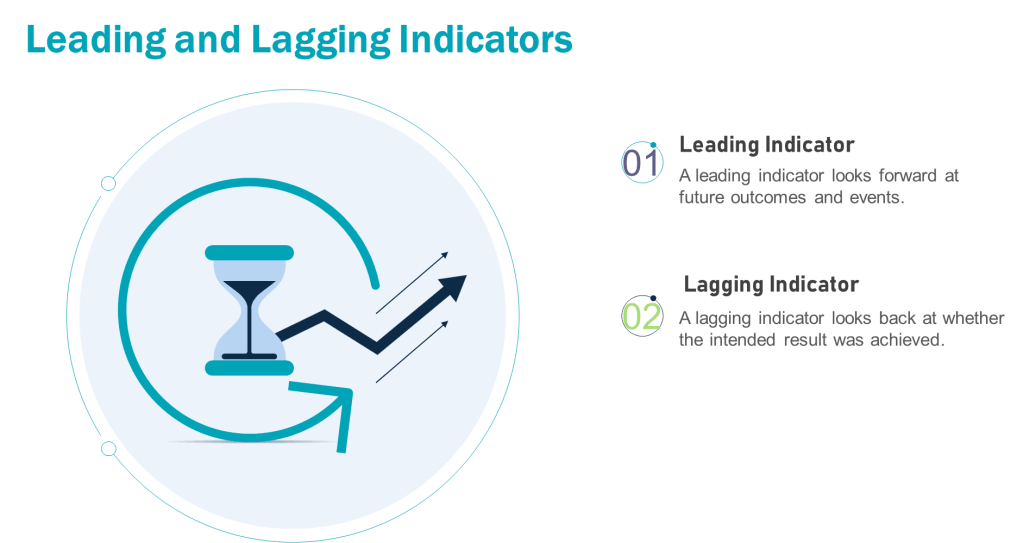
Leading metrics predict future outcomes by measuring activities that drive results. They are proactive, forward-looking, and enable real-time adjustments. For example, tracking employee training completion rates (leading) can predict fewer operational errors.
Lagging metrics reflect historical performance, confirming whether quality objectives were achieved. They are reactive and often tied to outcomes like batch rejection rates or the number of product recalls. For example, in a pharmaceutical quality system, lagging metrics might include the annual number of regulatory observations, the percentage of batches released on time, or the rate of customer complaints related to product quality. These metrics provide a retrospective view of the quality system’s effectiveness, allowing organizations to assess their performance against predetermined quality goals and industry standards. They offer limited opportunities for mid-course corrections
The interplay between leading and lagging metrics ensures organizations balance anticipation of future performance with accountability for past results.
Defining KPIs, KRIs, and KBIs
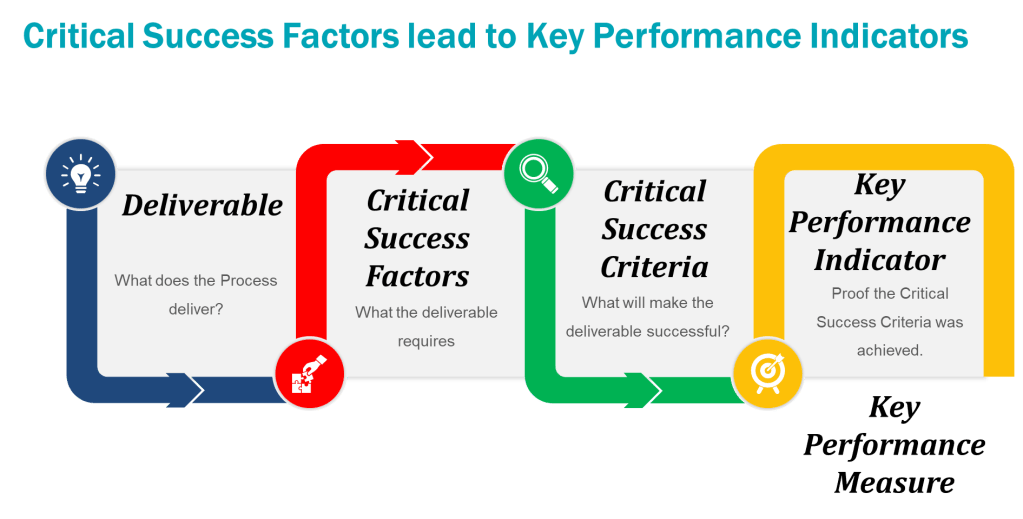
Key Performance Indicators (KPIs)
KPIs measure progress toward Quality System goals. They are outcome-focused and often tied to strategic objectives.
- Leading KPI Example: Process Capability Index (Cpk) – This measures how well a process can produce output within specification limits. A higher Cpk could indicate fewer products requiring disposition.
- Lagging KPI Example: Cost of Poor Quality (COPQ) -The total cost associated with products that don’t meet quality standards, including testing and disposition cost.
Key Risk Indicators (KRIs)
KRIs monitor risks that could derail objectives. They act as early warning systems for potential threats. Leading KRIs should trigger risk assessments and/or pre-defined corrections when thresholds are breached.
- Leading KRI Example: Unresolved CAPAs (Corrective and Preventive Actions) – Tracks open corrective actions for past deviations. A rising number signals unresolved systemic issues that could lead to recurrence
- Lagging KRI Example: Repeat Deviation Frequency – Tracks recurring deviations of the same type. Highlights ineffective CAPAs or systemic weaknesses
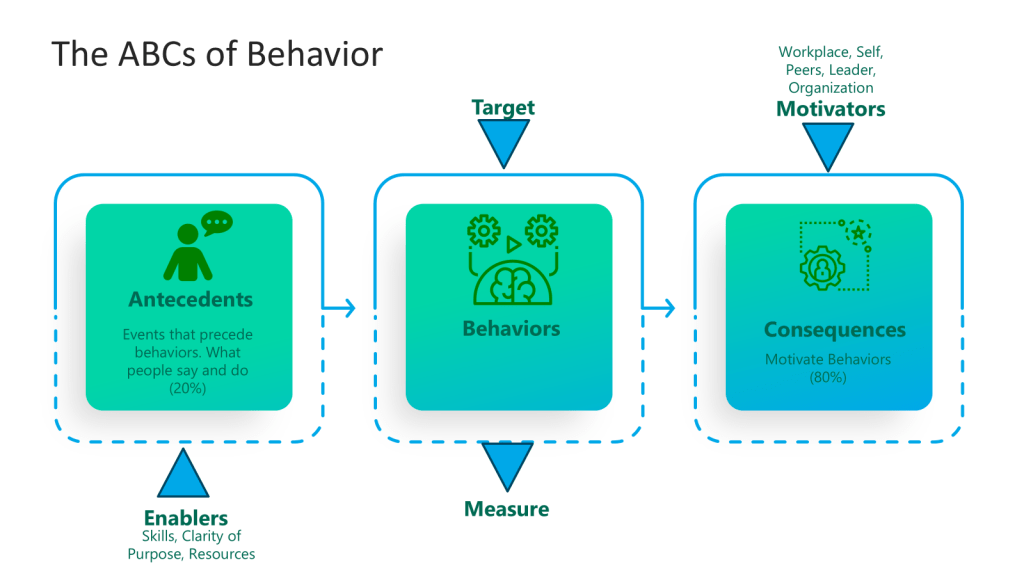
Key Behavioral Indicators (KBIs)
KBIs track employee actions and cultural alignment. They link behaviors to Quality System outcomes.
- Leading KBI Example: Frequency of safety protocol adherence (predicts fewer workplace accidents).
- Lagging KBI Example: Employee turnover rate (reflects past cultural challenges).
Applying Leading and Lagging Metrics to KPIs, KRIs, and KBIs
Each metric type can be mapped to leading or lagging dimensions:
- KPIs: Leading KPIs drive action while lagging KPIs validate results
- KRIs: Leading KRIs identify emerging risks while lagging KRIs analyze past incidents
- KBIs: Leading KBIs encourage desired behaviors while lagging KBIs assess outcomes
Oversight Framework for the Validated State
An example of applying this for the FUSE(P) program.
| Category | Metric Type | FDA-Aligned Example | Purpose | Data Source |
|---|---|---|---|---|
| KPI | Leading | % completion of Stage 3 CPV protocols | Proactively ensures continued process verification aligns with validation master plans | Validation tracking systems |
| Lagging | Annual audit findings related to validation drift | Confirms adherence to regulator’s “state of control” requirements | Internal/regulatory audit reports | |
| KRI | Leading | Open CAPAs linked to FUSe(P) validation gaps | Identifies unresolved systemic risks affecting process robustness | Quality management systems (QMS) |
| Lagging | Repeat deviations in validated batches | Reflects failure to address root causes post-validation | Deviation management systems | |
| KBI | Leading | Cross-functional review of process monitoring trends | Encourages proactive behavior to maintain validation state | Meeting minutes, action logs |
| Lagging | Reduction in human errors during requalification | Validates effectiveness of training/behavioral controls | Training records, deviation reports |
This framework operationalizes a focus on data-driven, science-based programs while closing gaps cited in recent Warning Letters.
Goals vs. OKRs: Alignment with Metrics
Goals are broad, aspirational targets (e.g., “Improve product quality”). OKRs (Objectives and Key Results) break goals into actionable, measurable components:
- Objective: Reduce manufacturing defects.
- Key Results:
- Decrease batch rejection rate from 5% to 2% (lagging KPI).
- Train 100% of production staff on updated protocols by Q2 (leading KPI).
- Reduce repeat deviations by 30% (lagging KRI).
KPIs, KRIs, and KBIs operationalize OKRs by quantifying progress and risks. For instance, a leading KRI like “number of open CAPAs” (Corrective and Preventive Actions) informs whether the OKR to reduce defects is on track.
More Pharmaceutical Quality System Examples
Leading Metrics
- KPI: Percentage of staff completing GMP training (predicts adherence to quality standards).
- KRI: Number of unresolved deviations in the CAPA system (predicts compliance risks).
- KBI: Daily equipment calibration checks (predicts fewer production errors).
Lagging Metrics
- KPI: Batch rejection rate due to contamination (confirms quality failures).
- KRI: Regulatory audit findings (reflects past non-compliance).
- KBI: Employee turnover in quality assurance roles (indicates cultural or procedural issues).
| Metric Type | Purpose | Leading Example | Lagging Example |
|---|---|---|---|
| KPI | Measure performance outcomes | Training completion rate | Quarterly profit margin |
| KRI | Monitor risks | Open CAPAs | Regulatory violations |
| KBI | Track employee behaviors | Safety protocol adherence frequency | Employee turnover rate |
Building Effective Metrics
- Align with Strategy: Ensure metrics tie to Quality System goals. For OKRs, select KPIs/KRIs that directly map to key results.
- Balance Leading and Lagging: Use leading indicators to drive proactive adjustments and lagging indicators to validate outcomes.
- Pharmaceutical Focus: In quality systems, prioritize metrics like right-first-time rate (leading KPI) and repeat deviation rate (lagging KRI) to balance prevention and accountability.
By integrating KPIs, KRIs, and KBIs into OKRs, organizations create a feedback loop that connects daily actions to long-term success while mitigating risks. This approach transforms abstract goals into measurable, actionable pathways—a critical advantage in regulated industries like pharmaceuticals.
Understanding these distinctions empowers teams to not only track performance but also shape it proactively, ensuring alignment with both immediate priorities and strategic vision.