Facility-Driven Bacterial Endotoxin Control Strategies

The pharmaceutical industry stands at an inflection point in microbial control, with bacterial endotoxin management undergoing a profound transformation. For decades, compliance focused on meeting pharmacopeial limits at product release—notably the 5.0 EU/kg threshold for parenterals mandated by standards like Ph. Eur. 5.1.10. While these endotoxin specifications remain enshrined as Critical Quality Attributes (CQAs), regulators now demand a fundamental reimagining of control strategies that transcends product specifications.

This shift reflects growing recognition that endotoxin contamination is fundamentally a facility-driven risk rather than a product-specific property. Health Authorities increasingly expect manufacturers to implement preventive, facility-wide control strategies anchored in quantitative risk modeling, rather than relying on end-product testing.

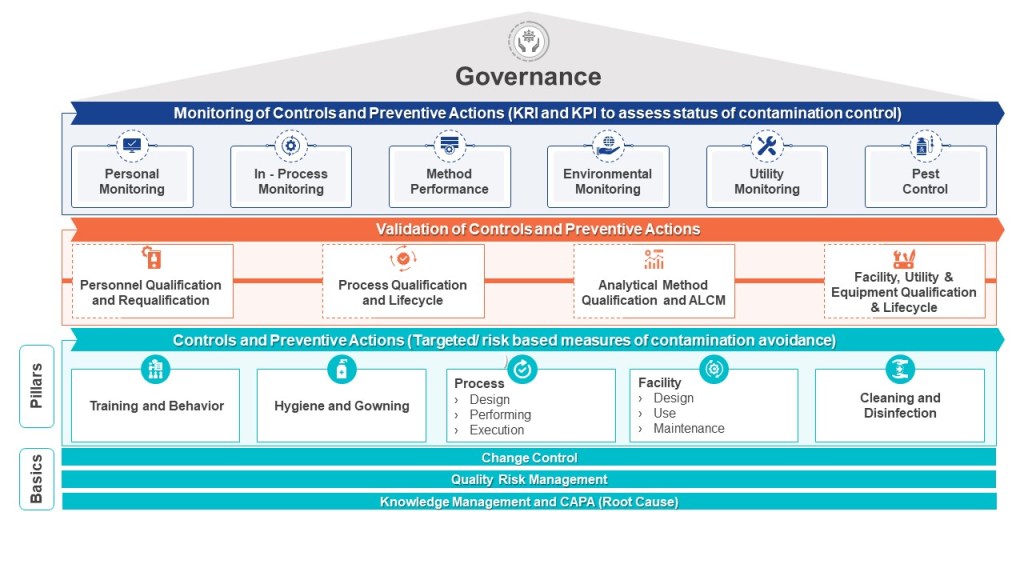
The EU Annex 1 Contamination Control Strategy (CCS) framework crystallizes this evolution, requiring cross-functional systems that integrate:

  • Process design capable of achieving ≥3 log10 endotoxin reduction (LRV) with statistical confidence (p<0.01)
  • Real-time monitoring of critical utilities like WFI and clean steam
  • Personnel flow controls to minimize bioburden ingress
  • Lifecycle validation of sterilization processes

Our organizations should be working to bridge the gap between compendial compliance and true contamination control—from implementing predictive analytics for endotoxin risk scoring to designing closed processing systems with inherent contamination barriers. We’ll examine why traditional quality-by-testing approaches are yielding to facility-driven quality-by-design strategies, and how leading organizations are leveraging computational fluid dynamics and risk-based control charts to stay ahead of regulatory expectations.

House of contamination control

Bacterial Endotoxins: Bridging Compendial Safety and Facility-Specific Risks

Bacterial endotoxins pose unique challenges as their control depends on facility infrastructure rather than process parameters alone. Unlike sterility assurance, which can be validated through autoclave cycles, endotoxin control requires continuous vigilance over water systems, HVAC performance, and material sourcing. The compendial limit of 5.0 EU/kg ensures pyrogen-free products, but HAs argue this threshold does not account for facility-wide contamination risks that could compromise multiple batches. For example, a 2023 EMA review found 62% of endotoxin-related recalls stemmed from biofilm breaches in water-for-injection (WFI) systems rather than product-specific failures.

Annex 1 addresses this through CCS requirements that mandate:

  • Facility-wide risk assessments identifying endotoxin ingress points (e.g., inadequate sanitization intervals for cleanroom surfaces)
  • Tiered control limits integrating compendial safety thresholds (specifications) with preventive action limits (in-process controls)
  • Lifecycle validation of sterilization processes, hold times, and monitoring systems

Annex 1’s Contamination Control Strategy: A Blueprint for Endotoxin Mitigation

Per Annex 1’s glossary, a CCS is “a planned set of controls […] derived from product and process understanding that assures process performance and product quality”. For endotoxins, this translates to 16 interrelated elements outlined in Annex 1’s Section 2.6, including:

  1. Water System Controls:
    • Validation of WFI biofilm prevention measures (turbulent flow >1.5 m/s, ozone sanitization cycles)
    • Real-time endotoxin monitoring using inline sensors (e.g., centrifugal microfluidics) complementing testing
  2. Closed Processing
  3. Material and Personnel Flow:
    • Gowning qualification programs assessing operator-borne endotoxin transfer
    • Raw material movement
  4. Environmental Monitoring:
    • Continuous viable particle monitoring in areas with critical operations with endotoxin correlation studies
    • Settle plate recovery validation accounting for desiccation effects on endotoxin-bearing particles

Risk Management Tools for Endotoxin Control

The revised Annex 1 mandates Quality Risk Management (QRM) per ICH Q9, requiring facilities to deploy appropriate risk management.

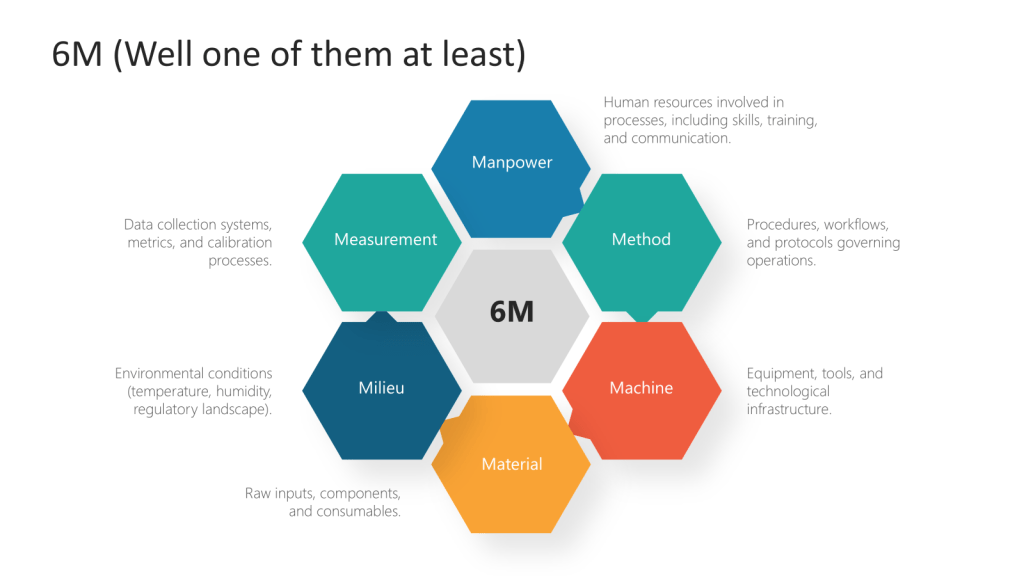
Hazard Analysis and Critical Control Points (HACCP) identifies critical control points (CCPs) where endotoxin ingress or proliferation could occur. For there a Failure Modes Effects and Criticality Analysis (FMECA) can further prioritizes risks based on severity, occurrence, and detectability.

Endotoxin-Specific FMECA (Failure Mode, Effects, and Criticality Analysis)

Failure ModeSeverity (S)Occurrence (O)Detectability (D)RPN (S×O×D)Mitigation
WFI biofilm formation5 (Product recall)3 (1/2 years)2 (Inline sensors)30Install ozone-resistant diaphragm valves
HVAC filter leakage4 (Grade C contamination)2 (1/5 years)4 (Weekly integrity tests)32HEPA filter replacement every 6 months
Simplified FMECA for endotoxin control (RPN thresholds: <15=Low, 15-50=Medium, >50=High)

Process Validation and Analytical Controls

As outlined in the FDA’s Process Validation: General Principles and Practices, PV is structured into three stages: process design, process qualification, and continued process verification (CPV). For bacterial endotoxin control, PV extends to validating sterilization processes, hold times, and water-for-injection (WFI) systems, where CPPs like sanitization frequency and turbulent flow rates are tightly controlled to prevent biofilm formation.

Analytical controls form the backbone of quality assurance, with method validation per ICH Q2(R1) ensuring accuracy, precision, and specificity for critical tests such as endotoxin quantification. The advent of rapid microbiological methods (RMM), including recombinant Factor C (rFC) assays, has reduced endotoxin testing timelines from hours to minutes, enabling near-real-time release of drug substances. These methods are integrated into continuous process verification programs, where action limits—set at 50% of the assay’s limit of quantitation (LOQ)—serve as early indicators of facility-wide contamination risks. For example, inline sensors in WFI systems or bioreactors provide continuous endotoxin data, which is trended alongside environmental monitoring results to preempt deviations. The USP <1220> lifecycle approach further mandates ongoing method performance verification, ensuring analytical procedures adapt to process changes or scale-up.

The integration of Process Analytical Technology (PAT) and Quality by Design (QbD) principles has transformed manufacturing by embedding real-time quality controls into the process itself. PAT tools such as Raman spectroscopy and centrifugal microfluidics enable on-line monitoring of product titers and impurity profiles, while multivariate data analysis (MVDA) correlates CPPs with CQAs to refine design spaces. Regulatory submissions now emphasize integrated control strategies that combine process validation data, analytical lifecycle management, and facility-wide contamination controls—aligning with EU GMP Annex 1’s mandate for holistic contamination control strategies (CCS). By harmonizing PV with advanced analytics, manufacturers can navigate HA expectations for tighter in-process limits while ensuring patient safety through compendial-aligned specifications.

Some examples may include:

1. Hold Time Validation

  • Microbial challenge studies using endotoxin-spiked samples (e.g., 10 EU/mL Burkholderia cepacia lysate)
  • Correlation between bioburden and endotoxin proliferation rates under varying temperatures

2. Rapid Microbiological Methods (RMM)

  • Comparative validation of recombinant Factor C (rFC) assays against LAL for in-process testing
  • 21 CFR Part 11-compliant data integration with CCS dashboards

3. Closed System Qualification

  • Extractable/leachable studies assessing endotoxin adsorption to single-use bioreactor films
  • Pressure decay testing with endotoxin indicators (Bacillus subtilis spores)

Harmonizing Compendial Limits with HA Expectations

To resolve regulator’s concerns about compendial limits being insufficiently preventive, a two-tier system aligns with Annex 1’s CCS principles:

ParameterRelease Specification (EU/kg)In-Process Action LimitRationale
Bulk Drug Substance5.0 (Ph. Eur. 5.1.10)1.0 (LOQ × 2)Detects WFI system drift
Excipient (Human serum albumin)0.25 (USP <85>)0.05 (50% LOQ)Prevents cumulative endotoxin load
Example tiered specifications for endotoxin control

Future Directions

Technology roadmaps should be driving adoption of:

  • AI-powered environmental monitoring: Machine learning models predicting endotoxin risks from particle counts
  • Single-use sensor networks: RFID-enabled endotoxin probes providing real-time CCS data
  • Advanced water system designs: Reverse osmosis (RO) and electrodeionization (EDI) systems with ≤0.001 EU/mL capability without distillation

Manufacturers can prioritize transforming endotoxin control from a compliance exercise into a strategic quality differentiator—ensuring patient safety while meeting HA expectations for preventive contamination management.

How Many M’s Again

Among the most enduring tools of root cause analysis are the M-based frameworks, which categorize contributing factors to problems using mnemonic classifications. These frameworks have evolved significantly over decades, expanding from the foundational 4M Analysis to more comprehensive models like 5M, 6M, and even 8M. This progression reflects the growing complexity of industrial processes, the need for granular problem-solving, and the integration of human and systemic factors into quality control.

Origins of the 4M Framework

The 4M Analysis emerged in the mid-20th century as part of Japan’s post-war industrial resurgence. Developed by Kaoru Ishikawa, a pioneer in quality management, the framework was initially embedded within the Fishbone Diagram (Ishikawa Diagram), a visual tool for identifying causes of defects. The original four categories—Manpower, Machine, Material, and Method—provided a structured approach to dissecting production issues.

Key Components of 4M

  1. Manpower: Human factors such as training, skill gaps, and communication.
  2. Machine: Equipment reliability, maintenance, and technological limitations.
  3. Material: Quality and suitability of raw materials or components.
  4. Method: Procedural inefficiencies, outdated workflows, or unclear standards.

This framework became integral to Total Productive Maintenance (TPM) and lean manufacturing, where it was used to systematically reduce variation and defects.

However, the 4M model had limitations. It often overlooked external environmental factors and measurement systems, which became critical as industries adopted stricter quality benchmarks.

Expansion to 5M and 5M+E

To address these gaps, the 5M Model introduced Measurement as a fifth category, recognizing that inaccurate data collection or calibration errors could skew process outcomes. For instance, in pharmaceutical production, deviations in process weight might stem from faulty scales (Measurement) rather than the raw materials themselves.

Concurrently, the 5M+E variant added Environment (or Milieu) to account for external conditions such as temperature, humidity, or regulatory changes. This was particularly relevant in industries like food processing, where storage conditions directly impact product safety. The 5M+E framework thus became a staple in sectors requiring rigorous environmental controls.

The Rise of 6M and Specialized Variations

The 6M model addresses gaps in earlier iterations like the 4M framework by formalizing measurement and environmental factors as core variables. For instance, while the original 4M (Man, Machine, Material, Method) focused on internal production factors, the expanded 6M accounts for external influences like regulatory changes (Milieu) and data integrity (Measurement). This aligns with modern quality standards such as ISO 9001:2015, which emphasizes context-aware management systems.

Other versions of 6M Model further expanded the framework by incorporating Mother Nature (environmental factors) or Maintenance, depending on the industry. In agriculture, for instance, crop yield variations could be linked to drought (Mother Nature), while in manufacturing, machine downtime might trace to poor maintenance schedules.

6M model
M FactorDescriptionKey Insights
ManpowerHuman resources involved in processes, including skills, training, and communication– Skill gaps or inadequate training directly impact error rates
– Poor communication hierarchies exacerbate operational inefficiencies
– Workforce diversity and engagement improve problem-solving agility
MethodProcedures, workflows, and protocols governing operations– Outdated methods create bottlenecks
– Overly rigid procedures stifle innovation
– Standardized workflows reduce process variation by 30-50%
MachineEquipment, tools, and technological infrastructure– Uncalibrated machinery accounts for 23% of manufacturing defects
– Predictive maintenance reduces downtime by 40%
– Aging equipment increases energy costs by 15-20%
MaterialRaw inputs, components, and consumables– Supplier quality variances cause 18% of production rework
– Material traceability systems reduce recall risks by 65%
MilieuEnvironmental conditions (temperature, humidity, regulatory landscape)– Temperature fluctuations alter material properties in 37% of pharma cases
– OSHA compliance reduces workplace accidents by 52%
– Climate-controlled storage extends food product shelf life by 30%
MeasurementData collection systems, metrics, and calibration processes– Uncalibrated sensors create 12% margin of error in aerospace measurements
– Real-time data analytics improve defect detection rates by 44%
– KPIs aligned with strategic goals increase operational transparency

Industry-Specific Adaptations

  • Healthcare: Adapted 6Ms include Medication, Metrics, and Milieu to address patient safety.
  • Software Development: Categories like Markets and Money are added to analyze project failures.
  • Finance: 5M+P (People, Process, Platform, Partners, Profit) shifts focus to operational and market risks.

These adaptations highlight the framework’s flexibility.

Beyond 6M: 8M and Hybrid Models

In complex systems, some organizations adopt 8M Models, adding Management and Mission to address leadership and strategic alignment. The original 5M framework already included these elements, but their revival underscores the importance of organizational culture in problem-solving. For example, the 4M4(5)E model used in maritime safety analyzes accidents through Man, Machine, Media, Management, Education, Engineering, Enforcement, Example, and Environment.

Integration with RCA Tools

The M frameworks should never be used in isolation. They complement tools like:

  • Why-Whys: Drills down into each M category to uncover root causes.
  • Fishbone Diagrams: Visualizes interactions between Ms31015.
  • FMEA (Failure Mode Effects Analysis): Prioritizes risks within each M.

Contemporary Applications and Challenges

Modern iterations of M frameworks emphasize inclusivity and adaptability. The 5M+P model replaces “Man” with “People” to reflect diverse workforces, while AI-driven factories integrate Machine Learning as a new M. However, challenges persist:

  • Overcomplication: Adding too many categories can dilute focus.
  • Subjectivity: Teams may prioritize familiar Ms over less obvious factors.
  • Dynamic Environments: Rapid technological change necessitates continual framework updates.

Conclusion

The evolution from 4M to 6M and beyond illustrates the iterative nature of quality management. Each expansion reflects deeper insights into how people, processes, and environments interact to create—or resolve—operational challenges. These frameworks will continue to adapt, offering structured yet flexible approaches to root cause analysis. Organizations that master their application will not only solve problems more effectively but also foster cultures of continuous improvement and innovation.

Quality Review

Maintaining high-quality products is paramount, and a critical component of ensuring quality is implementing a robust review of work by a second or third person, a peer review, and/or quality review—also known as a work product review process. Like many tools, it can be underutilized. It also gets to the heart of the question of Quality Unit oversight.

Introduction to Work Product Review

Work product review systematically evaluates the output from various processes or tasks to ensure they meet predefined quality standards. This review is crucial in environments where the quality of the final product directly impacts safety and efficacy, such as in pharmaceutical manufacturing. Work product review aims to identify any deviations or defects early in the process, allowing for timely corrections and minimizing the risk of non-compliance with regulatory requirements.

Criteria for Work Product Review

To ensure that work product reviews are effective, several key criteria should be established:

  1. Integration with Quality Management Systems: Integrate risk-based thinking into the quality management system to ensure that work product reviews are aligned with overall quality objectives. This involves regularly reviewing and updating risk assessments to reflect changes in processes or new information.
  2. Clear Objectives: The review should have well-defined objectives that align with the process they exist within and regulatory requirements. For instance, in pharmaceutical manufacturing, these objectives might include ensuring that all documentation is accurate and complete and that manufacturing processes adhere to GMP standards.
  3. Risk-Based: Apply work product reviews to areas identified as high-risk during the risk assessment. This ensures that resources are allocated efficiently, focusing on processes that have the greatest potential impact on quality.
  4. Standardized Procedures: Standardized procedures should be established for conducting the review. These procedures should outline the steps involved, the reviewers’ roles and responsibilities, and the criteria for accepting or rejecting the work product.
  5. Trained Reviewers: Reviewers should be adequately trained and competent in the subject matter. This means understanding not just the deliverable being reviewed but the regulatory framework it sits within and how it applies to the specific work products being reviewed in a GMP environment.
  6. Documentation: All reviews should be thoroughly documented. This documentation should include the review’s results, any findings or issues identified, and actions taken to address these issues.
  7. Feedback Loop: There should be a mechanism for feedback from the review process to improve future work products. This could involve revising procedures or providing additional training to personnel.

Bridging the Gap Between Work-as-Imagined, Work-as-Prescribed, and Work-as-Done

Work product review is a systematic process that evaluates the output from various tasks to ensure they meet predefined quality standards connecting to work-as-imagined, work-as-prescribed, and work-as-done. Work product review serves as a bridge between these concepts by systematically evaluating the output of work processes. Here’s how it connects:

  • Alignment with Work-as-Prescribed: Work product review ensures that outputs comply with established standards and procedures (work-as-prescribed), helping to maintain regulatory compliance and quality standards.
  • Insight into Work-as-Done: Through the review process, organizations gain insight into how work is actually being performed (work-as-done). This helps identify any deviations from prescribed procedures and allows for adjustments to improve alignment between work-as-prescribed and work-as-done.
  • Closing the Gap with Work-as-Imagined: By documenting and addressing discrepancies between work-as-imagined and work-as-done, work product review facilitates communication and feedback that can refine policies and procedures. This helps to bring work-as-imagined closer to the realities of work-as-done, improving the effectiveness of quality oversight.

Work product review is essential for ensuring that the quality of work outputs aligns with both prescribed standards and the realities of how work is actually performed. By bridging the gaps between work-as-imagined, work-as-prescribed, and work-as-done, organizations can enhance their quality management systems and maintain high standards of quality, safety and efficacy.

Aligning to the Role of Quality Unit Oversight

While work product review does not guarantee Quality Unit Oversight, it is a potential control to ensure this oversight.

In the pharmaceutical industry, the Quality Unit plays a pivotal role in ensuring drug products’ safety, efficacy, and quality. It oversees all quality-related aspects, from raw material selection to final product release. However, the Quality Unit must be enabled appropriately and structured within the organization to effectively exercise its authority and fulfill its responsibilities. This blog post explores what it means for a Quality Unit to have the necessary authority and how insufficient implementation of its responsibilities can impact pharmaceutical manufacturing.

Responsibilities of the Quality Unit

Establishing and Maintaining the Quality System: The Quality Unit must set up and continuously update the quality management system to ensure compliance with GxPs and industry best practices.

Auditing and Compliance: Conduct internal audits to ensure adherence to policies and procedures, and report quality system performance metrics.

Approving and Rejecting Components and Products: The Quality Unit has the authority to approve or reject components, drug products, and packaging materials based on quality standards.

Investigating Nonconformities: Ensuring thorough investigations into production errors, discrepancies, and complaints related to product quality.

Keeping Management Informed: Reporting on product, process, and system risks, as well as outcomes of regulatory inspections.

What It Means for a Quality Unit to Be Enabled

For a Quality Unit to be effectively enabled, it must have:

  • Independence: The Quality Unit should operate independently of production units to avoid conflicts of interest and ensure unbiased decision-making.
  • Authority: It must have the authority to approve or reject the work product without undue influence from other departments.
  • Resources: Adequate personnel are essential for conducting the quality unit functions.
  • Documentation and Procedures: Clear, documented procedures outlining responsibilities and processes are crucial for maintaining consistency and compliance.

Insufficient Implementation of Responsibilities

When a Quality Unit insufficiently implements its responsibilities, it can lead to significant issues, including:

  • Regulatory Noncompliance: Failure to adhere to GxPs and regulatory standards can result in regulatory action.
  • Product Quality Issues: Inadequate oversight can lead to the release of substandard products, posing risks to patient safety and public health.
  • Lack of Continuous Improvement: Without effective quality systems in place, opportunities for process improvements and innovation may be missed.

The Quality Unit is the backbone of pharmaceutical manufacturing, ensuring that products meet the highest standards of quality and safety. By understanding the Quality Unit’s responsibilities and ensuring it has the necessary authority and resources, pharmaceutical companies can maintain compliance, protect public health, and foster a culture of continuous improvement. Inadequate implementation of these responsibilities can have severe consequences, emphasizing the importance of a well-structured and empowered Quality Unit.

By understanding these responsibilities, we can take a risk-based approach to applying quality review.

When to Apply Quality Review as Work Product Review

Work product review by Quality should be applied at critical stages to guarantee critical-to-quality attributes, including adherence to the regulations. This should be a risk-based approach. As such, it should be identified as controls in a living risks assessment and adjusted (add more, remove where unnecessary) as appropriate.

Closely scrutinize the responsibilities of the Quality Unit in the regulations to ensure all are met.

Best Practices in Quality Review

Rubrics are a great way to standardize quality reviews. If it is important enough to require a work review, it is important enough to standardize. The process owner should develop and maintain these rubrics with an appropriate group of stakeholder custodians. This is a key part of knowledge management. Having this cross-functional perspective on the output and what quality looks like is critical. This rubric should include:

  • Definition of prescribed work and the intended output that is being reviewed
  • Potential outcomes related to critical attributes, including definitions of technical accuracy
  • Methods and techniques used to generate the outcome
  • Operating experience and lessons learned
  • Risks, hazards, and user-centered design considerations
  • Requirements, standards, and code compliance
  • Planning, oversight, and acceptance testing
  • Input data and sources
  • Assumptions
  • Documentation required
  • Reviews and approvals required
  • Program or procedural obstacles to desired performance
  • Surprise situations, for example, unanticipated risk factors, schedule or scope changes, and organizational issues
  • Engineering human performance tool(s) applicable to activities being reviewed.

The rubric should have an assessment component, and that assessment should feed back into the originator’s qualified state.

Work product reviews must be early enough to allow feedback into the normal work for repetitive tasks. This should lead to gates in processes, quality-on-the-floor, or better-trained supervisors performing better and more effective reviews. This feedback should always be to the responsible person – the originator—and should be, wherever possible, face-to-face feedback to resolve the particular issues identified. This dialogue is critical.

Conclusion

Work product review is a powerful tool for enhancing quality oversight. By aligning this process with the responsibilities of the Quality Unit and implementing best practices such as standardized rubrics and a risk-based approach, companies can ensure that their products meet the highest standards of quality and safety. Effective work product review not only supports regulatory compliance but also fosters a culture of continuous improvement, which is essential for maintaining excellence in the pharmaceutical industry.

Building a Data-Driven Culture: Empowering Everyone for Success

Data-driven decision-making is an essential component for achieving organizational success. Simply adopting the latest technologies or bringing on board data scientists is not enough to foster a genuinely data-driven culture. Instead, it requires a comprehensive strategy that involves every level of the organization.

This holistic approach emphasizes the importance of empowering all employees—regardless of their role or technical expertise—to effectively utilize data in their daily tasks and decision-making processes. It involves providing training and resources that enhance data literacy, enabling individuals to understand and interpret data insights meaningfully. Moreover, organizations should cultivate an environment that encourages curiosity and critical thinking around data. This might include promoting cross-departmental collaboration where teams can share insights and best practices regarding data use. Leadership plays a vital role in this transformation by modeling data-driven behaviors and championing a culture that values data as a critical asset. By prioritizing data accessibility and encouraging open dialogue about data analytics, organizations can truly empower their workforce to harness the potential of data, driving informed decisions that contribute to overall success and innovation.

The Three Pillars of Data Empowerment

To build a robust data-driven culture, leaders must focus on three key areas of readiness:

Data Readiness: The Foundation of Informed Decision-Making

Data readiness ensures that high-quality, relevant data is accessible to the right people at the right time. This involves:

  • Implementing robust data governance policies
  • Investing in data management platforms
  • Ensuring data quality and consistency
  • Providing secure and streamlined access to data

By establishing a strong foundation of data readiness, organizations can foster trust in their data and encourage its use across all levels of the company.

Analytical Readiness: Cultivating Data Literacy

Analytical readiness is a crucial component of building a data-driven culture. While access to data is essential, it’s only the first step in the journey. To truly harness the power of data, employees need to develop the skills and knowledge necessary to interpret and derive meaningful insights. Let’s delve deeper into the key aspects of analytical readiness:

Comprehensive Training on Data Analysis Tools

Organizations must invest in robust training programs that cover a wide range of data analysis tools and techniques. This training should be tailored to different skill levels and job functions, ensuring that everyone from entry-level employees to senior executives can effectively work with data.

  • Basic data literacy: Start with foundational courses that cover data types, basic statistical concepts, and data visualization principles.
  • Tool-specific training: Provide hands-on training for popular data analysis tools and the specialized business intelligence platforms that are adopted.
  • Advanced analytics: Offer more advanced courses on machine learning, predictive modeling, and data mining for those who require deeper analytical skills.

Developing Critical Thinking Skills for Data Interpretation

Raw data alone doesn’t provide value; it’s the interpretation that matters. Employees need to develop critical thinking skills to effectively analyze and draw meaningful conclusions from data.

  • Data context: Teach employees to consider the broader context in which data is collected and used, including potential biases and limitations.
  • Statistical reasoning: Enhance understanding of statistical concepts to help employees distinguish between correlation and causation, and to recognize the significance of findings.
  • Hypothesis testing: Encourage employees to formulate hypotheses and use data to test and refine their assumptions.
  • Scenario analysis: Train staff to consider multiple interpretations of data and explore various scenarios before drawing conclusions.

Encouraging a Culture of Curiosity and Continuous Learning

A data-driven culture thrives on curiosity and a commitment to ongoing learning. Organizations should foster an environment that encourages employees to explore data and continuously expand their analytical skills.

  • Data exploration time: Allocate dedicated time for employees to explore datasets relevant to their work, encouraging them to uncover new insights.
  • Learning resources: Provide access to online courses, webinars, and industry conferences to keep employees updated on the latest data analysis trends and techniques.
  • Internal knowledge sharing: Organize regular “lunch and learn” sessions or internal workshops where employees can share their data analysis experiences and insights.
  • Data challenges: Host internal competitions or hackathons that challenge employees to solve real business problems using data.

Fostering Cross-Functional Collaboration to Share Data Insights

Data-driven insights become more powerful when shared across different departments and teams. Encouraging cross-functional collaboration can lead to more comprehensive and innovative solutions.

  • Interdepartmental data projects: Initiate projects that require collaboration between different teams, combining diverse datasets and perspectives.
  • Data visualization dashboards: Implement shared dashboards that allow teams to view and interact with data from various departments.
  • Regular insight-sharing meetings: Schedule cross-functional meetings where teams can present their data findings and discuss potential implications for other areas of the business.
  • Data ambassadors: Designate data champions within each department to facilitate the sharing of insights and best practices across the organization.

By investing in these aspects of analytical readiness, organizations empower their employees to make data-informed decisions confidently and effectively. This not only improves the quality of decision-making but also fosters a culture of innovation and continuous improvement. As employees become more proficient in working with data, they’re better equipped to identify opportunities, solve complex problems, and drive the organization forward in an increasingly data-centric business landscape.

Infrastructure Readiness: Enabling Seamless Data Operations

To support a data-driven culture, organizations must have the right technological infrastructure in place. This includes:

  • Implementing scalable hardware solutions
  • Adopting user-friendly software for data analysis and visualization
  • Ensuring robust cybersecurity measures to protect sensitive data
  • Providing adequate computing power for complex data processing
  • Build a clear and implementable qualification methodology around data solutions

With the right infrastructure, employees can work with data efficiently and securely, regardless of their role or department.

The Path to a Data-Driven Culture

Building a data-driven culture is an ongoing process that requires commitment from leadership and active participation from all employees. Here are some key steps to consider:

  1. Lead by example: Executives should actively use data in their decision-making processes and communicate the importance of data-driven approaches.
  2. Democratize data access: Break down data silos and provide user-friendly tools that allow employees at all levels to access and analyze relevant data.
  3. Invest in training and education: Develop comprehensive data literacy programs that cater to different skill levels and job functions.
  4. Encourage experimentation: Create a safe environment where employees feel comfortable using data to test hypotheses and drive innovation.
  5. Celebrate data-driven successes: Recognize and reward individuals and teams who effectively use data to drive positive outcomes for the organization.

Conclusion

To build a truly data-driven culture, leaders must take everyone along on the journey. By focusing on data readiness, analytical readiness, and infrastructure readiness, organizations can empower their employees to harness the full potential of data. This holistic approach not only improves decision-making but also fosters innovation, drives efficiency, and ultimately leads to better business outcomes.

Remember, building a data-driven culture is not a one-time effort but a continuous process of improvement and adaptation. By consistently investing in these three areas of readiness, organizations can create a sustainable competitive advantage in today’s data-centric business landscape.