Self Awareness and Problem Solving

We often try to solve problems as if we are outside them. When people describe a problem you will see them pointing away from themselves – you hear the word “them” a lot. “They” are seen as the problem. However, truly hard problems are system problems, and if you are part of the system (hint – you are) then you are part of the problem.

Being inside the problem means we have to understand bias and our blind spots – both as individuals, as teams and as organizations.

Understanding our blind spots

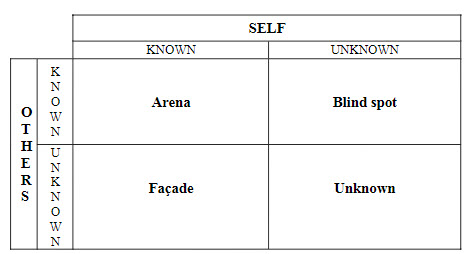
An easy tool to start thinking about this is the Johari window, a technique that helps people better understand their relationship with themselves and others. There are two axis, others and self. This forms four quadrants:

  • Arena – What is known by both self and others. It is also often referred to as the Public Area.
  • Blind spot – This region deals with knowledge unknown to self but visible to others, such as shortcomings or annoying habits.
  • Façade – This includes the features and knowledge of the individual which are not known to others. I prefer when this is called the Hidden. It was originally called facade because it can include stuff that is untrue but for the individual’s claim.
  • Unknown – The characteristics of the person that are unknown to both self and others.
The original Johari Window (based on Luft, 1969)

An example of a basic Johari Window (my own) can be found here.

Users are advised to reduce the area of ‘blind spot’ and ‘unknown’, while expand the ‘arena’. The premise is that the lesser the hidden personality, the better the person becomes in relating with other people.

The use of Johari Window is popular among business coaches as a cognitive tool to understand intrapersonal and interpersonal relationships. There isn’t much value of this tool as an empirical framework and it hasn’t held up to academic rigor. Still, like many such things it can bring to light the central point that we need to understand our hidden biases.

Another good tool to start understanding biases is a personal audit.

Using the Johari Window for Teams

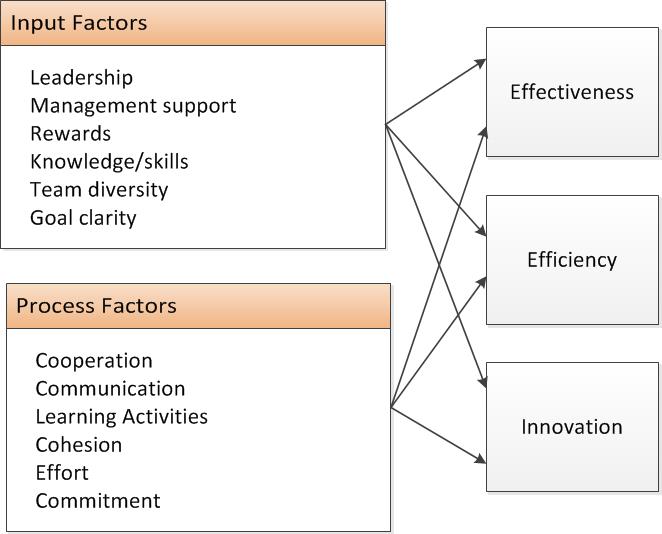
Teams and organizations have blind spots, think of them as negative input factors or as procedural negatives.

The Johari Window can also be applied to knowledge transparency, and it fits nicely to the concepts of tacit and explicit knowledge bringing to light knowledge-seeking and knowledge-sharing behavior. For example, the ‘arena’ can simply become the ‘unknown’ if there is no demand or offer pertaining to the knowledge to be occupied by the recipient or to be shared by the owner, respectively.

The Johari Window transforms with the the four quadrants changing to:

  • Arena What the organization knows it knows. Contains knowledge available to the team as well as related organizations. Realizing such improvements is usually demanded by network partners and should be priority for implementation.
  • Façade What the organization does know it knows. Knowledge that is only available to parts of the focal organization. Derived improvements are unexpected, but beneficial for the organization and its collaborations.
  • Blind SpotWhat the organization knows it does not know. Knowledge only available to other organizations – internal and external. This area should be investigated with highest priority, to benefit from insights and to maintain effectiveness.
  • Unknown What the organization does not know it does not know, and what the organization believes it knows but does not actually know. Knowledge about opportunities for improvement that is not available to anyone. Its identification leads to the Façade sector.

We are firmly in the land of uncertainty, ignorance and surprise, and we are starting to perform a risk based approach to our organization blind spots. At the heart, knowledge management, problem solving and risk management are all very closely intertwined.

Team Effectiveness

With much of the work in organizations accomplished through teams it is important to determine the factors that lead to effective as well as ineffective team processes and to better specify how, why, and when they contribute. It doesn’t matter if the team is brought together for a specific project and then disbands, or if it is a fairly permanent part of the organization, similar principles are at work.

Input-Process-Output model

The input-process-output model of teams is a great place to start. While simplistic, it can offer a good model of what makes teams works and is applicable to the different types of teams.

Input factors are the organizational context, team composition, task design that influence the team. Process factors are what mediates between the inputs and desired outputs.

  • Leadership:  The leadership style(s) (participative, facilitative, transformational, directive, etc) of the team leader influences the team toward the achievement of goals.
  • Management support refers to the help or effort provided by senior management to assist the project team, including managerial involvement and resource support.
  • Rewards are the recompense that the organization gives in return for good work.
  • Knowledge/skills are the knowledge, experience and capability of team members to process, interpret, manipulate and use information.
  • Team diversity includes functional diversity as well as overall diversity.
  • Goal clarity is the degree to which the goals of the project are well defined and the importance of the goals to the organization is clearly communicated to all team members.
  • Cooperation is the measure of how well team members work with each other and with other groups.
  • Communication is the exchange of knowledge and information related to tasks with the team (internal) or between team members and external stakeholders (external).
  • Learning activities are the process by which a team takes action, contains feedback and makes changes to improve. Under this fits the PDCA lifecycle, including Lean, SixSigma and similar problem solving methodologies..
  • Cohesion is the spirit of togetherness and support for other team members that helps team members quickly resolve conflicts without residual hard feelings, also referred to as team trust, team spirit, team member support or team member involvement.
  • Effort includes the amount of time that team members devote to the project.
  • Commitment refers to the condition where team members are bound emotionally or intellectually to the project and to each other during the team process.

Process Factors are usually the focus on team excellence frameworks, such as the ASQ or the PMI.

Outputs, or outcomes, are the consequences of the team’s actions or activities:

  • Effectiveness is the extent a project achieves the performance expectations of key project stakeholders. Expectations are usually different for different projects and across different stake-holders; thus, various measures have been used to evaluate effectiveness, usually quality, functionality, or reliability. Effectiveness can be meeting customer/user requirements, meeting project goals or some other related set of measures.
  • Efficiency is the ability of the project team to meet its budget and schedule goals and utilize resources within constraints Measures include: adherence to budget, adherence to schedule, resource utilization within constraints, etc.
  • Innovation is the creative accomplishment of teams in generating new ideas, methods, approaches, inventions, or applications and the degree to which the project outputs were novel.

Under this model we can find a various levers to improve out outcomes and enhance the culture of our teams.

Data Process Mapping

In a presentation on practical applications of data integrity for laboratories at the March 2019 MHRA Laboratories Symposium held in London, UK, MHRA Lead GCP and GLP Inspector Jason Wakelin-Smith highlighted the important role data process mapping plays in understanding these challenges and moving down the DI pathway.

He pointed out that understanding of processes and systems, which data maps facilitate, is a key theme in MHRA’s GxP data integrity guidance, finalized in March of 2018. The guidance is intended to be broadly applicable across the regulated practices, but excluding the medical device arena, which is regulated in Europe by third-party notified bodies.

IPQ. MHRA Inspectors are Advocating Data Mapping as a Key First Step on the Data Integrity Pilgrimage

Data process maps look at the entire data life-cycle from creation through storage (covering key components of create, modify and delete) and include all operations with both paper and electronic records.   Data maps are cross-functional diagrams (swim-lanes) and have the following sections:

  • Prep/Input
  • Data Creation
  • Data Manipulation (include delete)
  • Data  Use
  • Data Storage

Use a standard symbol for paper record, computer data and process step.

For computer data denote (usually by color) the level of controls:

  • Fully aligned with Part 11 and Data Integrity guidances
  • Gaps in compliance but remediation plan in place (this includes places where paper is considered “true copy”
  • Not compliant, no remediation plan

Data operations are depicted utilizing arrows.  The following data operations are probably most common, and are recommended for consistency:

  • Data Entry – input of process, meta data (e.g. lot ID, operator)
  • Data Store – archival location
  • Data Copy – transcription from another system or paper, transfer of data from one system to another, printing (Indicate if it is a manual process).
  • Data Edit – calculations, processing, reviews, unit changes  (Indicate if it is a manual process)
  • Data Move – movement of paper or electronic records

Data operation arrows should denote (again by color) the current controls in place:

  • Technical Controls – Validated Automated Process
  • Operational Controls – Manual Process with Review/Verified/Witness Requirements
  • No Controls – Automated process that is not validated or Manual process with no Review/Verified/Witness Considerations
Example data map

Top 5 Posts by Views in 2019 (first half)

With June almost over a look at the five top views for 2019. Not all of these were written in 2019, but I find it interesting what folks keep ending up at my blog to read.

  1. FDA signals – no such thing as a planned deviation: Since I wrote this has been a constant source of hits, mostly driven by search engines. I always feel like I should do a follow-up, but not sure what to say beyond – don’t do planned deviations, temporary changes belong in the change control system.
  2. Empathy and Feedback as part of Quality Culture: The continued popularity of this post since I wrote it in March has driven a lot of the things I am writing lately.
  3. Effective Change Management: Change management and change control are part of my core skill set and I’m gratified that this post gets a lot of hits. I wonder if I should build it into some sort of expanded master class, but I keep feeling I already have.
  4. Review of Audit Trails: Data Integrity is so critical these days. I should write more on the subject.
  5. Risk Management is about reducing uncertainty: This post really captures a lot of the stuff I am thinking about and driving action on at work.

Thinking back to my SWOT, and the ACORN test I did at the end of 2018, I feel fairly good about the first six months. I certainly wish I found time to blog more often, but that seems doable. And like most bloggers, I still am looking for ways to increase engagement with my posts and to spark conversations.