In the complex landscape of biologics drug substance (DS) manufacturing, the understanding and management of Critical Material Attributes (CMAs) has emerged as a cornerstone for achieving consistent product quality. As biological products represent increasingly sophisticated therapeutic modalities with intricate structural characteristics and manufacturing processes, the identification and control of CMAs become vital components of a robust Quality by Design (QbD) approach. It is important to have a strong process for the selection, risk management, and qualification/validation of CMAs, capturing their relationships with Critical Quality Attributes (CQAs) and Critical Process Parameters (CPPs).
Defining Critical Material Attributes
Critical Material Attributes (CMA) represent a fundamental concept within the pharmaceutical QbD paradigm. A CMA is a physical, chemical, biological, or microbiological property or characteristic of an input material controlled within an appropriate limit, range, or distribution to ensure the desired quality of output material. While not officially codified in guidance, this definition has become widely accepted throughout the industry as an essential concept for implementing QbD principles in biotech manufacturing.
In biologics drug substance manufacturing, CMAs may encompass attributes of raw materials used in cell culture media, chromatography resins employed in purification steps, and various other input materials that interact with the biological product during production. For example, variations in the composition of cell culture media components can significantly impact cell growth kinetics, post-translational modifications, and, ultimately, the critical quality attributes of the final biological product.
The biologics manufacturing process typically encompasses both upstream processing (USP) and downstream processing (DSP) operations. Within this continuum, product development aims to build robustness and demonstrate control of a manufacturing process to ensure consistency within the specifications of the manufacturing quality attributes. QbD principles reinforce the need for a systematic process development approach and risk assessment to be conducted early and throughout the biologics development process.
The Interdependent Relationship: CMAs, CQAs, and CPPs in Biologics Manufacturing
In biologics DS manufacturing, the relationship between CMAs, CPPs, and CQAs forms a complex network that underpins product development and manufacture. CQAs are physical, chemical, biological, or microbiological properties or characteristics of the output product that should remain within appropriate limits to ensure product quality. For biologics, these might include attributes like glycosylation patterns, charge variants, aggregation propensity, or potency—all of which directly impact patient safety and efficacy.
The intricate relationship between these elements in biologics production can or exabe expressed as: CQAs = f(CPP₁, CPP₂, CPP₃, …, CMA₁, CMA₂, CMA₃, …). This formulation crystallizes the understanding that CQAs in a biological product are a function of both process parameters and material attributes. For example, in monoclonal antibody production, glycosylation profiles (a CQA) might be influenced by bioreactor temperature and pH (CPPs) as well as the quality and composition of cell culture media components (CMAs).
Identifying CMAs in manufacturing must be aligned with biopharmaceutical development and manufacturing strategies guided by the product’s Target Product Profile (TPP). QbD principles are applied from the onset of product definition and development to ensure that the product meets patient needs and efficacy requirements. Critical sources of variability are identified and controlled through appropriate control strategies to consistently meet product CQAs, and the process is continually monitored, evaluated, and updated to maintain product quality throughout its life cycle.
The interdependence between unit operations adds another layer of complexity. The output from one unit operation becomes the input for the next, creating a chain of interdependent processes where material attributes at each stage can influence subsequent steps. For example, the transition from upstream cell culture to downstream purification operations where the characteristics of the harvested cell culture fluid significantly impact purification efficiency and product quality.
Systematic Approach to CMA Selection in Biologics Manufacturing
Identifying and selecting CMAs in biologics DS manufacturing represents a methodical process requiring scientific rigor and risk-based decision-making. This process typically begins with establishing a Quality Target Product Profile (QTPP), which outlines the desired quality characteristics of the final biological product, taking into account safety and efficacy considerations.
The first step in CMA selection involves comprehensive material characterization to identify all potentially relevant attributes of input materials used in production. This might include characteristics like purity, solubility, or bioactivity for cell culture media components. For chromatography resins in downstream processing, attributes such as binding capacity, selectivity, or stability might be considered. This extensive characterization creates a foundation of knowledge about the materials that will be used in the biological product’s manufacturing process.
Risk assessment tools play a crucial role in the initial screening of potential CMAs. These might include Failure Mode and Effects Analysis (FMEA), Preliminary Hazards Analysis (PHA), or cause-and-effect matrices that relate material attributes to CQAs.
Once potential high-risk material attributes are identified, experimental studies, often employing the Design of Experiments (DoE) methodology, are conducted to determine whether these attributes genuinely impact CQAs of the biological product and, therefore, should be classified as critical. This empirical verification is essential, as theoretical risk assessments must be confirmed through actual data before final classification as a CMA. The process characterization strategy typically aims to identify process parameters that impact product quality and yield by identifying interactions between process parameters and critical quality attributes, justifying and, if necessary, adjusting manufacturing operating ranges and acceptance criteria, ensuring that the process delivers a product with reproducible yields and purity, and enabling heads-up detection of manufacturing deviations using the established control strategy and knowledge about the impact of process inputs on product quality.
Risk Management Strategies for CMAs in Biologics DS Manufacturing
Risk management for Critical Material Attributes (CMAs) in biologics manufacturing extends far beyond mere identification to encompass a comprehensive strategy for controlling and mitigating risks throughout the product lifecycle. The risk management process typically follows a structured approach comprising risk identification, assessment, control, communication, and review—all essential elements for ensuring biologics quality and safety.
Structured Risk Assessment Methodologies
The first phase in effective CMA risk management involves establishing a cross-functional team to conduct systematic risk assessments. A comprehensive Raw Material Risk Assessment (RMRA) requires input from diverse experts including Manufacturing, Quality Assurance, Quality Control, Supply Chain, and Materials Science & Technology (MSAT) teams, with additional Subject Matter Experts (SMEs) added as necessary. This multidisciplinary approach ensures that diverse perspectives on material criticality are considered, particularly important for complex biologics manufacturing where materials may impact multiple aspects of the process.
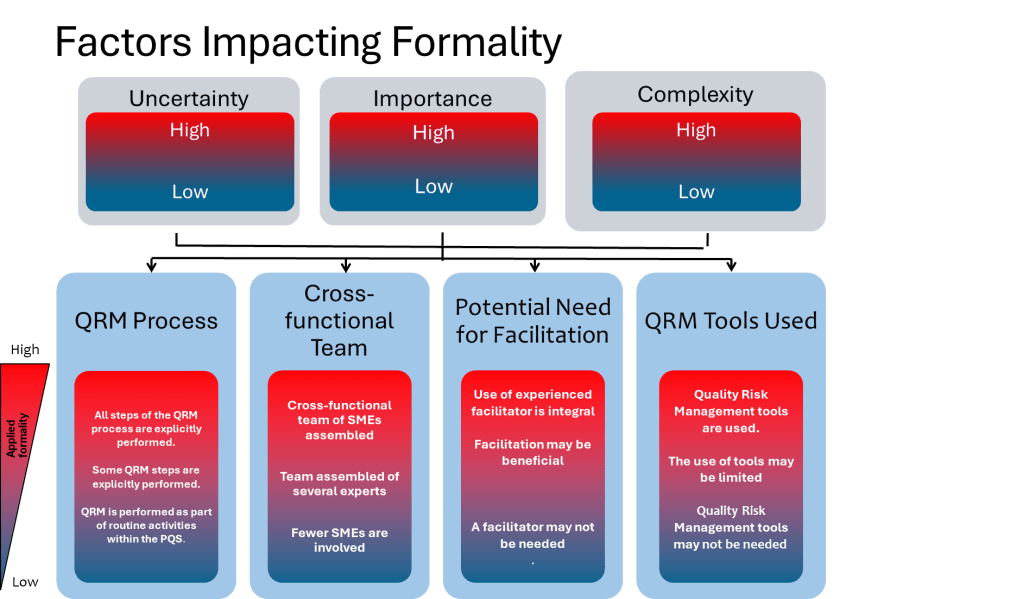
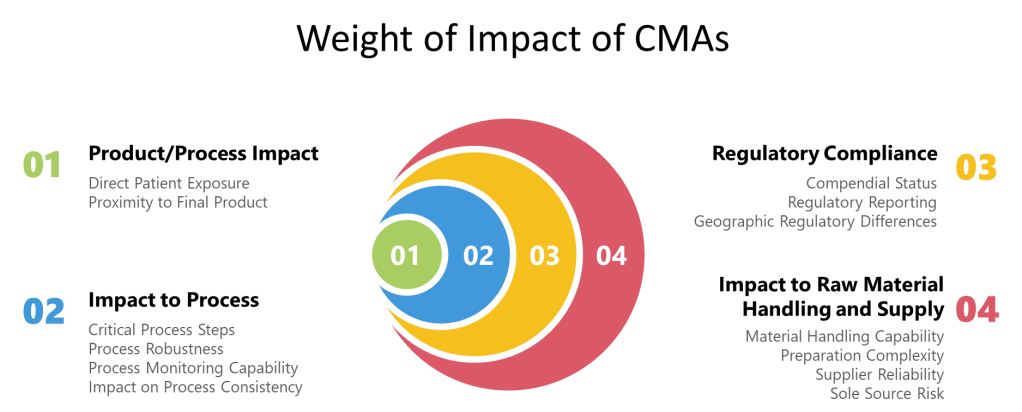
Risk assessment methodologies for CMAs must be standardized yet adaptable to different material types. A weight-based scoring system can be implemented where risk criteria are assigned predetermined weights based on the severity that risk realization would pose on the product/process. This approach recognizes that not all material attributes carry equal importance in terms of their potential impact on product quality and patient safety.
Comprehensive Risk Evaluation Categories
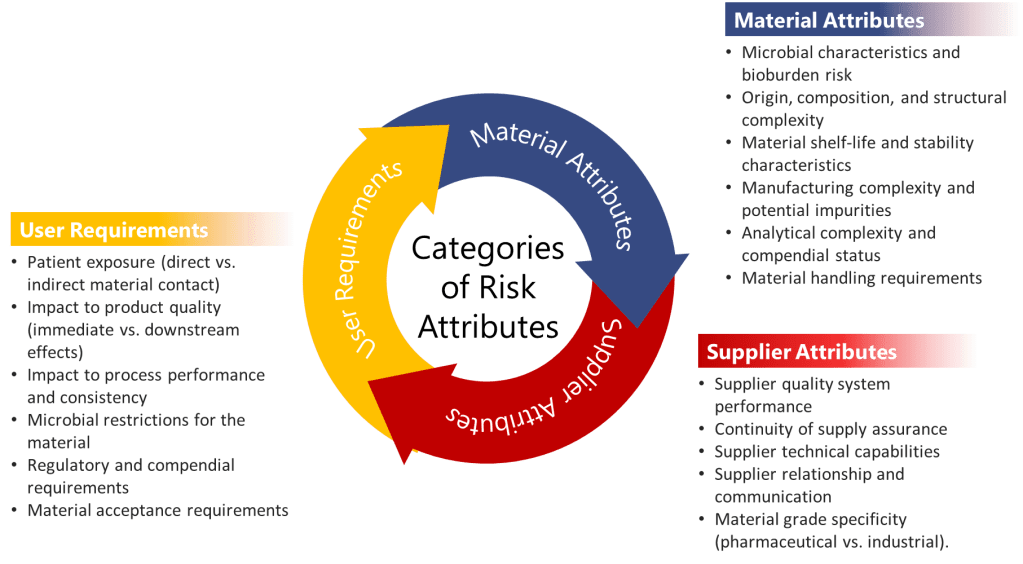
When evaluating CMAs, three major categories of risk attributes should be systematically assessed:
- User Requirements: These evaluate how the material is used within the manufacturing process and include assessment of:
- Patient exposure (direct vs. indirect material contact)
- Impact to product quality (immediate vs. downstream effects)
- Impact to process performance and consistency
- Microbial restrictions for the material
- Regulatory and compendial requirements
- Material acceptance requirements
- Material Attributes: These assess the inherent properties of the material itself:
- Microbial characteristics and bioburden risk
- Origin, composition, and structural complexity
- Material shelf-life and stability characteristics
- Manufacturing complexity and potential impurities
- Analytical complexity and compendial status
- Material handling requirements
- Supplier Attributes: These evaluate the supply chain risks associated with the material:
- Supplier quality system performance
- Continuity of supply assurance
- Supplier technical capabilities
- Supplier relationship and communication
- Material grade specificity (pharmaceutical vs. industrial)
In biologics manufacturing, these categories take on particular significance. For instance, materials derived from animal sources might carry higher risks related to adventitious agents, while complex cell culture media components might exhibit greater variability in composition between suppliers—both scenarios with potentially significant impacts on product quality.
Quantitative Risk Scoring and Prioritization
Risk assessment for CMAs should employ quantitative scoring methodologies that allow for consistency in evaluation and clear prioritization of risk mitigation activities. For example, risk attributes can be qualitatively scaled as High, Medium, and Low, but then converted to numerical values (High=9, Medium=3, Low=1) to create an adjusted score. These adjusted scores are then multiplied by predetermined weights for each risk criterion to calculate weighted scores.
The total risk score for each raw material is calculated by adding all the weighted scores across categories. This quantitative approach enables objective classification of materials into risk tiers: Low (≤289), Medium (290-600), or High (≥601). Such tiered classification drives appropriate resource allocation, focusing intensified control strategies on truly critical materials while avoiding unnecessary constraints on low-risk items.
This methodology aligns with the QbD principle that not all quality attributes result in the same level of harm to patients, and therefore not all require the same level of control. The EMA-FDA QbD Pilot program emphasized that “the fact that a risk of failure is mitigated by applying a robust proactive control strategy should not allow for the underestimation of assigning criticality.” This suggests that even when control strategies are in place, the fundamental criticality of material attributes should be acknowledged and appropriately managed.
Risk Mitigation Strategies and Control Implementation
For materials identified as having medium to high risk, formalizing mitigation strategies becomes crucial. The level of mitigation required should be proportionate to the risk score. Any material with a Total Risk Score of Medium (290-600) requires a documented mitigation strategy, while materials with High risk scores (≥601) should undergo further evaluation under formal Quality Risk Management procedures. For particularly high-risk materials, consideration should be given to including them on the organization’s risk register to ensure ongoing visibility and management attention.
Mitigation strategies for high-risk CMAs in biologics manufacturing might include:
- Enhanced supplier qualification and management programs: For biotech manufacturing, this might involve detailed audits of suppliers’ manufacturing facilities, particularly focusing on areas that could impact critical material attributes such as cell culture media components or chromatography resins.
- Tightened material specifications: Implementing more stringent specifications for critical attributes of high-risk materials. For example, for a critical growth factor in cell culture media, the purity, potency, and stability specifications might be tightened beyond the supplier’s standard specifications.
- Increased testing frequency: Implementing more frequent or extensive testing protocols for high-risk materials, potentially including lot-to-lot testing for biological activity or critical physical attributes.
- Secondary supplier qualification: Developing and qualifying alternative suppliers for high-risk materials to mitigate supply chain disruptions. This is particularly important for specialized biologics materials that may have limited supplier options.
- Process modifications to accommodate material variability: Developing processes that can accommodate expected variability in critical material attributes, such as adjustments to cell culture parameters based on growth factor potency measurements.
Continuous Monitoring and Periodic Reassessment
A crucial aspect of CMA risk management in biologics manufacturing is that the risk assessment is not a one-time activity but a continuous process. The RMRA should be treated as a “living document” that requires updating when conditions change or when mitigation efforts reduce the risk associated with a material. At minimum, periodical re-evaluation of the risk assessment should be conducted in accordance with the organization’s Quality Risk Management procedures.
Changes that might trigger reassessment include:
- Supplier changes or manufacturing site transfers
- Changes in material composition or manufacturing process
- New information about material impact on product quality
- Observed variability in process performance potentially linked to material attributes
- Regulatory changes affecting material requirements
This continual reassessment approach is particularly important in biologics manufacturing, where understanding of process-product relationships evolves throughout the product lifecycle, and where subtle changes in materials can have magnified effects on biological systems.
The integration of material risk assessments with broader process risk assessments is also essential. The RMRA should be conducted prior to Process Characterization risk assessments to determine whether any raw materials will need to be included in robustness studies. This integration ensures that the impact of material variability on process performance and product quality is systematically evaluated and controlled.
Through this comprehensive approach to risk management for CMAs, biotech manufacturers can develop robust control strategies that ensure consistent product quality while effectively managing the inherent variability and complexity of production systems and their input materials.
Qualification and Validation of CMAs
The qualification and validation of CMAs represent critical steps in translating scientific understanding into practical control strategies for biotech manufacturing. Qualification involves establishing that the analytical methods used to measure CMAs are suitable for their intended purpose, providing accurate and reliable results. This is particularly important for biologics given their complexity and the sophisticated analytical methods required for their characterization.
For biologics DS manufacturing, a comprehensive analytical characterization package is critical for managing process or facility changes in the development cycle. As part of creating the manufacturing process, analytical tests capable of qualitatively and quantitatively characterizing the physicochemical, biophysical, and bioactive/functional potency attributes of the active biological DS are essential. These tests should provide information about the identity (primary and higher order structures), concentration, purity, and in-process impurities (residual host cell protein, mycoplasma, bacterial and adventitious agents, nucleic acids, and other pathogenic viruses).
Validation of CMAs encompasses demonstrating the relationship between these attributes and CQAs through well-designed experiments. This validation process often employs DoE approaches to establish the functional relationship between CMAs and CQAs, quantifying how variations in material attributes influence the final product quality. For example, in a biologics manufacturing context, a DoE study might investigate how variations in the quality of a chromatography resin affect the purity profile of the final drug substance.
Control strategies for validated CMAs might include a combination of raw material specifications, in-process controls, and process parameter adjustments to accommodate material variability. The implementation of control strategies for CMAs should follow a risk-based approach, focusing the most stringent controls on attributes with the highest potential impact on product quality. This prioritization ensures efficient resource allocation while maintaining robust protection against quality failures.
Integrated Control Strategy for CMAs
The culmination of CMA identification, risk assessment, and validation leads to developing an integrated control strategy within the QbD framework for biotech DS manufacturing. This control strategy encompasses the totality of controls implemented to ensure consistent product quality, including specifications for drug substances, raw materials, and controls for each manufacturing process step.
For biologics specifically, robust and optimized analytical assays and characterization methods with well-documented procedures facilitate smooth technology transfer for process development and cGMP manufacturing. A comprehensive analytical characterization package is also critical for managing process or facility changes in the biological development cycle. Such “comparability studies” are key to ensuring that a manufacturing process change will not adversely impact the quality, safety (e.g., immunogenicity), or efficacy of a biologic product.
Advanced monitoring techniques like Process Analytical Technology (PAT) can provide real-time information about material attributes throughout the biologics manufacturing process, enabling immediate corrective actions when variations are detected. This approach aligns with the QbD principle of continual monitoring, evaluation, and updating of the process to maintain product quality throughout its lifecycle.
The typical goal of a Process Characterization Strategy in biologics manufacturing is to identify process parameters that impact product quality and yield by identifying interactions between process parameters and critical quality attributes, justifying and, if necessary, adjusting manufacturing operating ranges and acceptance criteria, ensuring that the process delivers a product with reproducible yields and purity, and enabling early detection of manufacturing deviations using the established control strategy.
Biologics-Specific Considerations in CMA Management
Biologics manufacturing presents unique challenges for CMA management due to biological systems’ inherent complexity and variability. Unlike small molecules, biologics are produced by living cells and undergo complex post-translational modifications that can significantly impact their safety and efficacy. This biological variability necessitates specialized approaches to CMA identification and control.
In biologics DS manufacturing, yield optimization is a significant consideration. Yield refers to downstream efficiency and is the ratio of the mass (weight) of the final purified protein relative to its mass at the start of purification (output/content from upstream bioprocessing). To achieve a high-quality, safe biological product, it is important that the Downstream Processing (DSP) unit operations can efficiently remove all in-process impurities (Host Cell Proteins, nucleic acid, adventitious agents).
The analytical requirements for biologics add another layer of complexity to CMA management. For licensing biopharmaceuticals, development and validation of assays for lot release and stability testing must be included in the specifications for the DS. Most importantly, a potency assay is required that measures the product’s ability to elicit a specific response in a disease-relevant system. This analytical complexity underscores the importance of robust analytical method development for accurately measuring and controlling CMAs.
Conclusion
Critical Material Attributes represent a vital component in the modern pharmaceutical development paradigm. Their systematic identification, risk management, and qualification underpin successful QbD implementation and ensure consistent production of high-quality biological products. By understanding the intricate relationships between CMAs, CPPs, and CQAs, biologics developers can build robust control strategies that accommodate material variability while consistently delivering products that meet their quality targets.
As manufacturing continues to evolve toward more predictive and science-based approaches, the importance of understanding and controlling CMAs will only increase. Future advancements may include improved predictive models linking material attributes to biological product performance, enhanced analytical techniques for real-time monitoring of CMAs, and more sophisticated control strategies that adapt to material variability through automated process adjustments.
The journey from raw to finished products traverses a complex landscape where material attributes interact with process parameters to determine final product quality. By mastering the science of CMAs, developers, and manufacturers can confidently navigate this landscape, ensuring that patients receive safe, effective, and consistent biological medicines. Through continued refinement of these approaches and collaborative efforts between industry and regulatory agencies, biotech manufacturing can further enhance product quality while improving manufacturing efficiency and regulatory compliance.
Sources
APA Bibliography
- BioPhorum. (2019, September). Raw material risk assessment. https://www.biophorum.com/download/raw-material-risk-assessment-september-2019/
- Bonacci, T. M. (2022, September/October). Regulatory landscape for raw materials: CMC considerations. Pharmaceutical Engineering. https://ispe.org/pharmaceutical-engineering/september-october-2022/regulatory-landscape-raw-materials-cmc
- International Council for Harmonisation of Technical Requirements for Pharmaceuticals for Human Use. (n.d.). ICH Q9 guideline: Quality risk management. https://database.ich.org/sites/default/files/Q9_Guideline.pdf
- Shimoni, Y., Srinivasan, V., & von Gruchalla-Wesierski, M. (2015, November 17). A risk-based approach to supplier and raw materials management. BioProcess International. https://www.bioprocessintl.com/biochemicals-raw-materials/a-risk-based-approach-to-supplier-and-raw-materials-management
- Synerg Biopharma. (n.d.). Exploring risk-based approaches to raw material testing in pharmaceutical manufacturing. https://synergbiopharma.com/exploring-risk-based-approaches-to-raw-material-testing-in-pharmaceutical-manufacturing/
World Health Organization. (n.d.). Quality risk management (WHO Technical Report Series, No. 981, Annex 2). https://www.who.int/docs/default-source/medicines/norms-and-standards/guidelines/production/trs981-annex2-who-quality-risk-management.pdf