Operational Stability

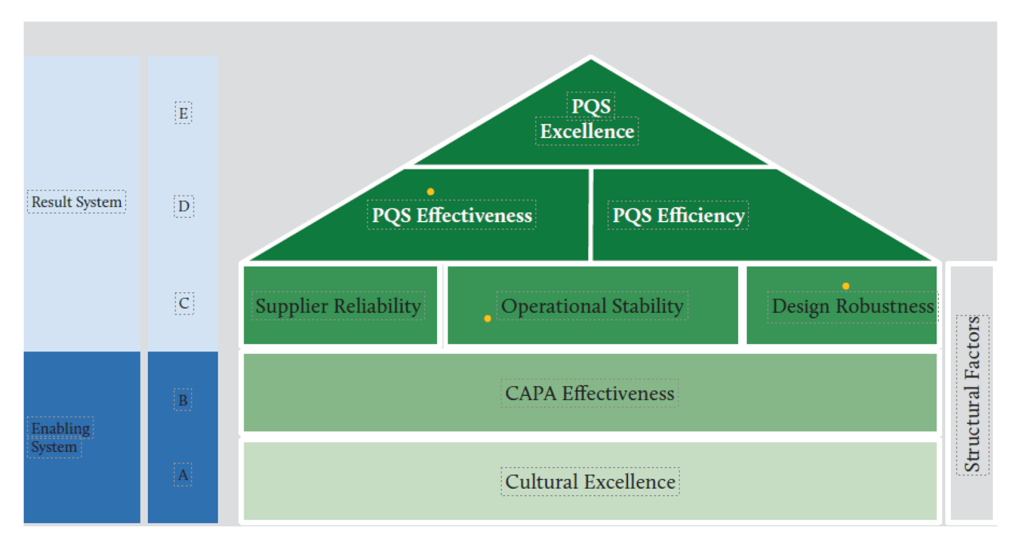
At the heart of achieving consistent pharmaceutical quality lies operational stability—a fundamental concept that forms the critical middle layer in the House of Quality model. Operational stability serves as the bridge between cultural foundations and the higher-level outcomes of effectiveness, efficiency, and excellence. This critical positioning makes it worthy of detailed examination, particularly as regulatory bodies increasingly emphasize Quality Management Maturity (QMM) as a framework for evaluating pharmaceutical operations.

he image is a diagram in the shape of a house, illustrating a framework for PQS (Pharmaceutical Quality System) Excellence. The house is divided into several colored sections:

The roof is labeled "PQS Excellence."

Below the roof, two sections are labeled "PQS Effectiveness" and "PQS Efficiency."

Underneath, three blocks are labeled "Supplier Reliability," "Operational Stability," and "Design Robustness."

Below these, a larger block spans the width and is labeled "CAPA Effectiveness."

The base of the house is labeled "Cultural Excellence."

On the left side, two vertical sections are labeled "Enabling System" (with sub-levels A and B) and "Result System" (with sub-levels C, D, and E).

On the right side, a vertical label reads "Structural Factors."

The diagram uses different shades of green and blue to distinguish between sections and systems.

Understanding Operational Stability in Pharmaceutical Manufacturing

Operational stability represents the state where manufacturing and quality processes exhibit consistent, predictable performance over time with minimal unexpected variations. It refers to the capability of production systems to maintain control within defined parameters regardless of routine challenges that may arise. In pharmaceutical manufacturing, operational stability encompasses everything from batch-to-batch consistency to equipment reliability, from procedural adherence to supply chain resilience.

The essence of operational stability lies in its emphasis on reliability and predictability. A stable operation delivers consistent outcomes not by chance but by design—through robust systems that can withstand normal operating stresses without performance degradation. Pharmaceutical operations that achieve stability demonstrate the ability to maintain critical quality attributes within specified limits while accommodating normal variability in inputs such as raw materials, human operations, and environmental conditions.

According to the House of Quality model for pharmaceutical quality frameworks, operational stability occupies a central position between cultural foundations and higher-level performance outcomes. This positioning is not accidental—it recognizes that stability is both dependent on cultural excellence below it and necessary for the efficiency and effectiveness that lead to excellence above it.

The Path to Obtaining Operational Stability

Achieving operational stability requires a systematic approach that addresses several interconnected dimensions. This pursuit begins with establishing robust processes designed with sufficient control mechanisms and clear operating parameters. Process design should incorporate quality by design principles, ensuring that processes are inherently capable of consistent performance rather than relying on inspection to catch deviations.

Standard operating procedures form the backbone of operational stability. These procedures must be not merely documented but actively maintained, followed, and continuously improved. This principle applies broadly—authoritative documentation precedes execution, ensuring alignment and clarity.

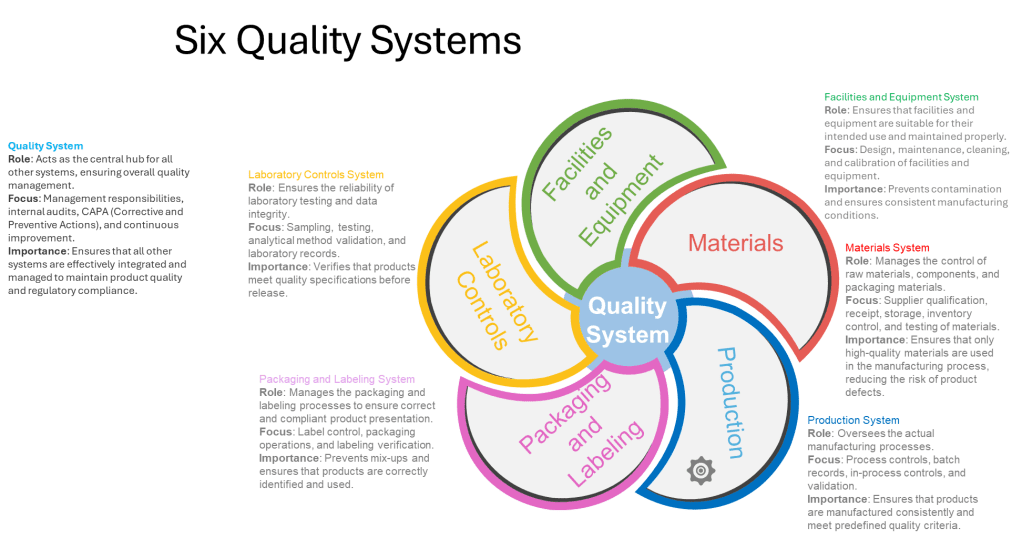
Equipment reliability programs represent another critical component in achieving operational stability. Preventive maintenance schedules, calibration programs, and equipment qualification processes all contribute to ensuring that physical assets support rather than undermine stability goals. The FDA’s guidance on pharmaceutical CGMP regulation emphasizes the importance of the Facilities and Equipment System, which ensures that facilities and equipment are suitable for their intended use and maintained properly.

Supplier qualification and management play an equally important role. As pharmaceutical manufacturing becomes increasingly globalized, with supply chains spanning multiple countries and organizations, the stability of supplied materials becomes essential for operational stability. “Supplier Reliability” appears in the House of Quality model at the same level as operational stability, underscoring their interconnected nature1. Robust supplier qualification programs, ongoing monitoring, and collaborative relationships with key vendors all contribute to supply chain stability that supports overall operational stability.

Human factors cannot be overlooked in the pursuit of operational stability. Training programs, knowledge management systems, and appropriate staffing levels all contribute to consistent human performance. The establishment of a “zero-defect culture” underscores the importance of human factors in achieving true operational stability.

Main Content Overview:
The document outlines six key quality systems essential for effective quality management in regulated industries, particularly pharmaceuticals and related fields. Each system is described with its role, focus areas, and importance.

Detailed Alt Text
1. Quality System

Role: Central hub for all other systems, ensuring overall quality management.

Focus: Management responsibilities, internal audits, CAPA (Corrective and Preventive Actions), and continuous improvement.

Importance: Integrates and manages all systems to maintain product quality and regulatory compliance.

2. Laboratory Controls System

Role: Ensures reliability of laboratory testing and data integrity.

Focus: Sampling, testing, analytical method validation, and laboratory records.

Importance: Verifies products meet quality specifications before release.

3. Packaging and Labeling System

Role: Manages packaging and labeling to ensure correct and compliant product presentation.

Focus: Label control, packaging operations, and labeling verification.

Importance: Prevents mix-ups and ensures correct product identification and use.

4. Facilities and Equipment System

Role: Ensures facilities and equipment are suitable and maintained for intended use.

Focus: Design, maintenance, cleaning, and calibration.

Importance: Prevents contamination and ensures consistent manufacturing conditions.

5. Materials System

Role: Manages control of raw materials, components, and packaging materials.

Focus: Supplier qualification, receipt, storage, inventory control, and testing.

Importance: Ensures only high-quality materials are used, reducing risk of defects.

6. Production System

Role: Oversees manufacturing processes.

Focus: Process controls, batch records, in-process controls, and validation.

Importance: Ensures consistent manufacturing and adherence to quality criteria.

Image Description:
A diagram (not shown here) likely illustrates the interconnection of the six quality systems, possibly with the "Quality System" at the center and the other five systems branching out, indicating their relationship and integration within an overall quality management framework

Measuring Operational Stability: Key Metrics and Approaches

Measurement forms the foundation of any improvement effort. For operational stability, measurement approaches must capture both the state of stability and the factors that contribute to it. The pharmaceutical industry utilizes several key metrics to assess operational stability, ranging from process-specific measurements to broader organizational indicators.

Process capability indices (Cp, Cpk) provide quantitative measures of a process’s ability to meet specifications consistently. These statistical measures compare the natural variation in a process against specified tolerances. A process with high capability indices demonstrates the stability necessary for consistent output. These measures help distinguish between common cause variations (inherent to the process) and special cause variations (indicating potential instability).

Deviation rates and severity classification offer another window into operational stability. Tracking not just the volume but the nature and significance of deviations provides insight into systemic stability issues. The following table outlines how different deviation patterns might be interpreted:

Deviation PatternStability ImplicationRecommended Response
Low frequency, low severityGood operational stabilityContinue monitoring, seek incremental improvements
Low frequency, high severityCritical vulnerability despite apparent stabilityRoot cause analysis, systemic preventive actions
High frequency, low severityDegrading stability, risk of normalization of devianceProcess review, operator training, standard work reinforcement
High frequency, high severityFundamental stability issuesComprehensive process redesign, management system review

Equipment reliability metrics such as Mean Time Between Failures (MTBF) and Overall Equipment Effectiveness (OEE) provide visibility into the physical infrastructure supporting operations. These measures help identify whether equipment-related issues are undermining otherwise well-designed processes.

Batch cycle time consistency represents another valuable metric for operational stability. In stable operations, the time required to complete batch manufacturing should fall within a predictable range. Increasing variability in cycle times often serves as an early warning sign of degrading operational stability.

Right-First-Time (RFT) batch rates measure the percentage of batches that proceed through the entire manufacturing process without requiring rework, deviation management, or investigation. High and consistent RFT rates indicate strong operational stability.

Leveraging Operational Stability for Organizational Excellence

Once achieved, operational stability becomes a powerful platform for broader organizational excellence. Robust operational stability delivers substantial business benefits that extend throughout the organization.

Resource optimization represents one of the most immediate benefits. Stable operations require fewer resources dedicated to firefighting, deviation management, and rework. This allows for more strategic allocation of both human and financial resources. As noted in the St. Gallen reports “organizations with higher levels of cultural excellence, including employee engagement and continuous improvement mindsets supports both quality and efficiency improvements.”

Stable operations enable focused improvement efforts. Rather than dispersing improvement resources across multiple priority issues, organizations can target specific opportunities for enhancement. This focused approach yields more substantial gains and allows for the systematic building of capabilities over time.

Regulatory confidence grows naturally from demonstrated operational stability. Regulatory agencies increasingly look beyond mere compliance to assess the maturity of quality systems. The FDA’s Quality Management Maturity (QMM) program explicitly recognizes that mature quality systems are characterized by consistent, reliable processes that ensure quality objectives and promote continual improvement.

Market differentiation emerges as companies leverage their operational stability to deliver consistently high-quality products with reliable supply. In markets where drug shortages have become commonplace, the ability to maintain stable supply becomes a significant competitive advantage.

Innovation capacity expands when operational stability frees resources and attention previously consumed by basic operational problems. Organizations with stable operations can redirect energy toward innovation in products, processes, and business models.

Operational Stability within the House of Quality Model

The House of Quality model places operational stability in a pivotal middle position. This architectural metaphor is instructive—like the middle floors of a building, operational stability both depends on what lies beneath it and supports what rises above it. Understanding this positioning helps clarify operational stability’s role in the broader quality management system.

Cultural excellence lies at the foundation of the House of Quality. This foundation provides the mindset, values, and behaviors necessary for sustained operational stability. Without this cultural foundation, attempts to establish operational stability will likely prove short-lived. At a high level of quality management maturity, organizations operate optimally with clear signals of alignment, where quality and risk management stem from and support the organization’s objectives and values.

Above operational stability in the House of Quality model sit Effectiveness and Efficiency, which together lead to Excellence at the apex. This positioning illustrates that operational stability serves as the essential platform enabling both effectiveness (doing the right things) and efficiency (doing things right). Research from the St. Gallen reports found that “plants with more effective quality systems also tend to be more efficient in their operations,” although “effectiveness only explained about 4% of the variation in efficiency scores.”

The House of Quality model also places Supplier Reliability and Design Robustness at the same level as Operational Stability. This horizontal alignment stems from these three elements work in concert as the critical middle layer of the quality system. Collectively, they provide the stable platform necessary for higher-level performance.

ElementRelationship to Operational StabilityJoint Contribution to Upper Levels
Supplier ReliabilityProvides consistent input materials essential for operational stabilityEnables predictable performance and resource optimization
Operational StabilityCreates consistent process performance regardless of normal variationsEstablishes the foundation for systematic improvement and performance optimization
Design RobustnessEnsures processes and products can withstand variation without quality impactReduces the resource burden of controlling variation, freeing capacity for improvement

The Critical Middle: Why Operational Stability Enables PQS Effectiveness and Efficiency

Operational stability functions as the essential bridge between cultural foundations and higher-level performance outcomes. This positioning highlights its critical role in translating quality culture into tangible quality performance.

Operational stability enables PQS effectiveness by creating the conditions necessary for systems to function as designed. The PQS effectiveness visible in the upper portions of the House of Quality depends on reliable execution of core processes. When operations are unstable, even well-designed quality systems fail to deliver their intended outcomes.

Operational stability enables efficiency by reducing wasteful activities associated with unstable processes. Without stability, efficiency initiatives often fail to deliver sustainable results as resources continue to be diverted to managing instability.

The relationship between operational stability and the higher levels of the House of Quality follows a hierarchical pattern. Attempts to achieve efficiency without first establishing stability typically result in fragile systems that deliver short-term gains at the expense of long-term performance. Similarly, effectiveness cannot be sustained without the foundation of stability. The model implies a necessary sequence: first cultural excellence, then operational stability (alongside supplier reliability and design robustness), followed by effectiveness and efficiency, ultimately leading to excellence.

Balancing Operational Stability with Innovation and Adaptability

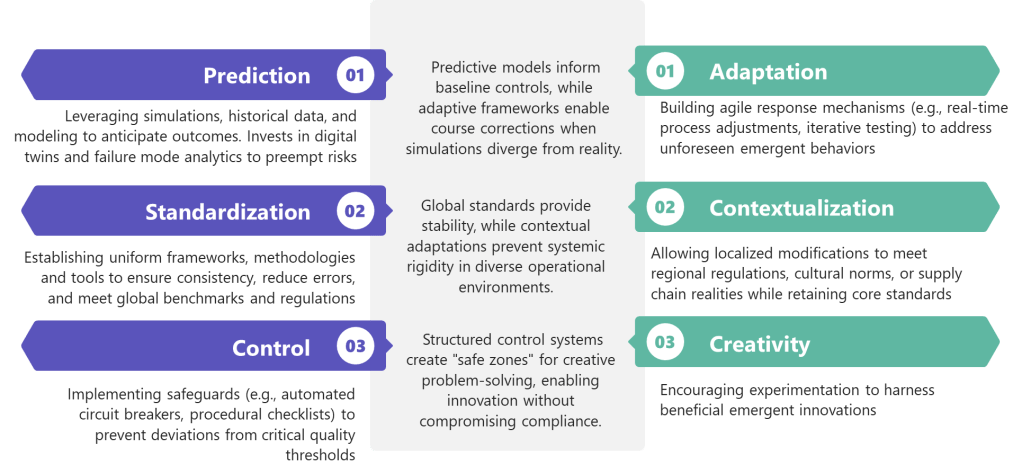
While operational stability provides numerous benefits, it must be balanced with innovation and adaptability to avoid organizational rigidity. There is a potential negative consequences of an excessive focus on efficiency, including reduced resilience and flexibility which can lead to stifled innovation and creativity.

The challenge lies in establishing sufficient stability to enable consistent performance while maintaining the adaptability necessary for continuous improvement and innovation. This balance requires thoughtful design of stability mechanisms, ensuring they control critical quality attributes without unnecessarily constraining beneficial innovation.

Process characterization plays an important role in striking this balance. By thoroughly understanding which process parameters truly impact critical quality attributes, organizations can focus stability efforts where they matter most while allowing flexibility elsewhere. This selective approach to stability creates what might be called “bounded flexibility”—freedom to innovate within well-understood boundaries.

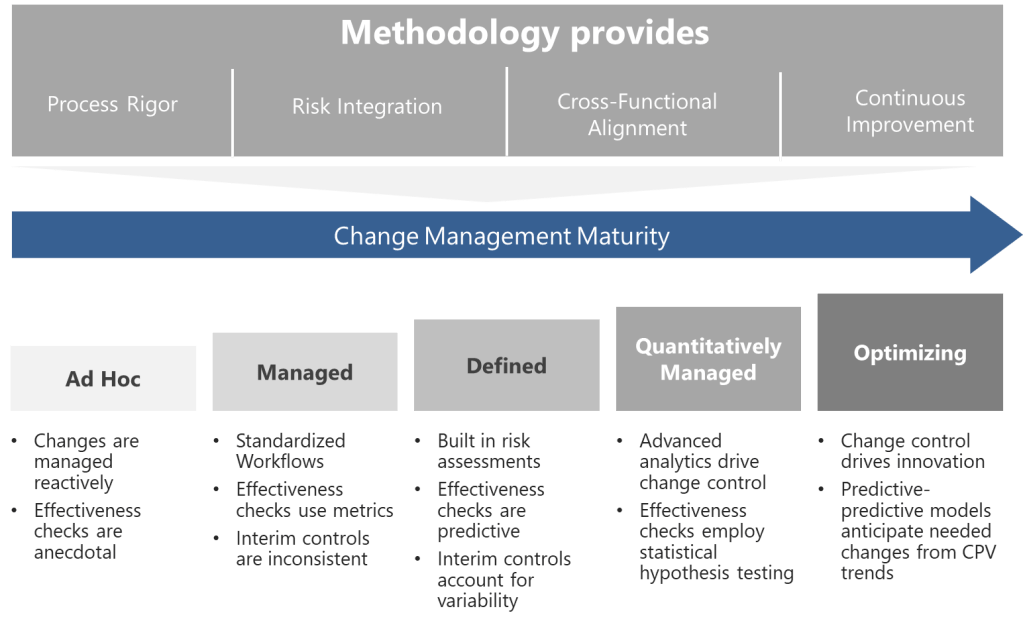
Change management systems represent another critical mechanism for balancing stability with innovation. Well-designed change management ensures that innovations are implemented in a controlled manner that preserves operational stability. ICH Q10 specifically identifies Change Management Systems as a key element of the Pharmaceutical Quality System, emphasizing its importance in maintaining this balance.

Measuring Quality Management Maturity through Operational Stability

Regulatory agencies increasingly recognize operational stability as a key indicator of Quality Management Maturity (QMM). The FDA’s QMM program evaluates organizations across multiple dimensions, with operational performance being a central consideration.

Organizations can assess their own QMM level by examining the nature and pattern of their operational stability. The following table presents a maturity progression framework related to operational stability:

Maturity LevelOperational Stability CharacteristicsEvidence Indicators
Reactive (Level 1)Unstable processes requiring constant interventionHigh deviation rates, frequent batch rejections, unpredictable cycle times
Controlled (Level 2)Basic stability achieved through rigid controls and extensive oversightLow deviation rates but high oversight costs, limited process understanding
Predictive (Level 3)Processes demonstrate inherent stability with normal variation understoodStatistical process control effective, leading indicators utilized
Proactive (Level 4)Stability maintained through systemic approaches rather than individual effortsRoot causes addressed systematically, culture of ownership evident
Innovative (Level 5)Stability serves as platform for continuous improvement and innovationStability metrics consistently excellent, resources focused on value-adding activities

This maturity progression aligns with the FDA’s emphasis on QMM as “the state attained when drug manufacturers have consistent, reliable, and robust business processes to achieve quality objectives and promote continual improvement”.

Practical Approaches to Building Operational Stability

Building operational stability requires a comprehensive approach addressing process design, organizational capabilities, and management systems. Several practical methods have proven particularly effective in pharmaceutical manufacturing environments.

Statistical Process Control (SPC) provides a systematic approach to monitoring processes and distinguishing between common cause and special cause variation. By establishing control limits based on natural process variation, SPC helps identify when processes are operating stably within expected variation versus when they experience unusual variation requiring investigation. This distinction prevents over-reaction to normal variation while ensuring appropriate response to significant deviations.

Process validation activities establish scientific evidence that a process can consistently deliver quality products. Modern validation approaches emphasize ongoing process verification rather than point-in-time demonstrations, aligning with the continuous nature of operational stability.

Root cause analysis capabilities ensure that when deviations occur, they are investigated thoroughly enough to identify and address underlying causes rather than symptoms. This prevents recurrence and systematically improves stability over time. The CAPA (Corrective Action and Preventive Action) system plays a central role in this aspect of building operational stability.

Knowledge management systems capture and make accessible the operational knowledge that supports stability. By preserving institutional knowledge and making it available when needed, these systems reduce dependence on individual expertise and create more resilient operations. This aligns with ICH Q10’s emphasis on “expanding the body of knowledge”.

Training and capability development ensure that personnel possess the necessary skills to maintain operational stability. Investment in operator capabilities pays dividends through reduced variability in human performance, often a significant factor in overall operational stability.

Operational Stability as the Engine of Quality Excellence

Operational stability occupies a pivotal position in the House of Quality model—neither the foundation nor the capstone, but the essential middle that translates cultural excellence into tangible performance outcomes. Its position reflects its dual nature: dependent on cultural foundations for sustainability while enabling the effectiveness and efficiency that lead to excellence.

The journey toward operational stability is not merely technical but cultural and organizational. It requires systematic approaches, appropriate metrics, and balanced objectives that recognize stability as a means rather than an end. Organizations that achieve robust operational stability position themselves for both regulatory confidence and market leadership.

As regulatory frameworks evolve toward Quality Management Maturity models, operational stability will increasingly serve as a differentiator between organizations. Those that establish and maintain strong operational stability will find themselves well-positioned for both compliance and competition in an increasingly demanding pharmaceutical landscape.

The House of Quality model provides a valuable framework for understanding operational stability’s role and relationships. By recognizing its position between cultural foundations and performance outcomes, organizations can develop more effective strategies for building and leveraging operational stability. The result is a more robust quality system capable of delivering not just compliance but true quality excellence that benefits patients, practitioners, and the business itself.

Emergence in the Quality System

The concept of emergence—where complex behaviors arise unpredictably from interactions among simpler components—has haunted and inspired quality professionals since Aristotle first observed that “the whole is something besides the parts.” In modern quality systems, this ancient paradox takes new form: our meticulously engineered controls often birth unintended consequences, from phantom batch failures to self-reinforcing compliance gaps. Understanding emergence isn’t just an academic exercise—it’s a survival skill in an era where hyperconnected processes and globalized supply chains amplify systemic unpredictability.

The Spectrum of Emergence: From Predictable to Baffling

Emergence manifests across a continuum of complexity, each type demanding distinct management approaches:

1. Simple Emergence
Predictable patterns emerge from component interactions, observable even in abstracted models. Consider document control workflows: while individual steps like review or approval seem straightforward, their sequencing creates emergent properties like approval cycle times. These can be precisely modeled using flowcharts or digital twins, allowing proactive optimization.

2. Weak Emergence
Behaviors become explainable only after they occur, requiring detailed post-hoc analysis. A pharmaceutical company’s CAPA system might show seasonal trends in effectiveness—a pattern invisible in individual case reviews but emerging from interactions between manufacturing schedules, audit cycles, and supplier quality fluctuations. Weak emergence often reveals itself through advanced analytics like machine learning clustering.

3. Multiple Emergence
Here, system behaviors directly contradict component properties. A validated sterile filling line passing all IQ/OQ/PQ protocols might still produce unpredictable media fill failures when integrated with warehouse scheduling software. This “emergent invalidation” stems from hidden interaction vectors that only manifest at full operational scale.

4. Strong Emergence
Consistent with components but unpredictably manifested, strong emergence plagues culture-driven quality systems. A manufacturer might implement identical training programs across global sites, yet some facilities develop proactive quality innovation while others foster blame-avoidance rituals. The difference emerges from subtle interactions between local leadership styles and corporate KPIs.

5. Spooky Emergence
The most perplexing category, where system behaviors defy both component properties and simulation. A medical device company once faced identical cleanrooms producing statistically divergent particulate counts—despite matching designs, procedures, and personnel. Root cause analysis eventually traced the emergence to nanometer-level differences in HVAC duct machining, interacting with shift-change lighting schedules to alter airflow dynamics.

TypeCharacteristicsQuality System Example
SimplePredictable through component analysisDocument control workflows
WeakExplainable post-occurrence through detailed modelingCAPA effectiveness trends
MultipleContradicts component properties, defies simulationValidated processes failing at scale
StrongConsistent with components but unpredictably manifestedCulture-driven quality behaviors
SpookyDefies component properties and simulation entirelyPhantom batch failures in identical systems

The Modern Catalysts of Emergence

Three forces amplify emergence in contemporary quality systems:

Hyperconnected Processes

IoT-enabled manufacturing equipment generates real-time data avalanches. A biologics plant’s environmental monitoring system might integrate 5,000 sensors updating every 15 seconds. The emergent property? A “data tide” that overwhelms traditional statistical process control, requiring AI-driven anomaly detection to discern meaningful signals.

Compressed Innovation Cycles

Compressed innovation cycles are transforming the landscape of product development and quality management. In this new paradigm, the pressure to deliver products faster—whether due to market demands, technological advances, or public health emergencies—means that the traditional, sequential approach to development is replaced by a model where multiple phases run in parallel. Design, manufacturing, and validation activities that once followed a linear path now overlap, requiring organizations to verify quality in real time rather than relying on staged reviews and lengthy data collection.

One of the most significant consequences of this acceleration is the telescoping of validation windows. Where stability studies and shelf-life determinations once spanned years, they are now compressed into a matter of months or even weeks. This forces quality teams to make critical decisions based on limited data, often relying on predictive modeling and statistical extrapolation to fill in the gaps. The result is what some call “validation debt”—a situation where the pace of development outstrips the accumulation of empirical evidence, leaving organizations to manage risks that may not be fully understood until after product launch.

Regulatory frameworks are also evolving in response to compressed innovation cycles. Instead of the traditional, comprehensive submission and review process, regulators are increasingly open to iterative, rolling reviews and provisional specifications that can be adjusted as more data becomes available post-launch. This shift places greater emphasis on computational evidence, such as in silico modeling and digital twins, rather than solely on physical testing and historical precedent.

The acceleration of development timelines amplifies the risk of emergent behaviors within quality systems. Temporal compression means that components and subsystems are often scaled up and integrated before they have been fully characterized or validated in isolation. This can lead to unforeseen interactions and incompatibilities that only become apparent at the system level, sometimes after the product has reached the market. The sheer volume and velocity of data generated in these environments can overwhelm traditional quality monitoring tools, making it difficult to identify and respond to critical quality attributes in a timely manner.

Another challenge arises from the collision of different quality management protocols. As organizations attempt to blend frameworks such as GMP, Agile, and Lean to keep pace with rapid development, inconsistencies and gaps can emerge. Cross-functional teams may interpret standards differently, leading to confusion or conflicting priorities that undermine the integrity of the quality system.

The systemic consequences of compressed innovation cycles are profound. Cryptic interaction pathways can develop, where components that performed flawlessly in isolation begin to interact in unexpected ways at scale. Validation artifacts—such as artificial stability observed in accelerated testing—may fail to predict real-world performance, especially when environmental variables or logistics introduce new stressors. Regulatory uncertainty increases as control strategies become obsolete before they are fully implemented, and critical process parameters may shift unpredictably during technology transfer or scale-up.

To navigate these challenges, organizations are adopting adaptive quality strategies. Predictive quality modeling, using digital twins and machine learning, allows teams to simulate thousands of potential interaction scenarios and forecast failure modes even with incomplete data. Living control systems, powered by AI and continuous process verification, enable dynamic adjustment of specifications and risk priorities as new information emerges. Regulatory agencies are also experimenting with co-evolutionary approaches, such as shared industry databases for risk intelligence and regulatory sandboxes for testing novel quality controls.

Ultimately, compressed innovation cycles demand a fundamental rethinking of quality management. The focus shifts from simply ensuring compliance to actively navigating complexity and anticipating emergent risks. Success in this environment depends on building quality systems that are not only robust and compliant, but also agile and responsive—capable of detecting, understanding, and adapting to surprises as they arise in real time.

Supply Chain Entanglement

Globalization has fundamentally transformed supply chains, creating vast networks that span continents and industries. While this interconnectedness has brought about unprecedented efficiencies and access to resources, it has also introduced a web of hidden interaction vectors—complex, often opaque relationships and dependencies that can amplify both risk and opportunity in ways that are difficult to predict or control.

At the heart of this complexity is the fragmentation of production across multiple jurisdictions. This spatial and organizational dispersion means that disruptions—whether from geopolitical tensions, natural disasters, regulatory changes, or even cyberattacks—can propagate through the network in unexpected ways, sometimes surfacing as quality issues, delays, or compliance failures far from the original source of the problem.

Moreover, the rise of powerful transnational suppliers, sometimes referred to as “Big Suppliers,” has shifted the balance of power within global value chains. These entities do not merely manufacture goods; they orchestrate entire ecosystems of production, labor, and logistics across borders. Their decisions about sourcing, labor practices, and compliance can have ripple effects throughout the supply chain, influencing not just operational outcomes but also the diffusion of norms and standards. This reconsolidation at the supplier level complicates the traditional view that multinational brands are the primary drivers of supply chain governance, revealing instead a more distributed and dynamic landscape of influence.

The hidden interaction vectors created by globalization are further obscured by limited supply chain visibility. Many organizations have a clear understanding of their direct, or Tier 1, suppliers but lack insight into the lower tiers where critical risks often reside. This opacity can mask vulnerabilities such as overreliance on a single region, exposure to forced labor, or susceptibility to regulatory changes in distant markets. As a result, companies may find themselves blindsided by disruptions that originate deep within their supply networks, only becoming apparent when they manifest as operational or reputational crises.

In this environment, traditional risk management approaches are often insufficient. The sheer scale and complexity of global supply chains demand new strategies for mapping connections, monitoring dependencies, and anticipating how shocks in one part of the world might cascade through the system. Advanced analytics, digital tools, and collaborative relationships with suppliers are increasingly essential for uncovering and managing these hidden vectors. Ultimately, globalization has made supply chains more efficient but also more fragile, with hidden interaction points that require constant vigilance and adaptive management to ensure resilience and sustained performance.

Emergence and the Success/Failure Space: Navigating Complexity in System Design

The interplay between emergence and success/failure space reveals a fundamental tension in managing complex systems: our ability to anticipate outcomes is constrained by both the unpredictability of component interactions and the inherent asymmetry between defining success and preventing failure. Emergence is not merely a technical challenge, but a manifestation of how systems oscillate between latent potential and realized risk.

The Duality of Success and Failure Spaces

Systems exist in a continuum where:

  • Success space encompasses infinite potential pathways to desired outcomes, characterized by continuous variables like efficiency and adaptability.
  • Failure space contains discrete, identifiable modes of dysfunction, often easier to consensus-build around than nebulous success metrics.

Emergence complicates this duality. While traditional risk management focuses on cataloging failure modes, emergent behaviors—particularly strong emergence—defy this reductionist approach. Failures can arise not from component breakdowns, but from unexpected couplings between validated subsystems operating within design parameters. This creates a paradox: systems optimized for success space metrics (e.g., throughput, cost efficiency) may inadvertently amplify failure space risks through emergent interactions.

Emergence as a Boundary Phenomenon

Emergent behaviors manifest at the interface of success and failure spaces:

  1. Weak Emergence
    Predictable through detailed modeling, these behaviors align with traditional failure space analysis. For example, a pharmaceutical plant might anticipate temperature excursion risks in cold chain logistics through FMEA, implementing redundant monitoring systems.
  2. Strong Emergence
    Unpredictable interactions that bypass conventional risk controls. Consider a validated ERP system that unexpectedly generates phantom batch records when integrated with new MES modules—a failure emerging from software handshake protocols never modeled during individual system validation.

To return to a previous analogy of house purchasing to illustrate this dichotomy: while we can easily identify foundation cracks (failure space), defining the “perfect home” (success space) remains subjective. Similarly, strong emergence represents foundation cracks in system architectures that only become visible after integration.

Reconciling Spaces Through Emergence-Aware Design

To manage this complexity, organizations must:

1. Map Emergence Hotspots
Emergence hotspots represent critical junctures where localized interactions generate disproportionate system-wide impacts—whether beneficial innovations or cascading failures. Effectively mapping these zones requires integrating spatial, temporal, and contextual analytics to navigate the interplay between component behaviors and collective outcomes..

2. Implement Ambidextrous Monitoring
Combine failure space triggers (e.g., sterility breaches) with success space indicators (e.g., adaptive process capability) – pairing traditional deviation tracking with positive anomaly detection systems that flag beneficial emergent patterns.

3. Cultivate Graceful Success

Graceful success represents a paradigm shift from failure prevention to intelligent adaptation—creating systems that maintain core functionality even when components falter. Rooted in resilience engineering principles, this approach recognizes that perfect system reliability is unattainable, and instead focuses on designing architectures that fail into high-probability success states while preserving safety and quality.

  1. Controlled State Transitions: Systems default to reduced-but-safe operational modes during disruptions.
  2. Decoupled Subsystem Design: Modular architectures prevent cascading failures. This implements the four layers of protection philosophy through physical and procedural isolation.
  3. Dynamic Risk Reconfiguration: Continuously reassess risk priorities using real-time data brings the concept of fail forward into structured learning modes.

This paradigm shift from failure prevention to failure navigation represents the next evolution of quality systems. By designing for graceful success, organizations transform disruptions into structured learning opportunities while maintaining continuous value delivery—a critical capability in an era of compressed innovation cycles and hyperconnected supply chains.

The Emergence Literacy Imperative

This evolution demands rethinking Deming’s “profound knowledge” for the complexity age. Just as failure space analysis provides clearer boundaries, understanding emergence gives us lenses to see how those boundaries shift through system interactions. The organizations thriving in this landscape aren’t those eliminating surprises, but those building architectures where emergence more often reveals novel solutions than catastrophic failures—transforming the success/failure continuum into a discovery engine rather than a risk minefield.

Strategies for Emergence-Aware Quality Leadership

1. Cultivate Systemic Literacy
Move beyond component-level competence. Trains quality employees in basic complexity science..

2. Design for Graceful Failure
When emergence inevitably occurs, systems should fail into predictable states. For example, you can redesign batch records with:

  • Modular sections that remain valid if adjacent components fail
  • Context-aware checklists that adapt requirements based on real-time bioreactor data
  • Decoupled approvals allowing partial releases while investigating emergent anomalies

3. Harness Beneficial Emergence
The most advanced quality systems intentionally foster positive emergence.

The Emergence Imperative

Future-ready quality professionals will balance three tensions:

  • Prediction AND Adaptation : Investing in simulation while building response agility
  • Standardization AND Contextualization : Maintaining global standards while allowing local adaptation
  • Control AND Creativity : Preventing harm while nurturing beneficial emergence

The organizations thriving in this new landscape aren’t those with perfect compliance records, but those that rapidly detect and adapt to emergent patterns. They understand that quality systems aren’t static fortresses, but living networks—constantly evolving, occasionally surprising, and always revealing new paths to excellence.

In this light, Aristotle’s ancient insight becomes a modern quality manifesto: Our systems will always be more than the sum of their parts. The challenge—and opportunity—lies in cultivating the wisdom to guide that “more” toward better outcomes.

Continuous Process Verification (CPV) Methodology and Tool Selection: A Framework Guided by FDA Process Validation

Continuous Process Verification (CPV) represents the final and most dynamic stage of the FDA’s process validation lifecycle, designed to ensure manufacturing processes remain validated during routine production. The methodology for CPV and the selection of appropriate tools are deeply rooted in the FDA’s 2011 guidance, Process Validation: General Principles and Practices, which emphasizes a science- and risk-based approach to quality assurance. This blog post examines how CPV methodologies align with regulatory frameworks and how tools are selected to meet compliance and operational objectives.

3 stages of process validation, with CPV in green as the 3rd stage

CPV Methodology: Anchored in the FDA’s Lifecycle Approach

The FDA’s process validation framework divides activities into three stages: Process Design (Stage 1), Process Qualification (Stage 2), and Continued Process Verification (Stage 3). CPV, as Stage 3, is not an isolated activity but a continuation of the knowledge gained in earlier stages. This lifecycle approach is our framework.

Stage 1: Process Design

During Stage 1, manufacturers define Critical Quality Attributes (CQAs) and Critical Process Parameters (CPPs) through risk assessments and experimental design. This phase establishes the scientific basis for monitoring and control strategies. For example, if a parameter’s variability is inherently low (e.g., clustering near the Limit of Quantification, or LOQ), this knowledge informs later decisions about CPV tools.

Stage 2: Process Qualification

Stage 2 confirms that the process, when operated within established parameters, consistently produces quality products. Data from this stage—such as process capability indices (Cpk/Ppk)—provide baseline metrics for CPV. For instance, a high Cpk (>2) for a parameter near LOQ signals that traditional control charts may be inappropriate due to limited variability.

Stage 3: Continued Process Verification

CPV methodology is defined by two pillars:

  1. Ongoing Monitoring: Continuous collection and analysis of CPP/CQA data.
  2. Adaptive Control: Adjustments to maintain process control, informed by statistical and risk-based insights.

Regulatory agencies require that CPV methodologies must be tailored to the process’s unique characteristics. For example, a parameter with data clustered near LOQ (as in the case study) demands a different approach than one with normal variability.

Selecting CPV Tools: Aligning with Data and Risk

The framework emphasizes that CPV tools must be scientifically justified, with selection criteria based on data suitability, risk criticality, and regulatory alignment.

Data Suitability Assessments

Data suitability assessments form the bedrock of effective Continuous Process Verification (CPV) programs, ensuring that monitoring tools align with the statistical and analytical realities of the process. These assessments are not merely technical exercises but strategic activities rooted in regulatory expectations, scientific rigor, and risk management. Below, we explore the three pillars of data suitability—distribution analysis, process capability evaluation, and analytical performance considerations—and their implications for CPV tool selection.

The foundation of any statistical monitoring system lies in understanding the distribution of the data being analyzed. Many traditional tools, such as control charts, assume that data follows a normal (Gaussian) distribution. This assumption underpins the calculation of control limits (e.g., ±3σ) and the interpretation of rule violations. To validate this assumption, manufacturers employ tests such as the Shapiro-Wilk test or Anderson-Darling test, which quantitatively assess normality. Visual tools like Q-Q plots or histograms complement these tests by providing intuitive insights into data skewness, kurtosis, or clustering.

When data deviates significantly from normality—common in parameters with values clustered near detection or quantification limits (e.g., LOQ)—the use of parametric tools like control charts becomes problematic. For instance, a parameter with 95% of its data below the LOQ may exhibit a left-skewed distribution, where the calculated mean and standard deviation are distorted by the analytical method’s noise rather than reflecting true process behavior. In such cases, traditional control charts generate misleading signals, such as Rule 1 violations (±3σ), which flag analytical variability rather than process shifts.

To address non-normal data, manufacturers must transition to non-parametric methods that do not rely on distributional assumptions. Tolerance intervals, which define ranges covering a specified proportion of the population with a given confidence level, are particularly useful for skewed datasets. For example, a 95/99 tolerance interval (95% of data within 99% confidence) can replace ±3σ limits for non-normal data, reducing false positives. Bootstrapping—a resampling technique—offers another alternative, enabling robust estimation of control limits without assuming normality.

Process Capability: Aligning Tools with Inherent Variability

Process capability indices, such as Cp and Cpk, quantify a parameter’s ability to meet specifications relative to its natural variability. A high Cp (>2) indicates that the process variability is small compared to the specification range, often resulting from tight manufacturing controls or robust product designs. While high capability is desirable for quality, it complicates CPV tool selection. For example, a parameter with a Cp of 3 and data clustered near the LOQ will exhibit minimal variability, rendering control charts ineffective. The narrow spread of data means that control limits shrink, increasing the likelihood of false alarms from minor analytical noise.

In such scenarios, traditional SPC tools like control charts lose their utility. Instead, manufacturers should adopt attribute-based monitoring or batch-wise trending. Attribute-based approaches classify results as pass/fail against predefined thresholds (e.g., LOQ breaches), simplifying signal interpretation. Batch-wise trending aggregates data across production lots, identifying shifts over time without overreacting to individual outliers. For instance, a manufacturer with a high-capability dissolution parameter might track the percentage of batches meeting dissolution criteria monthly, rather than plotting individual tablet results.

The FDA’s emphasis on risk-based monitoring further supports this shift. ICH Q9 guidelines encourage manufacturers to prioritize resources for high-risk parameters, allowing low-risk, high-capability parameters to be monitored with simpler tools. This approach reduces administrative burden while maintaining compliance.

Analytical Performance: Decoupling Noise from Process Signals

Parameters operating near analytical limits of detection (LOD) or quantification (LOQ) present unique challenges. At these extremes, measurement systems contribute significant variability, often overshadowing true process signals. For example, a purity assay with an LOQ of 0.1% may report values as “<0.1%” for 98% of batches, creating a dataset dominated by the analytical method’s imprecision. In such cases, failing to decouple analytical variability from process performance leads to misguided investigations and wasted resources.

To address this, manufacturers must isolate analytical variability through dedicated method monitoring programs. This involves:

  1. Analytical Method Validation: Rigorous characterization of precision, accuracy, and detection capabilities (e.g., determining the Practical Quantitation Limit, or PQL, which reflects real-world method performance).
  2. Separate Trending: Implementing control charts or capability analyses for the analytical method itself (e.g., monitoring LOQ stability across batches).
  3. Threshold-Based Alerts: Replacing statistical rules with binary triggers (e.g., investigating only results above LOQ).

For example, a manufacturer analyzing residual solvents near the LOQ might use detection capability indices to set action limits. If the analytical method’s variability (e.g., ±0.02% at LOQ) exceeds the process variability, threshold alerts focused on detecting values above 0.1% + 3σ_analytical would provide more meaningful signals than traditional control charts.

Integration with Regulatory Expectations

Regulatory agencies, including the FDA and EMA, mandate that CPV methodologies be “scientifically sound” and “statistically valid” (FDA 2011 Guidance). This requires documented justification for tool selection, including:

  • Normality Testing: Evidence that data distribution aligns with tool assumptions (e.g., Shapiro-Wilk test results).
  • Capability Analysis: Cp/Cpk values demonstrating the rationale for simplified monitoring.
  • Analytical Validation Data: Method performance metrics justifying decoupling strategies.

A 2024 FDA warning letter highlighted the consequences of neglecting these steps. A firm using control charts for non-normal dissolution data received a 483 observation for lacking statistical rationale, underscoring the need for rigor in data suitability assessments.

Case Study Application:
A manufacturer monitoring a CQA with 98% of data below LOQ initially used control charts, triggering frequent Rule 1 violations (±3σ). These violations reflected analytical noise, not process shifts. Transitioning to threshold-based alerts (investigating only LOQ breaches) reduced false positives by 72% while maintaining compliance.

Risk-Based Tool Selection

The ICH Q9 Quality Risk Management (QRM) framework provides a structured methodology for identifying, assessing, and controlling risks to pharmaceutical product quality, with a strong emphasis on aligning tool selection with the parameter’s impact on patient safety and product efficacy. Central to this approach is the principle that the rigor of risk management activities—including the selection of tools—should be proportionate to the criticality of the parameter under evaluation. This ensures resources are allocated efficiently, focusing on high-impact risks while avoiding overburdening low-risk areas.

Prioritizing Tools Through the Lens of Risk Impact

The ICH Q9 framework categorizes risks based on their potential to compromise product quality, guided by factors such as severity, detectability, and probability. Parameters with a direct impact on critical quality attributes (CQAs)—such as potency, purity, or sterility—are classified as high-risk and demand robust analytical tools. Conversely, parameters with minimal impact may require simpler methods. For example:

  • High-Impact Parameters: Use Failure Mode and Effects Analysis (FMEA) or Fault Tree Analysis (FTA) to dissect failure modes, root causes, and mitigation strategies.
  • Medium-Impact Parameters: Apply a tool such as a PHA.
  • Low-Impact Parameters: Utilize checklists or flowcharts for basic risk identification.

This tiered approach ensures that the complexity of the tool matches the parameter’s risk profile.

  1. Importance: The parameter’s criticality to patient safety or product efficacy.
  2. Complexity: The interdependencies of the system or process being assessed.
  3. Uncertainty: Gaps in knowledge about the parameter’s behavior or controls.

For instance, a high-purity active pharmaceutical ingredient (API) with narrow specification limits (high importance) and variable raw material inputs (high complexity) would necessitate FMEA to map failure modes across the supply chain. In contrast, a non-critical excipient with stable sourcing (low uncertainty) might only require a simplified risk ranking matrix.

Implementing a Risk-Based Approach

1. Assess Parameter Criticality

Begin by categorizing parameters based on their impact on CQAs, as defined during Stage 1 (Process Design) of the FDA’s validation lifecycle. Parameters are classified as:

  • Critical: Directly affecting safety/efficacy
  • Key: Influencing quality but not directly linked to safety
  • Non-Critical: No measurable impact on quality

This classification informs the depth of risk assessment and tool selection.

2. Select Tools Using the ICU Framework
  • Importance-Driven Tools: High-importance parameters warrant tools that quantify risk severity and detectability. FMEA is ideal for linking failure modes to patient harm, while Statistical Process Control (SPC) charts monitor real-time variability.
  • Complexity-Driven Tools: For multi-step processes (e.g., bioreactor operations), HACCP identifies critical control points, while Ishikawa diagrams map cause-effect relationships.
  • Uncertainty-Driven Tools: Parameters with limited historical data (e.g., novel drug formulations) benefit from Bayesian statistical models or Monte Carlo simulations to address knowledge gaps.
3. Document and Justify Tool Selection

Regulatory agencies require documented rationale for tool choices. For example, a firm using FMEA for a high-risk sterilization process must reference its ability to evaluate worst-case scenarios and prioritize mitigations. This documentation is typically embedded in Quality Risk Management (QRM) Plans or validation protocols.

Integration with Living Risk Assessments

Living risk assessments are dynamic, evolving documents that reflect real-time process knowledge and data. Unlike static, ad-hoc assessments, they are continually updated through:

1. Ongoing Data Integration

Data from Continual Process Verification (CPV)—such as trend analyses of CPPs/CQAs—feeds directly into living risk assessments. For example, shifts in fermentation yield detected via SPC charts trigger updates to bioreactor risk profiles, prompting tool adjustments (e.g., upgrading from checklists to FMEA).

2. Periodic Review Cycles

Living assessments undergo scheduled reviews (e.g., biannually) and event-driven updates (e.g., post-deviation). A QRM Master Plan, as outlined in ICH Q9(R1), orchestrates these reviews by mapping assessment frequencies to parameter criticality. High-impact parameters may be reviewed quarterly, while low-impact ones are assessed annually.

3. Cross-Functional Collaboration

Quality, manufacturing, and regulatory teams collaborate to interpret CPV data and update risk controls. For instance, a rise in particulate matter in vials (detected via CPV) prompts a joint review of filling line risk assessments, potentially revising tooling from HACCP to FMEA to address newly identified failure modes.

Regulatory Expectations and Compliance

Regulatory agencies requires documented justification for CPV tool selection, emphasizing:

  • Protocol Preapproval: CPV plans must be submitted during Stage 2, detailing tool selection criteria.
  • Change Control: Transitions between tools (e.g., SPC → thresholds) require risk assessments and documentation.
  • Training: Staff must be proficient in both traditional (e.g., Shewhart charts) and modern tools (e.g., AI).

A 2024 FDA warning letter cited a firm for using control charts on non-normal data without validation, underscoring the consequences of poor tool alignment.

A Framework for Adaptive Excellence

The FDA’s CPV framework is not prescriptive but principles-based, allowing flexibility in methodology and tool selection. Successful implementation hinges on:

  1. Science-Driven Decisions: Align tools with data characteristics and process capability.
  2. Risk-Based Prioritization: Focus resources on high-impact parameters.
  3. Regulatory Agility: Justify tool choices through documented risk assessments and lifecycle data.

CPV is a living system that must evolve alongside processes, leveraging tools that balance compliance with operational pragmatism. By anchoring decisions in the FDA’s lifecycle approach, manufacturers can transform CPV from a regulatory obligation into a strategic asset for quality excellence.

Quality Systems as Living Organizations: A Framework for Adaptive Excellence

The allure of shiny new tools in quality management is undeniable. Like magpies drawn to glittering objects, professionals often collect methodologies and technologies without a cohesive strategy. This “magpie syndrome” creates fragmented systems—FMEA here, 5S there, Six Sigma sprinkled in—that resemble disjointed toolkits rather than coherent ecosystems. The result? Confusion, wasted resources, and quality systems that look robust on paper but crumble under scrutiny. The antidote lies in reimagining quality systems not as static machines but as living organizations that evolve, adapt, and thrive.

The Shift from Machine Logic to Organic Design

Traditional quality systems mirror 20th-century industrial thinking: rigid hierarchies, linear processes, and documents that gather dust. These systems treat organizations as predictable machines, relying on policies to command and procedures to control. Yet living systems—forests, coral reefs, cities—operate differently. They self-organize around shared purpose, adapt through feedback, and balance structure with spontaneity. Deming foresaw this shift. His System of Profound Knowledge—emphasizing psychology, variation, and systems thinking—aligns with principles of living systems: coherence without control, stability with flexibility.

At the heart of this transformation is the recognition that quality emerges not from compliance checklists but from the invisible architecture of relationships, values, and purpose. Consider how a forest ecosystem thrives: trees communicate through fungal networks, species coexist through symbiotic relationships, and resilience comes from diversity, not uniformity. Similarly, effective quality systems depend on interconnected elements working in harmony, guided by a shared “DNA” of purpose.

The Four Pillars of Living Quality Systems

  1. Purpose as Genetic Code
    Every living system has inherent telos—an aim that guides adaptation. For quality systems, this translates to policies that act as genetic non-negotiables. For pharmaceuticals and medical devices this is “patient safety above all.”. This “DNA” allowed teams to innovate while maintaining adherence to core requirements, much like genes express differently across environments without compromising core traits.
  2. Self-Organization Through Frameworks
    Complex systems achieve order through frameworks as guiding principles. Coherence emerges from shared intent. Deming’s PDSA cycles and emphasis on psychological safety create similar conditions for self-organization.
  3. Documentation as a Nervous System
    The enhanced document pyramid—policies, programs, procedures, work instructions, records—acts as an organizational nervous system. Adding a “program” level between policies and procedures bridges the gap between intent and action and can transform static documents into dynamic feedback loops.
  4. Maturity as Evolution
    Living systems evolve through natural selection. Maturity models serve as evolutionary markers:
    • Ad-hoc (Primordial): Tools collected like random mutations.
    • Managed (Organized): Basic processes stabilize.
    • Standardized (Complex): Methodologies cohere.
    • Predictable (Adaptive): Issues are anticipated.
    • Optimizing (Evolutionary): Improvement fuels innovation.

Cultivating Organizational Ecosystems: Eight Principles

Living quality systems thrive when guided by eight principles:

  • Balance: Serving patients, employees, and regulators equally.
  • Congruence: Aligning tools with culture.
  • Human-Centered: Designing for joy—automating drudgery, amplifying creativity.
  • Learning: Treating deviations as data, not failures.
  • Sustainability: Planning for decade-long impacts, not quarterly audits.
  • Elegance: Simplifying until it hurts, then relaxing slightly.
  • Coordination: Cross-pollinating across the organization
  • Convenience: Making compliance easier than non-compliance.

These principles operationalize Deming’s wisdom. Driving out fear (Point 8) fosters psychological safety, while breaking down barriers (Point 9) enables cross-functional symbiosis.

The Quality Professional’s New Role: Gardener, Not Auditor

Quality professionals must embrace a transformative shift in their roles. Instead of functioning as traditional enforcers or document controllers, we are now called to act as stewards of living systems. This evolution requires a mindset change from one of rigid oversight to one of nurturing growth and adaptability. The modern quality professional takes on new identities such as coach, data ecologist, and systems immunologist—roles that emphasize collaboration, learning, and resilience.

To thrive in this new capacity, practical steps must be taken. First, it is essential to prune toxic practices by eliminating fear-driven reporting mechanisms and redundant tools that stifle innovation and transparency. Quality professionals should focus on fostering trust and streamlining processes to create healthier organizational ecosystems. Next, they must plant feedback loops by embedding continuous learning into daily workflows. For instance, incorporating post-meeting retrospectives can help teams reflect on successes and challenges, ensuring ongoing improvement. Lastly, cross-pollination is key to cultivating diverse perspectives and skills. Rotating staff between quality assurance, operations, and research and development encourages knowledge sharing and breaks down silos, ultimately leading to more integrated and innovative solutions.

By adopting this gardener-like approach, quality professionals can nurture the growth of resilient systems that are better equipped to adapt to change and complexity. This shift not only enhances organizational performance but also fosters a culture of continuous improvement and collaboration.

Thriving, Not Just Surviving

Quality systems that mimic life—not machinery—turn crises into growth opportunities. As Deming noted, “Learning is not compulsory… neither is survival.” By embracing living system principles, we create environments where survival is the floor, and excellence is the emergent reward.

Start small: Audit one process using living system criteria. Replace one control mechanism with a self-organizing principle. Share learnings across your organizational “species.” The future of quality isn’t in thicker binders—it’s in cultivating systems that breathe, adapt, and evolve.

Building a Maturity Model for Pharmaceutical Change Control: Integrating ICH Q8-Q10

ICH Q8 (Pharmaceutical Development), Q9 (Quality Risk Management), and Q10 (Pharmaceutical Quality System) provide a comprehensive framework for transforming change management from a reactive compliance exercise into a strategic enabler of quality and innovation.

The ICH Q8-Q10 triad is my favorite framework pharmaceutical quality systems: Q8’s Quality by Design (QbD) principles establish proactive identification of critical quality attributes (CQAs) and design spaces, shifting the paradigm from retrospective testing to prospective control; Q9 provides the scaffolding for risk-based decision-making, enabling organizations to prioritize resources based on severity, occurrence, and detectability of risks; and, Q10 closes the loop by embedding these concepts into a lifecycle-oriented quality system, emphasizing knowledge management and continual improvement.

These guidelines create a robust foundation for change control. Q8 ensures changes align with product and process understanding, Q9 enables risk-informed evaluation, and Q10 mandates systemic integration across the product lifecycle. This triad rejects the notion of change control as a standalone procedure, instead positioning it as a manifestation of organizational quality culture.

The PIC/S Perspective: Risk-Based Change Management

The PIC/S guidance (PI 054-1) reinforces ICH principles by offering a methodology that emphasizes effectiveness as the cornerstone of change management. It outlines four pillars:

  1. Proposal and Impact Assessment: Systematic evaluation of cross-functional impacts, including regulatory filings, process interdependencies, and stakeholder needs.
  2. Risk Classification: Stratifying changes as critical/major/minor based on potential effects on product quality, patient safety, and data integrity.
  3. Implementation with Interim Controls: Bridging current and future states through mitigations like enhanced monitoring or temporary procedural adjustments.
  4. Effectiveness Verification: Post-implementation reviews using metrics aligned with change objectives, supported by tools like statistical process control (SPC) or continued process verification (CPV).

This guidance operationalizes ICH concepts by mandating traceability from change rationale to verified outcomes, creating accountability loops that prevent “paper compliance.”

A Five-Level Maturity Model for Change Control

Building on these foundations, I propose a maturity model that evaluates organizational capability across four dimensions, each addressing critical aspects of pharmaceutical change control systems:

  1. Process Rigor
    • Assesses the standardization, documentation, and predictability of change control workflows.
    • Higher maturity levels incorporate design space utilization (ICH Q8), automated risk thresholds, and digital tools like Monte Carlo simulations for predictive impact modeling.
    • Progresses from ad hoc procedures to AI-driven, self-correcting systems that preemptively identify necessary changes via CPV trends.
  2. Risk Integration
    • Measures how effectively quality risk management (ICH Q9) is embedded into decision-making.
    • Includes risk-based classification (critical/major/minor), use of the right tool, and dynamic risk thresholds tied to process capability indices (CpK/PpK).
    • At advanced levels, machine learning models predict failure probabilities, enabling proactive mitigations.
  3. Cross-Functional Alignment
    • Evaluates collaboration between QA, regulatory, manufacturing, and supply chain teams during change evaluation.
    • Maturity is reflected in centralized review boards, real-time data integration (e.g., ERP/LIMS connectivity), and harmonized procedures across global sites.
  4. Continuous Improvement
    • Tracks the organization’s ability to learn from past changes and innovate.
    • Incorporates metrics like “first-time regulatory acceptance rate” and “change-related deviation reduction.”
    • Top-tier organizations use post-change data to refine design spaces and update control strategies.

Level 1: Ad Hoc (Chaotic)

At this initial stage, changes are managed reactively. Procedures exist but lack standardization—departments use disparate tools, and decisions rely on individual expertise rather than systematic risk assessment. Effectiveness checks are anecdotal, often reduced to checkbox exercises. Organizations here frequently experience regulatory citations related to undocumented changes or inadequate impact assessments.

Progression Strategy: Begin by mapping all change types and aligning them with ICH Q9 risk principles. Implement a centralized change control procedure with mandatory risk classification.

Level 2: Managed (Departmental)

Changes follow standardized workflows within functions, but silos persist. Risk assessments are performed but lack cross-functional input, leading to unanticipated impacts. Effectiveness checks use basic metrics (e.g., # of changes), yet data analysis remains superficial. Interim controls are applied inconsistently, often overcompensating with excessive conservatism or being their in name only.

Progression Strategy: Establish cross-functional change review boards. Introduce the right level of formality of risk for changes and integrate CPV data into effectiveness reviews.

Level 3: Defined (Integrated)

The organization achieves horizontal integration. Changes trigger automated risk assessments using predefined criteria from ICH Q8 design spaces. Effectiveness checks leverage predictive analytics, comparing post-change performance against historical baselines. Knowledge management systems capture lessons learned, enabling proactive risk identification. Interim controls are fully operational, with clear escalation paths for unexpected variability.

Progression Strategy: Develop a unified change control platform that connects to manufacturing execution systems (MES) and laboratory information management systems (LIMS). Implement real-time dashboards for change-related KPIs.

Level 4: Quantitatively Managed (Predictive)

Advanced analytics drive change control. Machine learning models predict change impacts using historical data, reducing assessment timelines. Risk thresholds dynamically adjust based on process capability indices (CpK/PpK). Effectiveness checks employ statistical hypothesis testing, with sample sizes calculated via power analysis. Regulatory submissions for post-approval changes are partially automated through ICH Q12-enabled platforms.

Progression Strategy: Pilot digital twins for high-complexity changes, simulating outcomes before implementation. Formalize partnerships with regulators for parallel review of major changes.

Level 5: Optimizing (Self-Correcting)

Change control becomes a source of innovation. Predictive-predictive models anticipate needed changes from CPV trends. Change histories provide immutable audit trails across the product. Autonomous effectiveness checks trigger corrective actions via integrated CAPA systems. The organization contributes to industry-wide maturity through participation in various consensus standard and professional associations.

Progression Strategy: Institutionalize a “change excellence” function focused on benchmarking against emerging technologies like AI-driven root cause analysis.

Methodological Pillars: From Framework to Practice

Translating this maturity model into practice requires three methodological pillars:

1. QbD-Driven Change Design
Leverage Q8’s design space concepts to predefine allowable change ranges. Changes outside the design space trigger Q9-based risk assessments, evaluating impacts on CQAs using tools like cause-effect matrices. Fully leverage Q12.

2. Risk-Based Resourcing
Apply Q9’s risk prioritization to allocate resources proportionally. A minor packaging change might require a 2-hour review by QA, while a novel drug product process change engages R&D, regulatory, and supply chain teams in a multi-week analysis. Remember, the “level of effort commensurate with risk” prevents over- or under-management.

3. Closed-Loop Verification
Align effectiveness checks with Q10’s lifecycle approach. Post-change monitoring periods are determined by statistical confidence levels rather than fixed durations. For instance, a formulation change might require 10 consecutive batches within CpK >1.33 before closure. PIC/S-mandated evaluations of unintended consequences are automated through anomaly detection algorithms.

Overcoming Implementation Barriers

Cultural and technical challenges abound in maturity progression. Common pitfalls include:

  • Overautomation: Implementing digital tools before standardizing processes, leading to “garbage in, gospel out” scenarios.
  • Risk Aversion: Misapplying Q9 to justify excessive controls, stifling continual improvement.
  • Siloed Metrics: Tracking change closure rates without assessing long-term quality impacts.

Mitigation strategies involve:

  • Co-developing procedures with frontline staff to ensure usability.
  • Training on “right-sized” QRM—using ICH Q9 to enable, not hinder, innovation.
  • Adopting balanced scorecards that link change metrics to business outcomes (e.g., time-to-market, cost of quality).

The Future State: Change Control as a Competitive Advantage

Change control maturity increasingly differentiates market leaders. Organizations reaching Level 5 capabilities can leverage:

  • Adaptive Regulatory Strategies: Real-time submission updates via ICH Q12’s Established Conditions framework.
  • AI-Enhanced Decision Making: Predictive analytics for change-related deviations, reducing downstream quality events.
  • Patient-Centric Changes: Direct integration of patient-reported outcomes (PROs) into change effectiveness criteria.

Maturity as a Journey, Not a Destination

The proposed model provides a roadmap—not a rigid prescription—for advancing change control. By grounding progression in ICH Q8-Q10 and PIC/S principles, organizations can systematically enhance their change agility while maintaining compliance. Success requires viewing maturity not as a compliance milestone but as a cultural commitment to excellence, where every change becomes an opportunity to strengthen quality and accelerate innovation.

In an era of personalized medicines and decentralized manufacturing, the ability to manage change effectively will separate thriving organizations from those merely surviving. The journey begins with honest self-assessment against this model and a willingness to invest in the systems, skills, and culture that make maturity possible.