Business Process Management: The Symbiosis of Framework and Methodology – A Deep Dive into Process Architecture’s Strategic Role

Building on our foundational exploration of process mapping as a scaling solution and the interplay of methodologies, frameworks, and tools in quality management, it is essential to position Business Process Management (BPM) as a dynamic discipline that harmonizes structural guidance with actionable execution. At its core, BPM functions as both an adaptive enterprise framework and a prescriptive methodology, with process architecture as the linchpin connecting strategic vision to operational reality. By integrating insights from our prior examinations of process landscapes, SIPOC analysis, and systems thinking principles, we unravel how organizations can leverage BPM’s dual nature to drive scalable, sustainable transformation.

BPM’s Dual Identity: Structural Framework and Execution Pathway

Business Process Management operates simultaneously as a conceptual framework and an implementation methodology. As a framework, BPM establishes the scaffolding for understanding how processes interact across an organization. It provides standardized visualization templates like BPMN (Business Process Model and Notation) and value chain models, which create a common language for cross-functional collaboration. This framework perspective aligns with our earlier discussion of process landscapes, where hierarchical diagrams map core processes to supporting activities, ensuring alignment with strategic objectives.

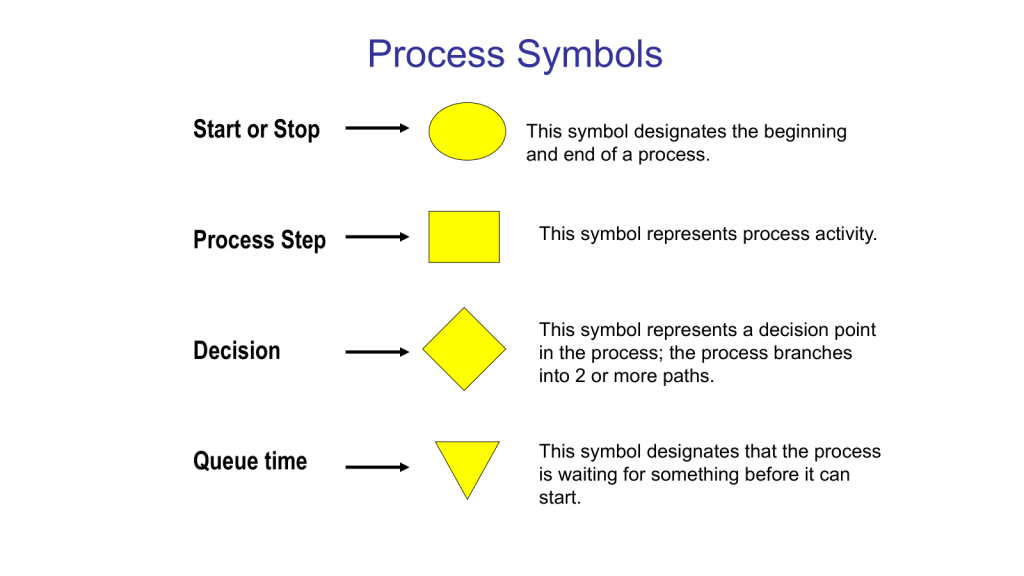
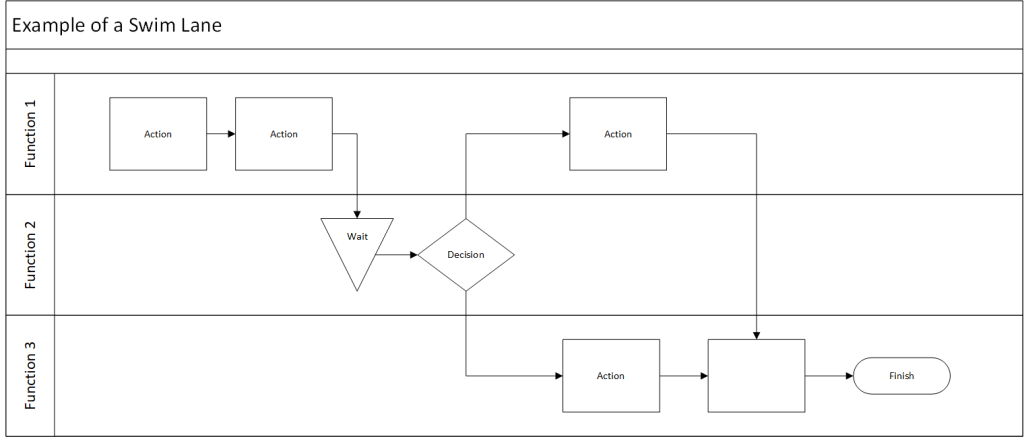
Yet BPM transcends abstract structuring by embedding methodological rigor through its improvement lifecycle. This lifecycle-spanning scoping, modeling, automation, monitoring, and optimization-mirrors the DMAIC (Define, Measure, Analyze, Improve, Control) approach applied in quality initiatives. For instance, the “As-Is” modeling phase employs swimlane diagrams to expose inefficiencies in handoffs between departments, while the “To-Be” design phase leverages BPMN simulations to stress-test proposed workflows. These methodological steps operationalize the framework, transforming architectural blueprints into executable workflows.

The interdependence between BPM’s framework and methodology becomes evident in regulated industries like pharmaceuticals, where process architectures must align with ICH Q10 guidelines while methodological tools like change control protocols ensure compliance during execution. This duality enables organizations to maintain strategic coherence while adapting tactical approaches to shifting demands.

Process Architecture: The Structural Catalyst for Scalable Operations

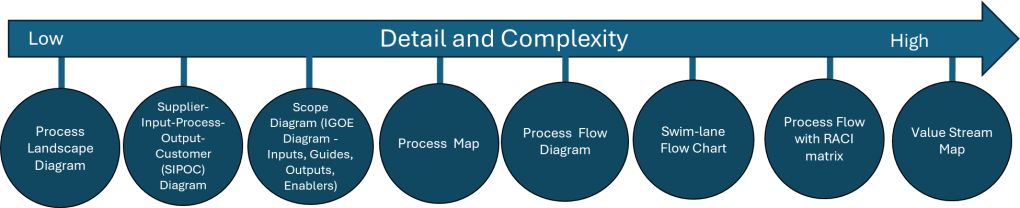
Process architecture transcends mere process cataloging; it is the engineered backbone that ensures organizational processes collectively deliver value without redundancy or misalignment. Drawing from our exploration of process mapping as a scaling solution, effective architectures integrate three critical layers:

Value Chain
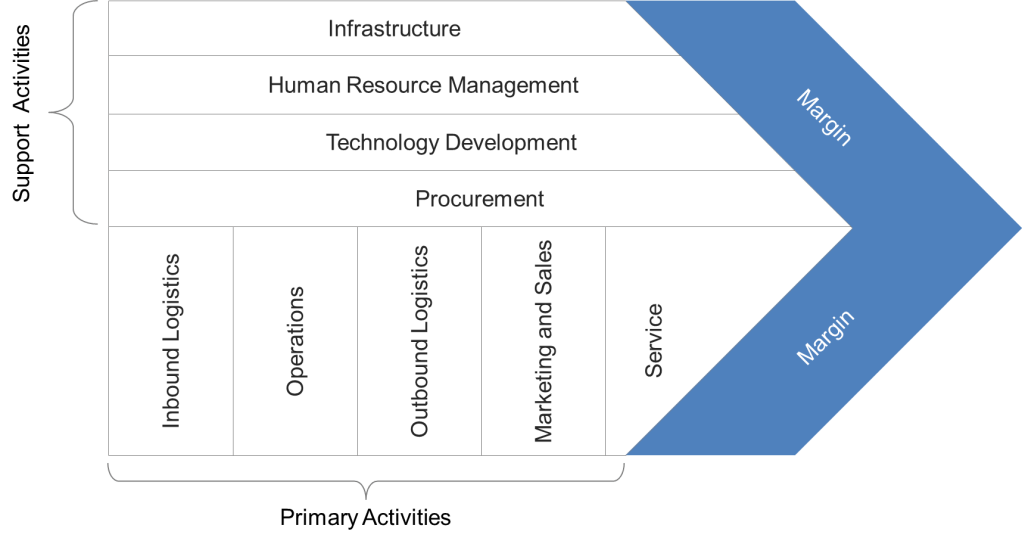
  1. Strategic Layer: Anchored in Porter’s Value Chain, this layer distinguishes primary activities (e.g., manufacturing, service delivery) from support processes (e.g., HR, IT). By mapping these relationships through high-level process landscapes, leaders can identify which activities directly impact competitive advantage and allocate resources accordingly.
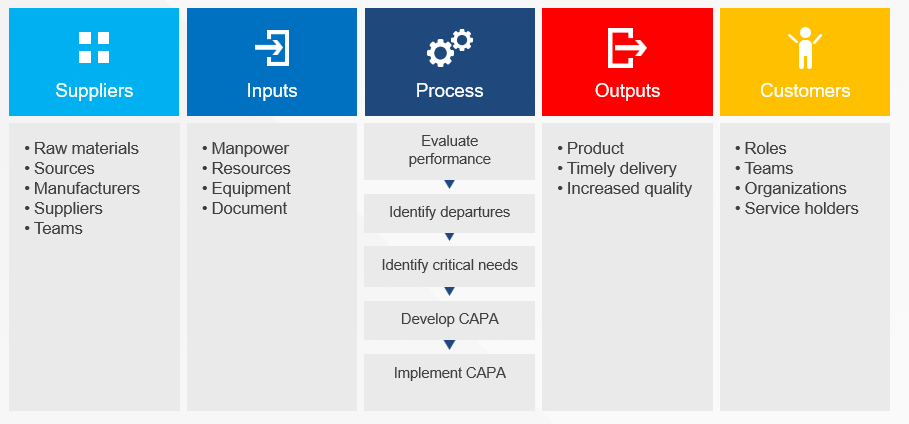
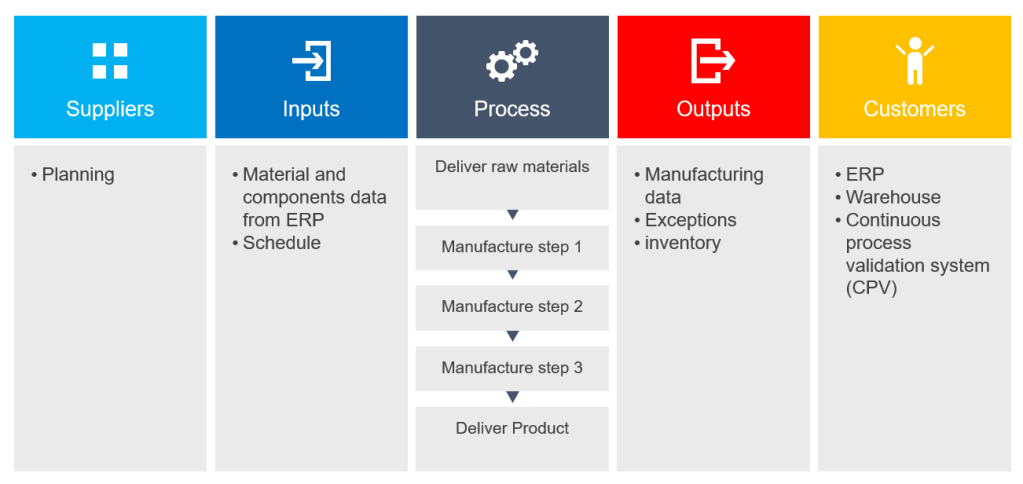
  2. Operational Layer: Here, SIPOC (Supplier-Input-Process-Output-Customer) diagrams define process boundaries, clarifying dependencies between internal workflows and external stakeholders. For example, a SIPOC analysis in a clinical trial supply chain might reveal that delayed reagent shipments from suppliers (an input) directly impact patient enrollment timelines (an output), prompting architectural adjustments to buffer inventory.
  3. Execution Layer: Detailed swimlane maps and BPMN models translate strategic and operational designs into actionable workflows. These tools, as discussed in our process mapping series, prevent scope creep by explicitly assigning responsibilities (via RACI matrices) and specifying decision gates.

Implementing Process Architecture: A Phased Approach
Developing a robust process architecture requires methodical execution:

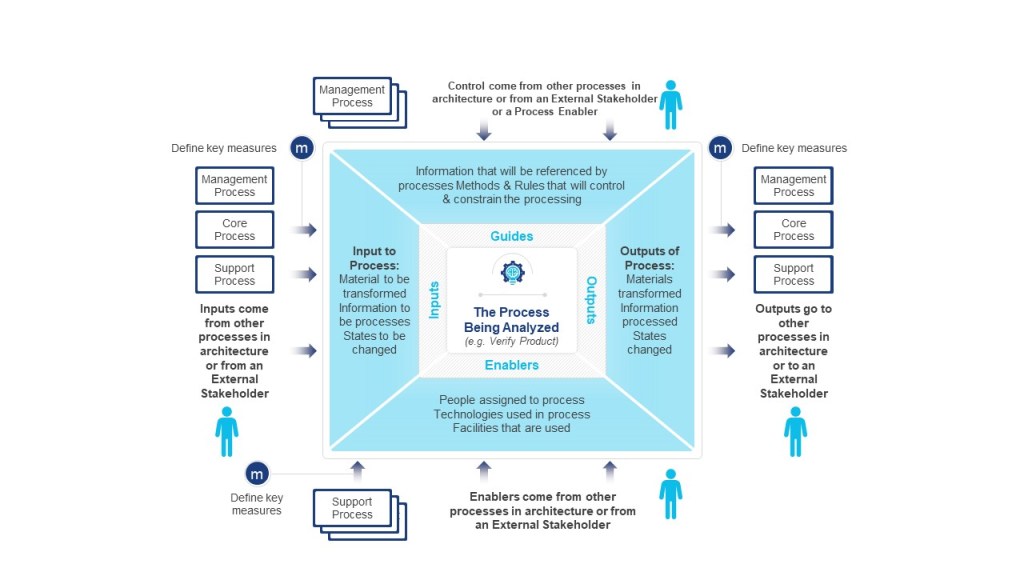
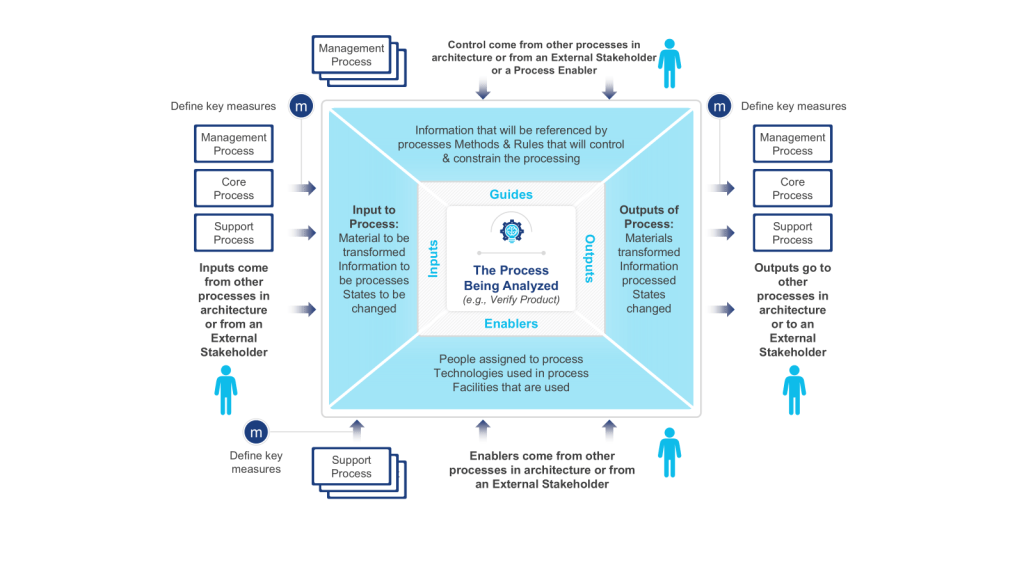
  • Value Identification: Begin with value chain analysis to isolate core customer-facing processes. IGOE (Input-Guide-Output-Enabler) diagrams help validate whether each architectural component contributes to customer value. For instance, a pharmaceutical company might use IGOEs to verify that its clinical trial recruitment process directly enables faster drug development (a strategic objective).
  • Interdependency Mapping: Cross-functional workshops map handoffs between departments using BPMN collaboration diagrams. These sessions often reveal hidden dependencies-such as quality assurance’s role in batch release decisions-that SIPOC analyses might overlook. By embedding RACI matrices into these models, organizations clarify accountability at each process juncture.
  • Governance Integration: Architectural governance ties process ownership to performance metrics. A biotech firm, for example, might assign a Process Owner for drug substance manufacturing, linking their KPIs (e.g., yield rates) to architectural review cycles. This mirrors our earlier discussions about sustaining process maps through governance protocols.

Sustaining Architecture Through Dynamic Process Mapping

Process architectures are not static artifacts; they require ongoing refinement to remain relevant. Our prior analysis of process mapping as a scaling solution emphasized the need for iterative updates-a principle that applies equally to architectural maintenance:

  • Quarterly SIPOC Updates: Revisiting supplier and customer relationships ensures inputs/outputs align with evolving conditions. A medical device manufacturer might adjust its SIPOC for component sourcing post-pandemic, substituting single-source suppliers with regional alternatives to mitigate supply chain risks.
  • Biannual Landscape Revisions: Organizational restructuring (e.g., mergers, departmental realignments) necessitates value chain reassessment. When a diagnostics lab integrates AI-driven pathology services, its process landscape must expand to include data governance workflows, ensuring compliance with new digital health regulations.
  • Trigger-Based IGOE Analysis: Regulatory changes or technological disruptions (e.g., adopting blockchain for data integrity) demand rapid architectural adjustments. IGOE diagrams help isolate which enablers (e.g., IT infrastructure) require upgrades to support updated processes.

This maintenance cycle transforms process architecture from a passive reference model into an active decision-making tool, echoing our findings on using process maps for real-time operational adjustments.

Unifying Framework and Methodology: A Blueprint for Execution

The true power of BPM emerges when its framework and methodology dimensions converge. Consider a contract manufacturing organization (CMO) implementing BPM to reduce batch release timelines:

  1. Framework Application:
    • A value chain model prioritizes “Batch Documentation Review” as a critical path activity.
    • SIPOC analysis identifies regulatory agencies as key customers of the release process.
  2. Methodological Execution:
    • Swimlane mapping exposes delays in quality control’s document review step.
    • BPMN simulation tests a revised workflow where parallel document checks replace sequential approvals.
    • The organization automates checklist routing, cutting review time by 40%.
  3. Architectural Evolution:
    • Post-implementation, the process landscape is updated to reflect QC’s reduced role in routine reviews.
    • KPIs shift from “Documents Reviewed per Day” to “Right-First-Time Documentation Rate,” aligning with strategic goals for quality culture.

Strategic Insights for Practitioners

Architecture-Informed Problem Solving

A truly effective approach to process improvement begins with a clear understanding of the organization’s process architecture. When inefficiencies arise, it is vital to anchor any improvement initiative within the specific architectural layer where the issue is most pronounced. This means that before launching a solution, leaders and process owners should first diagnose whether the root cause of the problem lies at the strategic, operational, or tactical level of the process architecture. For instance, if an organization is consistently experiencing raw material shortages, the problem is situated within the operational layer. Addressing this requires a granular analysis of the supply chain, often using tools like SIPOC (Supplier, Input, Process, Output, Customer) diagrams to map supplier relationships and identify bottlenecks or gaps. The solution might involve renegotiating contracts with suppliers, diversifying the supplier base, or enhancing inventory management systems. On the other hand, if the organization is facing declining customer satisfaction, the issue likely resides at the strategic layer. Here, improvement efforts should focus on value chain realignment-re-examining how the organization delivers value to its customers, possibly by redesigning service offerings, improving customer touchpoints, or shifting strategic priorities. By anchoring problem-solving efforts in the appropriate architectural layer, organizations ensure that solutions are both targeted and effective, addressing the true source of inefficiency rather than just its symptoms.

Methodology Customization

No two organizations are alike, and the maturity of an organization’s processes should dictate the methods and tools used for business process management (BPM). Methodology customization is about tailoring the BPM lifecycle to fit the unique needs, scale, and sophistication of the organization. For startups and rapidly growing companies, the priority is often speed and adaptability. In these environments, rapid prototyping with BPMN (Business Process Model and Notation) can be invaluable. By quickly modeling and testing critical workflows, startups can iterate and refine their processes in real time, responding nimbly to market feedback and operational challenges. Conversely, larger enterprises with established Quality Management Systems (QMS) and more complex process landscapes require a different approach. Here, the focus shifts to integrating advanced tools such as process mining, which enables organizations to monitor and analyze process performance at scale. Process mining provides data-driven insights into how processes actually operate, uncovering hidden inefficiencies and compliance risks that might not be visible through manual mapping alone. In these mature organizations, BPM methodologies are often more formalized, with structured governance, rigorous documentation, and continuous improvement cycles embedded in the organizational culture. The key is to match the BPM approach to the organization’s stage of development, ensuring that process management practices are both practical and impactful.

Metrics Harmonization

For process improvement initiatives to drive meaningful and sustainable change, it is essential to align key performance indicators (KPIs) with the organization’s process architecture. This harmonization ensures that metrics at each architectural layer support and inform one another, creating a cascade of accountability that links day-to-day operations with strategic objectives. At the strategic layer, high-level metrics such as Time-to-Patient provide a broad view of organizational performance and customer impact. These strategic KPIs should directly influence the targets set at the operational layer, such as Batch Record Completion Rates, On-Time Delivery, or Defect Rates. By establishing this alignment, organizations can ensure that improvements made at the operational level contribute directly to strategic goals, rather than operating in isolation. Our previous work on dashboards for scaling solutions illustrates how visualizing these relationships can enhance transparency and drive performance. Dashboards that integrate metrics from multiple architectural layers enable leaders to quickly identify where breakdowns are occurring and to trace their impact up and down the value chain. This integrated approach to metrics not only supports better decision-making but also fosters a culture of shared accountability, where every team understands how their performance contributes to the organization’s overall success.

Process Mapping as a Scaling Solution (part 2)

Continuing our look a process mapping tools.

Process Flow Diagram

A process flow diagram is a visual representation of the steps in a process, showing the sequence of activities from start to finish. Using simple shapes and arrows, it maps out how work flows through your system, highlighting decision points, inputs, outputs, and the relationships between different steps. When most people think process map they really mean process flow.

When to Use Process Flow Diagrams

Process flow diagrams shine in various scenarios:

  1. Analyzing existing processes: They help identify inefficiencies, bottlenecks, and redundancies in current workflows.
  2. Designing new processes: When creating new procedures, flow diagrams provide a clear blueprint for implementation.
  3. Training and onboarding: They serve as excellent visual aids for explaining processes to new team members.
  4. Continuous improvement initiatives: Flow diagrams facilitate discussions about potential enhancements and streamlining opportunities.
  5. Compliance and auditing: They offer a standardized way to document processes for regulatory purposes.

Creating Effective Process Flow Diagrams

To make the most of your diagrams:

  1. Start with the big picture: Begin by outlining the major steps before diving into details.
  2. Use standard symbols: Stick to commonly recognized shapes (e.g., rectangles for activities, diamonds for decisions) to ensure clarity.
  3. Keep it simple: Avoid cluttering your diagram with too much information. Focus on the key steps and decision points.
  4. Involve the right people: Collaborate with those who actually perform the process to ensure accuracy.
  5. Review and refine: Regularly update your diagrams as processes evolve.

Benefits of Using Process Flow Diagrams

Process flow diagrams are truly one of the core quality tools. With them we can:

  • Improve communication: They provide a common visual language for discussing processes across teams.
  • Enhance efficiency: By clearly mapping out steps, you can more easily identify areas for optimization.
  • Better decision-making: Flow diagrams help managers understand the implications of process changes.
  • Increase standardization: They promote consistency in how tasks are performed across the organization.

Process flow diagrams are more than just pretty pictures – they’re powerful tools for understanding, improving, and communicating about your business processes. By incorporating them into your workflow analysis and design efforts, you’ll be taking a significant step towards operational excellence.

This is the level of process mapping that usually sits at the heart of the SOP.

Swim-Lane Flowchart

A swim lane flowchart, also known as a swim lane diagram or cross-functional flowchart, is a visual representation of a process that separates activities into distinct lanes. Each lane typically represents a different department, team, or individual responsible for a set of actions within the process.

Key Benefits of Swim Lane Flowcharts

  1. Clear Responsibility Assignment: By dividing the process into lanes, it’s immediately clear which team or individual is responsible for each step.
  2. Improved Communication: These diagrams provide a common visual language for discussing processes across departments.
  3. Identify Handoffs and Bottlenecks: Easily spot where work passes between teams and where delays might occur.
  4. Process Optimization: Visualizing the entire process helps identify redundancies and opportunities for streamlining.
  5. Onboarding and Training: New team members can quickly grasp complex processes and their role within them.

Creating an Effective Swim Lane Flowchart

To make the most of this tool:

  1. Define the Process Scope: Clearly identify the start and end points of the process you’re mapping.
  2. Identify Participants: Determine which departments or roles will have their own lanes.
  3. Map the Process: Use standard flowchart symbols to represent steps, decisions, and document flows.
  4. Show Handoffs: Clearly indicate where work passes from one lane to another.
  5. Review and Refine: Collaborate with stakeholders to ensure accuracy and identify improvement opportunities.

Data Maps are an example of a swim lane flow chart.

Process Flow with RACI Matrix

Here’s a blog post on process flow with RACI matrix:

Mastering Process Management: Combining Process Flow with RACI Matrix

This tool merges two powerful tools stand out for their ability to clarify complex workflows: the process flow diagram and the RACI matrix. When combined, these tools create a comprehensive view of not just how a process unfolds, but also who’s involved at each step. Let’s dive into this dynamic duo and explore how they can revolutionize your process management.

  • Process Flow Diagram: This visual representation maps out the sequence of steps in a process, showing how work progresses from start to finish.
  • RACI Matrix: This responsibility assignment chart clarifies the roles people play in each process step:
    • Responsible: Who does the work?
    • Accountable: Who makes the final decisions?
    • Consulted: Who provides input?
    • Informed: Who needs to be kept in the loop?

When you combine a process flow with a RACI matrix, you create a comprehensive view of your process that answers two critical questions:

  1. What happens in the process?
  2. Who’s involved at each step?

This integration strives to provide clarity of roles. It becomes immediately clear who’s responsible for each step, reducing confusion and improving accountability. Team members can easily see where they fit into the larger process and who they need to interact with. This should hopefully help balance resources and streamline decision-making. It is a great tool for training.

Creating Your Integrated Diagram

To build your process flow with RACI matrix:

  1. Start with Your Process Flow: Map out the steps of your process using standard flowchart symbols.
  2. Add RACI Information: For each step, indicate the R, A, C, and I roles. This can be done through color-coding, symbols, or additional columns next to each step.
  3. Review and Refine: Collaborate with stakeholders to ensure the diagram accurately reflects both the process and the roles involved.
  4. Use It: Implement the diagram in your operations, referring to it for training, process improvement, and day-to-day management.

Example

Imagine a verification process:

  1. Requirements Gathering (R: Business Analyst, A: Molecule Steward, C: Quality, Engineers, Operations)
  2. Design (R: Engineer, A: Molecule Steward, I: Validation)
  3. Verification (R: Validation A: Quality, C: Engineers, I: Molecule Steward)
  4. Deployment (R: Operations, A: Molecule Steward C: Quality, I: All Stakeholders)

Integrating process flows with RACI matrices creates a powerful tool for process management. It not only shows how work gets done but also clarifies who’s involved every step of the way. This comprehensive view can lead to more efficient operations, clearer communication, and ultimately, better business outcomes.

Value Stream Map

Value Stream Mapping (CSM) is a process mapping technique used to analyze, design, and manage the flow of materials and information required to bring a product or service to a customer. It is a visual representation of every step in your process, from the initial order to the final delivery of the product or service.

Coming out of Lean and organization excellence the value stream map is all about identifying waste: VSM helps you spot non-value-adding activities in your processes, allowing you to eliminate them and improve efficiency.

How to Create a Value Stream Map

  1. Create a Current State Map: Document your process as it currently exists, including material and information flows.
  2. Analyze the Current State: Identify areas of waste and inefficiency in your current process.
  3. Design a Future State Map: Envision an improved process that eliminates the identified waste.
  4. Implement Changes: Develop and execute a plan to move from the current state to the future state.
  5. Review and Iterate: Continuously monitor your new process and make further improvements as needed.

Best Practices for Value Stream Mapping

  1. Involve Cross-Functional Teams: Ensure representatives from all relevant departments participate in the mapping process.
  2. Focus on the Customer: Always keep the end customer’s needs in mind when analyzing and improving your processes.
  3. Use Standard Symbols: Adopt a consistent set of symbols to represent different elements of your value stream.
  4. Walk the Process: Physically follow the flow of materials and information to gain a firsthand understanding of your processes.
  5. Measure Key Metrics: Collect data on important metrics like cycle time, lead time, and inventory levels to quantify improvements.

Process Mapping as a Scaling Solution (part 1)

I love a good process map in all it’s permutations. It is important to remember that the various process mapping tools are on a scale on order of detail and complexity.

Tool NameDescription
Process Landscape DiagramA Process Landscape Diagram is a visual representation that outlines the structure and interdependencies of processes within an organization, providing insight into how these processes work together to achieve strategic goals. This tool helps in understanding process flows and managing business operations more effectively by illustrating connections and hierarchies among various processes.
SIPOCSIPOC is a visual representation tool for documenting a business process from beginning to end. It provides a high-level overview by summarizing the key components of Suppliers, Inputs, Processes, Outputs, and Customers.
Scope Diagram (IGOE Diagram)
The Scope Diagram, also known as the IGOE Diagram, is used to define and agree on the boundaries of a process, enhancing communication among stakeholders. This diagram illustrates the scope of a project at a high abstraction level and helps identify candidate processes for change. It focuses on the Inputs, Guides, Outputs, and Enablers of a business process, facilitating better understanding and management of the scope by clarifying process boundaries without detailing internal system features.
Process MapA Process Map is a visual tool used to represent the flow of work and the steps involved in a business process. This tool helps teams understand, analyze, and improve workflows by detailing the processes involved, making it easier to identify inefficiencies and areas for improvement. Process maps are often utilized in project management and continuous improvement efforts to enhance productivity and streamline operations.
Process Flow DiagramA Process Flow Diagram (PFD) is a diagram commonly used to indicate the general flow of plant processes and equipment. It visualizes the sequential steps and relationships between components in a process, aiming to improve project planning and identify inefficiencies.
Swim-lane Flow ChartA Swim-lane Flow Chart, also known as a cross-functional diagram, is a type of flowchart that shows the workflow and responsibilities in a process. It visually segments tasks into lanes that clarify who is responsible for each step, making it easier to understand complex processes and identify inefficiencies or redundancies.
Process Flow with RACI matrixThe RACI matrix is a project management tool that clarifies roles and responsibilities of team members by categorizing them into four groups: Responsible, Accountable, Consulted, and Informed. This structure aids in ensuring effective communication and workflow management across various stages of a project, helping teams stay aligned and avoiding confusion.
Process Mapping Tools

Process Landscape Diagram

A process landscape diagram is a high-level visual representation of an organization’s business processes and their relationships. Process landscape diagrams provide a comprehensive overview of an organization’s processes at a macro level and define the scope and relationships between an organization’s business processes. This serves as a simple way to handle process-related communication and serves as a starting point for detailed process discovery.

The process landscape diagram represents processes as ‘black-boxes’, focusing on interrelationships rather than internal details. Thus it shows the structure, grouping, modularity, functionality, and technology of chain processes, business processes, and working processes. Ideally this should include connections to external participants or stakeholders.

Components and Structure

A typical process landscape diagram may include:

  • Core processes (value chain or end-to-end processes)
  • Management processes
  • Support processes
  • Relationships and dependencies between processes
  • Connections to external participants or stakeholders

When to do

The process landscape diagram is design to enable organizations to maintain an overview of processes which makes this an excellent centerpiece to your Quality Manual.

ICH Q10 actually has a nice process landscape in it.

SIPOC

I’ve written about SIPOC’s in the past.

SIPOC diagrams are powerful tools in process improvement and management, offering numerous advantages that make them invaluable in various scenarios. These diagrams provide a high-level overview of a process, enabling teams to grasp the big picture quickly and efficiently. By facilitating clear communication and collaboration among team members and stakeholders, SIPOC diagrams help break down silos and foster a shared understanding of complex processes. This clarity often leads to the identification of improvement opportunities and potential problem areas that might otherwise go unnoticed.

One of the key strengths of SIPOC diagrams lies in their versatility. They serve as excellent tools for defining and scoping complex projects, helping teams to set clear boundaries and objectives from the outset. Additionally, these diagrams aid in understanding customer requirements and managing supplier relationships, two critical aspects of any business process. SIPOC diagrams also prove invaluable as training tools for new employees, offering a concise yet comprehensive overview of how a process functions within the larger organizational context.

The use of SIPOC diagrams is particularly beneficial when embarking on new process improvement projects or redesigning existing processes by providing a structured approach to understanding the current state and envisioning future improvements. They’re also extremely useful in situations where the scope of a project is unclear or poorly defined, helping to bring clarity and focus to the team’s efforts.

SIPOC diagrams excel in fostering cross-functional collaboration. By providing a common language and visual representation of a process, they facilitate discussions and decision-making among different departments or stakeholders. This makes them particularly valuable in problem-solving initiatives and when ensuring compliance with regulations and standards. SIPOC diagrams also serve as effective tools for supplier evaluation and performance assessment, helping organizations maintain strong relationships with their supply chain partners.

SIPOC diagrams are most effective when there’s a need to quickly visualize and understand a process without delving into excessive detail. They help teams focus on the essential elements of a process and provide a solid foundation for more in-depth analysis and improvement efforts. Whether used in the early stages of a project, for ongoing process management, or as part of continuous improvement initiatives, SIPOC diagrams offer a simple yet powerful way to enhance understanding, communication, and efficiency across an organization.

I love a SIPOC in a program level document.

Scope Diagram (IGOE Diagram)

IGOE stands for Inputs-Guides-Outputs-Enablers, the basic components of any business process. This model is used to define the scope of a process with an initial, high-level overview of the process in-scope and the problems associated with that process and the relationships between the process-in-scope, upstream or downstream processes, relevant documents, stakeholders etc.

Scope Diagram- IGOE
  • Input is defined as something that is transformed or consumed, input can be information, materials, people
  • Guide is defined as anything that describes the when, why, or how a process or activity occurs, guides can be policies, strategies, regulations, law
  • Outputs are the product or result of the change that occurs to the Inputs or the result of the creation of something based on the Guides, outputs can be results, deliverables, products, information, people
  • Enablers are the resources or assets required to transform an Input into an Output or to create Outputs, enablers can be systems, equipment, tools, assets, facilities, human resources

These diagrams are particularly useful at the outset of a process improvement project, serving as a powerful means to define and agree upon the boundaries of a process. By clearly illustrating the process scope and interactions, IGOE diagrams play a crucial role in setting the right expectations among project stakeholders and establishing a solid foundation for the improvement effort.

One of the key strengths of IGOE diagrams lies in their ability to measure the reach of a process. By explicitly showing how the business interacts with external entities, these diagrams provide a systematic way to assess impact. This can really help identify stakeholders in a project.

Process owners and subject matter experts often turn to IGOE diagrams for high-level root cause analysis. This application allows them to conduct a relatively accurate assessment to determine the focus and scope of an improvement project.

Scope diagrams excel in enhancing communication with various stakeholders. Their intuitive nature and lack of technical jargon make them accessible to a wide audience, facilitating better understanding and alignment among team members and stakeholders. This clarity in communication is particularly beneficial when defining vision and building consensus.

Another significant advantage of scope diagrams is their ability to illustrate process dependencies. By providing a clear picture of the factors that shape processes, these diagrams create a better understanding of potential future process iterations. This insight is invaluable during task prioritization, as the additional information about importance and impact can guide strategic decision-making in the project.

Scope diagrams are most effective in communicating a comprehensive understanding of a process’s scope, boundaries, and interactions with its environment. Whether used at the beginning of an improvement initiative, for aligning stakeholders on process scope and impact, or as a precursor to more detailed process analysis, IGOE diagrams offer a structured and insightful approach to process understanding and improvement planning.

This is a tool we don’t use enough.

Process Map

Process maps are powerful visual tools that provide a clear and comprehensive representation of workflows or processes within an organization. These diagrams illustrate the sequence of steps, activities, and decisions involved in completing a task or achieving a specific outcome. By offering a visual overview of how a process works from start to finish, process maps serve multiple purposes, including identifying inefficiencies and bottlenecks, facilitating communication among team members and stakeholders, and serving as valuable training resources for new employees.

The versatility of process maps makes them indispensable in various business scenarios. At the outset of process improvement projects, these visual aids help teams gain a thorough understanding of the current state of a process before embarking on optimization or redesign efforts. They are particularly useful when defining project scope, as they assist in setting clear boundaries and expectations for process improvement initiatives. For complex processes, maps break down intricate workflows into more manageable, understandable steps, making them easier to analyze and improve.

Process maps excel as communication tools, proving invaluable during team brainstorming sessions by providing a visual aid for discussing and analyzing processes. They also serve as effective training resources for new hires, offering a clear, step-by-step guide to understanding roles and responsibilities within the organization. When documenting standard operating procedures, process maps complement written instructions, enhancing clarity and comprehension.

In problem-solving scenarios, process maps are instrumental in identifying the root causes of issues within a workflow. They allow teams to examine each step of a process for efficiency and effectiveness during process analysis, leading to more targeted improvements. Furthermore, process maps provide a concise way to explain processes to stakeholders who may not be directly involved in day-to-day operations, fostering better understanding and alignment across the organization.

When implementing new systems or technologies, process maps help identify how these tools will impact existing workflows, facilitating smoother transitions and integration. This makes them particularly valuable in organizations focused on continuous improvement, quality management, and operational efficiency.

Process maps are versatile tools that can be employed whenever there’s a need to understand, analyze, improve, or communicate about a process. Their visual nature makes complex information more accessible, promoting better decision-making and more effective process management. Whether used in small-scale departmental improvements or large-scale organizational transformations, process maps remain a fundamental tool in the arsenal of business process management and continuous improvement methodologies.

In my next post in this series I will start with Business Process Notation as a methodology for process mapping.

Understanding How to Organize Process

Process drives the work we do. We can evaluate processes on two axis – complexity and strategy – that help us decide the best way to manage and improve the processes.

Process by Complexity and Strategy

Process complexity and dynamics are what types of tasks are involved in the process. Is it a simple, repetitive procedure with a few rules for handling cases outside of normal operation? Or is it a complex procedure with lots of decision points and special case rules? Think of this like driving somewhere. Driving to your local grocery is a simple procedure, with few possibilities of exceptions. Driving across the country has a ton of variables and dynamism to it.

While complexity can help drive the decision to automate, I strongly recommend that when thinking about it don’t ask if it can be automated, only ask what would be involved if a human were to do the job or how it is done with current technologies. Starting with the answer of automation leads to automation for automation’s sake, and that is a waste.

Dynamics is how much the process changes – some change rarely while others change rapidly to keep pace in response to changes in product or external factors (such as regulations).

Strategic importance asks about the value the process contributes to meeting requirements. Is the process a core competency, or an enabling process that needs to be accomplished to ensure that you can do something else that meets the core requirements? Needless to say, one company’s strategic process is another company’s routine process, which is why more and more we are looking at organizations as ecosystems.

Processes are in a hierarchy, and we use levels to describe the subdivision of processes. We’ve discussed the difference between process, procedure and task. At the process level we usually have the high-level process, the architecture level, which are the big things an organization does (e.g. research, manufacture, distribute), mid-level processes that are more discrete activities (e.g. perform a clinical study) to even more discrete processes (e.g. launch a study) which usually have several levels (e.g. select sites, manage TMF) to finally procedure and task.

Level of ProcessIncludesKey Ways to Address
High-Level ProcessHow key objectives are met, highly cross functionalOrganization design. System Design
Mid-level ProcessHow a specific set of departments do their major work blocksProcess Improvement
Low-level processHow individuals conduct their work in sub-blocksKnowledge management, task analysis, training
Levels of Process

To truly get to this level of understanding of process, we need to understand just what our process is, which is where tools like the SIPOC or Process Scope diagram can come in handy.

Process Scope Diagram

To understand a process we want to understand six major aspects: Output, Input, Enablers, Controls, Process Flow, People.

Complex and Complicated as Tools for Process Understanding

Simple processes usually follow a consistent, well-defined sequence of steps with clearly defined rules. Each step or task can be precisely defined, and the sequence lacks branches or exceptions.

More complicated processes involve branches and exceptions, usually draw on many rules, and tend to be slightly less defined. Complicated processes require more initiative on the part of human performers.

Complex processes are ones that require a high level of initiative and creativity from people. These processes rapidly change and evolve as time passes. Successful performance usually requires a connection to an evolving body of knowledge. They are highly creative and have a large degree of unpredictability. Most complex processes are viewed at the system level.

Sources

  • Benedict, T. et al. BPM CBOK Version 4.0: Guide to the Business Process Management Common Body of Knowledge. ABMP International, 2019.
  • Harmon, Paul. Business Process Change. Morgan Kaufmann, 2019.
  • Nuland, Y. and Duffy, G. Validating a Best Practice. Productivity Press, 2020

SIPOC for Data Governance

The SIPOC is a great tool for understanding data and fits nicely into a larger data process mapping initiative.

By understanding where the data comes from (Suppler), what it is used for (Customer) and what is done to the data on its trip from supplier to the customer (Process), you can:

  • Understand the requirements that the customer has for the data
  • Understand the rules governing how the data is provided
  • Determine the gap between what is required and what is provided
  • Track the root cause of data failures – both of type and of quality
  • Create requirements for modifying the processes that move the data

The SIPOC can be applied at many levels of detail. At a high level, for example, batch data is used to determine supply. At a detailed level, a rule for calculating a data element can result in an unexpected number because of a condition that was not anticipated.

SIPOC for manufacturing data utilizing the MES (high level)