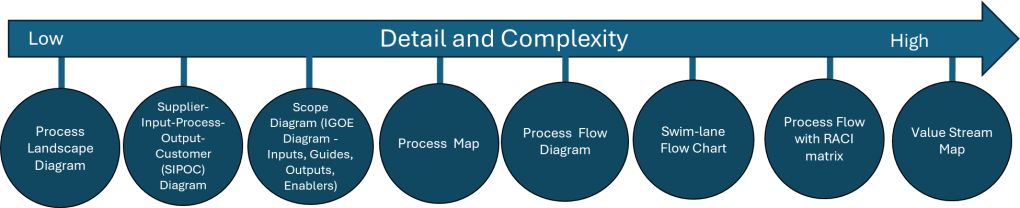
I love a good process map in all it’s permutations. It is important to remember that the various process mapping tools are on a scale on order of detail and complexity.
| Tool Name | Description |
| Process Landscape Diagram | A Process Landscape Diagram is a visual representation that outlines the structure and interdependencies of processes within an organization, providing insight into how these processes work together to achieve strategic goals. This tool helps in understanding process flows and managing business operations more effectively by illustrating connections and hierarchies among various processes. |
| SIPOC | SIPOC is a visual representation tool for documenting a business process from beginning to end. It provides a high-level overview by summarizing the key components of Suppliers, Inputs, Processes, Outputs, and Customers. |
| Scope Diagram (IGOE Diagram) | The Scope Diagram, also known as the IGOE Diagram, is used to define and agree on the boundaries of a process, enhancing communication among stakeholders. This diagram illustrates the scope of a project at a high abstraction level and helps identify candidate processes for change. It focuses on the Inputs, Guides, Outputs, and Enablers of a business process, facilitating better understanding and management of the scope by clarifying process boundaries without detailing internal system features. |
| Process Map | A Process Map is a visual tool used to represent the flow of work and the steps involved in a business process. This tool helps teams understand, analyze, and improve workflows by detailing the processes involved, making it easier to identify inefficiencies and areas for improvement. Process maps are often utilized in project management and continuous improvement efforts to enhance productivity and streamline operations. |
| Process Flow Diagram | A Process Flow Diagram (PFD) is a diagram commonly used to indicate the general flow of plant processes and equipment. It visualizes the sequential steps and relationships between components in a process, aiming to improve project planning and identify inefficiencies. |
| Swim-lane Flow Chart | A Swim-lane Flow Chart, also known as a cross-functional diagram, is a type of flowchart that shows the workflow and responsibilities in a process. It visually segments tasks into lanes that clarify who is responsible for each step, making it easier to understand complex processes and identify inefficiencies or redundancies. |
| Process Flow with RACI matrix | The RACI matrix is a project management tool that clarifies roles and responsibilities of team members by categorizing them into four groups: Responsible, Accountable, Consulted, and Informed. This structure aids in ensuring effective communication and workflow management across various stages of a project, helping teams stay aligned and avoiding confusion. |
Process Landscape Diagram
A process landscape diagram is a high-level visual representation of an organization’s business processes and their relationships. Process landscape diagrams provide a comprehensive overview of an organization’s processes at a macro level and define the scope and relationships between an organization’s business processes. This serves as a simple way to handle process-related communication and serves as a starting point for detailed process discovery.
The process landscape diagram represents processes as ‘black-boxes’, focusing on interrelationships rather than internal details. Thus it shows the structure, grouping, modularity, functionality, and technology of chain processes, business processes, and working processes. Ideally this should include connections to external participants or stakeholders.
Components and Structure
A typical process landscape diagram may include:
- Core processes (value chain or end-to-end processes)
- Management processes
- Support processes
- Relationships and dependencies between processes
- Connections to external participants or stakeholders
When to do
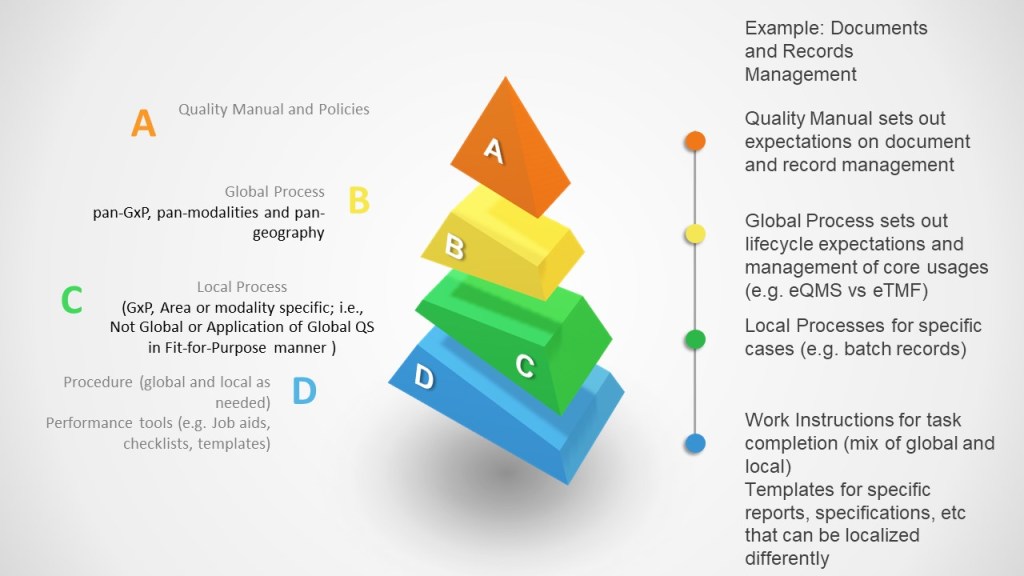
The process landscape diagram is design to enable organizations to maintain an overview of processes which makes this an excellent centerpiece to your Quality Manual.
ICH Q10 actually has a nice process landscape in it.

SIPOC
I’ve written about SIPOC’s in the past.
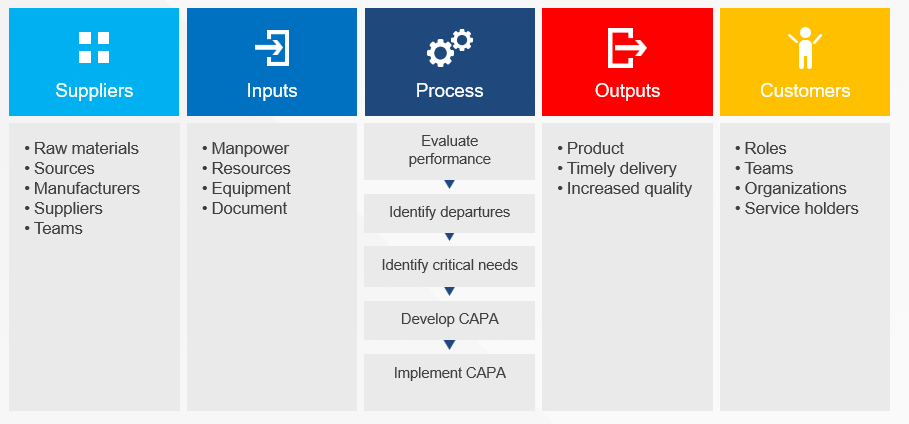
SIPOC diagrams are powerful tools in process improvement and management, offering numerous advantages that make them invaluable in various scenarios. These diagrams provide a high-level overview of a process, enabling teams to grasp the big picture quickly and efficiently. By facilitating clear communication and collaboration among team members and stakeholders, SIPOC diagrams help break down silos and foster a shared understanding of complex processes. This clarity often leads to the identification of improvement opportunities and potential problem areas that might otherwise go unnoticed.
One of the key strengths of SIPOC diagrams lies in their versatility. They serve as excellent tools for defining and scoping complex projects, helping teams to set clear boundaries and objectives from the outset. Additionally, these diagrams aid in understanding customer requirements and managing supplier relationships, two critical aspects of any business process. SIPOC diagrams also prove invaluable as training tools for new employees, offering a concise yet comprehensive overview of how a process functions within the larger organizational context.
The use of SIPOC diagrams is particularly beneficial when embarking on new process improvement projects or redesigning existing processes by providing a structured approach to understanding the current state and envisioning future improvements. They’re also extremely useful in situations where the scope of a project is unclear or poorly defined, helping to bring clarity and focus to the team’s efforts.
SIPOC diagrams excel in fostering cross-functional collaboration. By providing a common language and visual representation of a process, they facilitate discussions and decision-making among different departments or stakeholders. This makes them particularly valuable in problem-solving initiatives and when ensuring compliance with regulations and standards. SIPOC diagrams also serve as effective tools for supplier evaluation and performance assessment, helping organizations maintain strong relationships with their supply chain partners.
SIPOC diagrams are most effective when there’s a need to quickly visualize and understand a process without delving into excessive detail. They help teams focus on the essential elements of a process and provide a solid foundation for more in-depth analysis and improvement efforts. Whether used in the early stages of a project, for ongoing process management, or as part of continuous improvement initiatives, SIPOC diagrams offer a simple yet powerful way to enhance understanding, communication, and efficiency across an organization.
I love a SIPOC in a program level document.
Scope Diagram (IGOE Diagram)
IGOE stands for Inputs-Guides-Outputs-Enablers, the basic components of any business process. This model is used to define the scope of a process with an initial, high-level overview of the process in-scope and the problems associated with that process and the relationships between the process-in-scope, upstream or downstream processes, relevant documents, stakeholders etc.
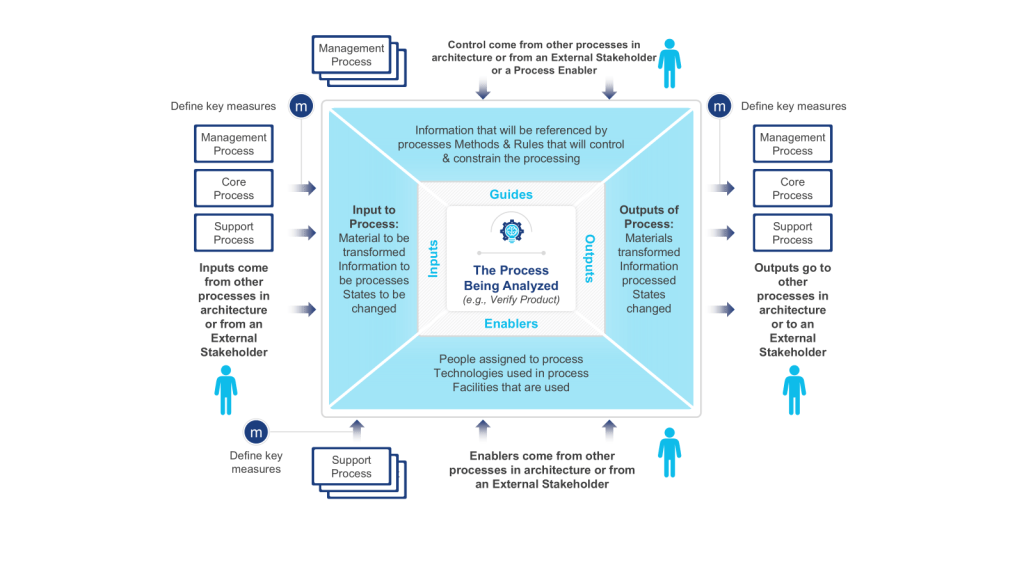
- Input is defined as something that is transformed or consumed, input can be information, materials, people
- Guide is defined as anything that describes the when, why, or how a process or activity occurs, guides can be policies, strategies, regulations, law
- Outputs are the product or result of the change that occurs to the Inputs or the result of the creation of something based on the Guides, outputs can be results, deliverables, products, information, people
- Enablers are the resources or assets required to transform an Input into an Output or to create Outputs, enablers can be systems, equipment, tools, assets, facilities, human resources
These diagrams are particularly useful at the outset of a process improvement project, serving as a powerful means to define and agree upon the boundaries of a process. By clearly illustrating the process scope and interactions, IGOE diagrams play a crucial role in setting the right expectations among project stakeholders and establishing a solid foundation for the improvement effort.
One of the key strengths of IGOE diagrams lies in their ability to measure the reach of a process. By explicitly showing how the business interacts with external entities, these diagrams provide a systematic way to assess impact. This can really help identify stakeholders in a project.
Process owners and subject matter experts often turn to IGOE diagrams for high-level root cause analysis. This application allows them to conduct a relatively accurate assessment to determine the focus and scope of an improvement project.
Scope diagrams excel in enhancing communication with various stakeholders. Their intuitive nature and lack of technical jargon make them accessible to a wide audience, facilitating better understanding and alignment among team members and stakeholders. This clarity in communication is particularly beneficial when defining vision and building consensus.
Another significant advantage of scope diagrams is their ability to illustrate process dependencies. By providing a clear picture of the factors that shape processes, these diagrams create a better understanding of potential future process iterations. This insight is invaluable during task prioritization, as the additional information about importance and impact can guide strategic decision-making in the project.
Scope diagrams are most effective in communicating a comprehensive understanding of a process’s scope, boundaries, and interactions with its environment. Whether used at the beginning of an improvement initiative, for aligning stakeholders on process scope and impact, or as a precursor to more detailed process analysis, IGOE diagrams offer a structured and insightful approach to process understanding and improvement planning.
This is a tool we don’t use enough.
Process Map
Process maps are powerful visual tools that provide a clear and comprehensive representation of workflows or processes within an organization. These diagrams illustrate the sequence of steps, activities, and decisions involved in completing a task or achieving a specific outcome. By offering a visual overview of how a process works from start to finish, process maps serve multiple purposes, including identifying inefficiencies and bottlenecks, facilitating communication among team members and stakeholders, and serving as valuable training resources for new employees.
The versatility of process maps makes them indispensable in various business scenarios. At the outset of process improvement projects, these visual aids help teams gain a thorough understanding of the current state of a process before embarking on optimization or redesign efforts. They are particularly useful when defining project scope, as they assist in setting clear boundaries and expectations for process improvement initiatives. For complex processes, maps break down intricate workflows into more manageable, understandable steps, making them easier to analyze and improve.
Process maps excel as communication tools, proving invaluable during team brainstorming sessions by providing a visual aid for discussing and analyzing processes. They also serve as effective training resources for new hires, offering a clear, step-by-step guide to understanding roles and responsibilities within the organization. When documenting standard operating procedures, process maps complement written instructions, enhancing clarity and comprehension.
In problem-solving scenarios, process maps are instrumental in identifying the root causes of issues within a workflow. They allow teams to examine each step of a process for efficiency and effectiveness during process analysis, leading to more targeted improvements. Furthermore, process maps provide a concise way to explain processes to stakeholders who may not be directly involved in day-to-day operations, fostering better understanding and alignment across the organization.
When implementing new systems or technologies, process maps help identify how these tools will impact existing workflows, facilitating smoother transitions and integration. This makes them particularly valuable in organizations focused on continuous improvement, quality management, and operational efficiency.
Process maps are versatile tools that can be employed whenever there’s a need to understand, analyze, improve, or communicate about a process. Their visual nature makes complex information more accessible, promoting better decision-making and more effective process management. Whether used in small-scale departmental improvements or large-scale organizational transformations, process maps remain a fundamental tool in the arsenal of business process management and continuous improvement methodologies.
In my next post in this series I will start with Business Process Notation as a methodology for process mapping.